IPC-4556 印制板化学镍钯浸金(ENEPIG)规范ENG.pdf - 第77页
T ypical Measurement data achievable with properly calibrated SDD-Detector XRF Nominal values of standard measured, Au49nm/Pd100nm/Ni4387nm N Au [nm] Pd [nm] Ni [nm] 1 48.5 97.9 4375 2 48.7 98.6 4381 3 48.6 99.0 4383 4 4…

APPENDIX 10
Gage Capability. Gage R&R Type 1 Study
Michael Haller
Chief Operating Offıcer
Fischer Technology
Goal: Test of gage capability with respect to repeatability and mean of measurement values for a given tolerance.
• Preferably the gage capability is conducted with a calibrated reference standard, with its reference value approximately in
the middle of the tolerance field.
• At defined measurement points the reference standard is to be measured with n ≥25 times under repeatability conditions.
• For measurement criteria with Upper and Lower Specification Limits (USL and LSL): T=USL-LSL
• For measurement criteria with only a one-sided specification limit (USL or LSL): T is not existent. In this case the allow-
able measurement value lies below USL -4 s or above LSL +4 s.
• The value of the reference standard should be within ± 10 % of the USL or LSL.
• If Gage capability Indexes are to be calculated. use the following formulas.
(The instrument capability is checked thru the Cg and Cgk values. These are defined as:
Gage capability:
C
g
=
0.2 z T
6 z s
C
gk
=
–
0.1 z T –
|
x–x
m
|
3 z s
–
Where: T = tolerance, s = standard deviation), x
m
= mean of standard and x = mean value measurement.
Note: A gage is considered capable if Cg ≥1.33 and Cgk ≥1.33
IPC-4556 January 2013
66
Typical Measurement data achievable with properly calibrated SDD-Detector XRF
Nominal values of standard measured, Au49nm/Pd100nm/Ni4387nm
N Au [nm] Pd [nm] Ni [nm]
1 48.5 97.9 4375
2 48.7 98.6 4381
3 48.6 99.0 4383
4 48.8 100.1 4392
5 49.0 100.1 4388
6 48.8 100.0 4394
7 48.8 99.8 4385
8 48.8 98.9 4384
9 48.9 99.3 4383
10 49.3 100.4 4390
11 48.9 99.7 4385
12 49.2 100.7 4389
13 49.0 101.0 4393
14 49.4 99.7 4390
15 48.8 99.7 4396
16 49.2 100.7 4394
17 48.6 99.6 4387
18 48.9 100.3 4387
19 49.1 100.2 4386
20 49.1 100.4 4395
21 49.3 100.5 4390
22 48.5 100.0 4395
23 48.4 99.0 4383
24 49.2 98.5 4389
25 49.1 98.0 4385
Mean 48.92 nm 99.68 nm 4388.0 nm
Standard Deviation 0.286 nm 0.837 nm 5.112 nm
C.O.V. (%) 0.59 0.84 0.12
Range 1.07 nm 3.14 nm 20.2 nm
# of readings 25 25 25
Min. Read. 48.4 nm 97.9 nm 4375 nm
Max. Read. 49.4 nm 101.0 nm 4396 nm
Measuring Time 120 sec 120 sec. 120 sec.
January 2013 IPC-4556
67
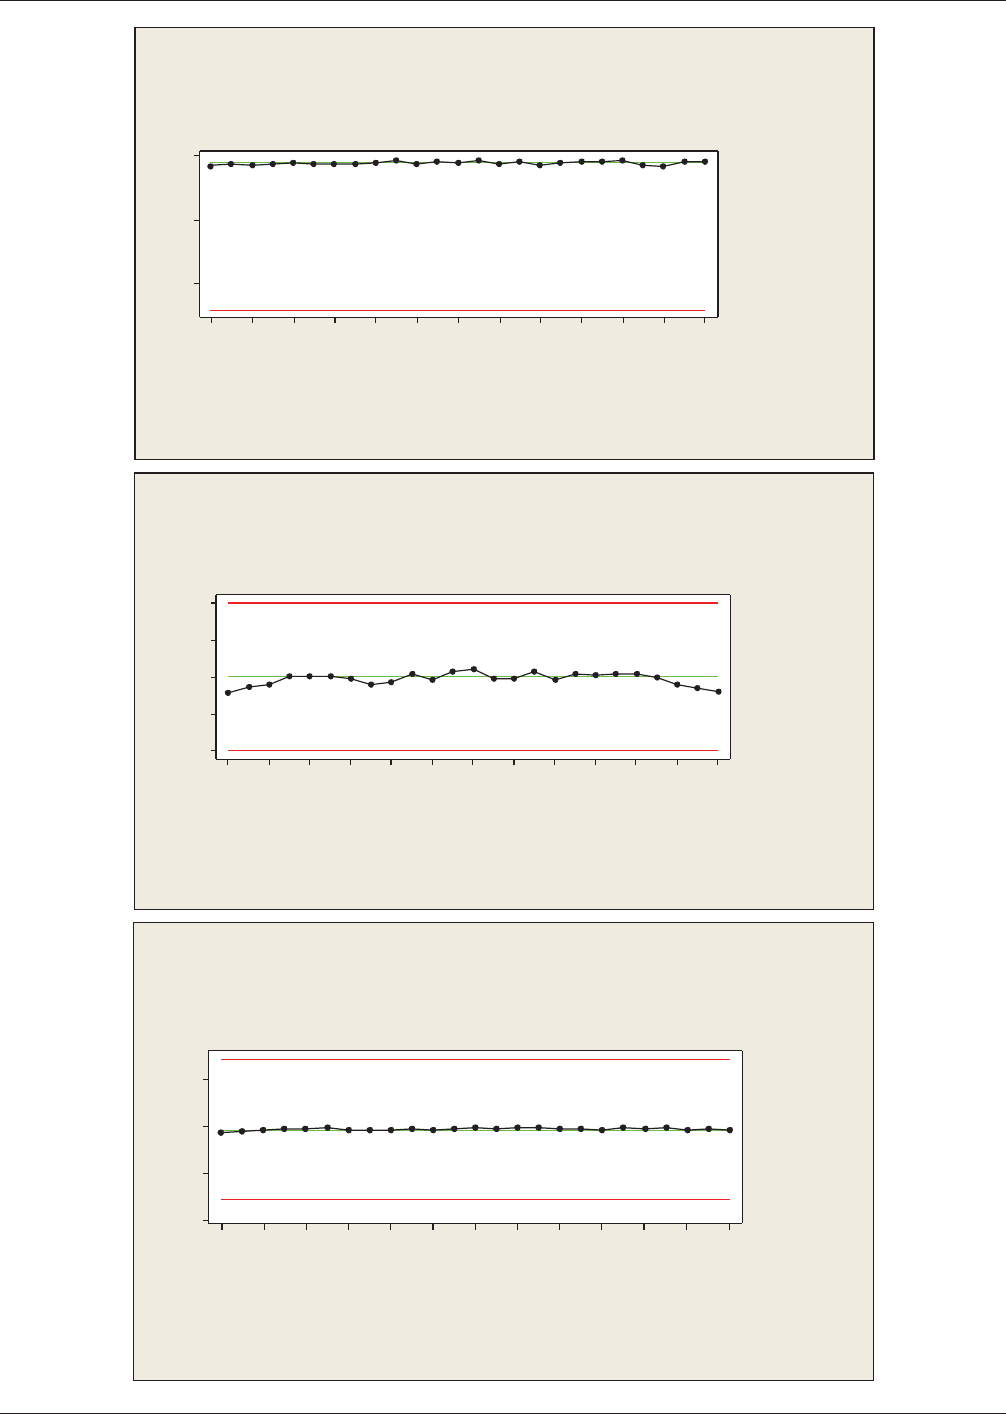
25
23
21191715131197531
50
40
30
30
A
u
[n
Observation
m]
Ref
LS L + 4.0 * S tD ev
Reported by :
LS L: 25
Reference 49
Mean 48.92
StDev 0.286
6 * S tDev (S V ) 1.718
LS L 25
Basic S tatistics
Misc: ENEPIG-Au Measurements
Type 1 Gage Study for Au
Gage name:XRF
Run Chart of A u
Date of study :
252321191715131197531
110
105
100
95
90
Observation
Pd
Ref
Ref + 0.10 * Tol
Ref - 0.10 * Tol
Basic S tatistics
Reference 100
Mean 99.68
6 * S tDev (S V ) 5.021
Tolerance (Tol) 100
StDev 0.837
C apability
C g 3.98
Cgk 3.86
Reported by :
Tolerance: 100
Gage name:XRF
% V ar(Repeatability ) 5.02%
% V ar(Repeatability and Bias) 5.19%
Date of study :
Misc: ENEPIG-Pd Measurements
Run Chart of Pd
Type 1 Gage Study for Pd
252321191715131197531
4600
4400
4200
4000
Observation
Ni
Ref
Ref + 0.10 * Tol
Ref - 0.10 * Tol
Basic S tatistics
Reference 4387
Mean 4388.02
6 * S tDev (S V ) 30.670
Tolerance (Tol) 3000
StDev 5.112
C apability
C g 19.56
C gk 19.50
Reported by :
Tolerance: 3000
Gage name:XRF
% V ar(Repeatability ) 1.02%
%V ar(Repeatability and Bias) 1.03%
Date of study :
Misc: ENEPIG-Ni Measurements
Run Chart of Ni
Type 1 Gage Study for N i
IPC-4556 January 2013
68