N7201A652E.pdf - 第229页
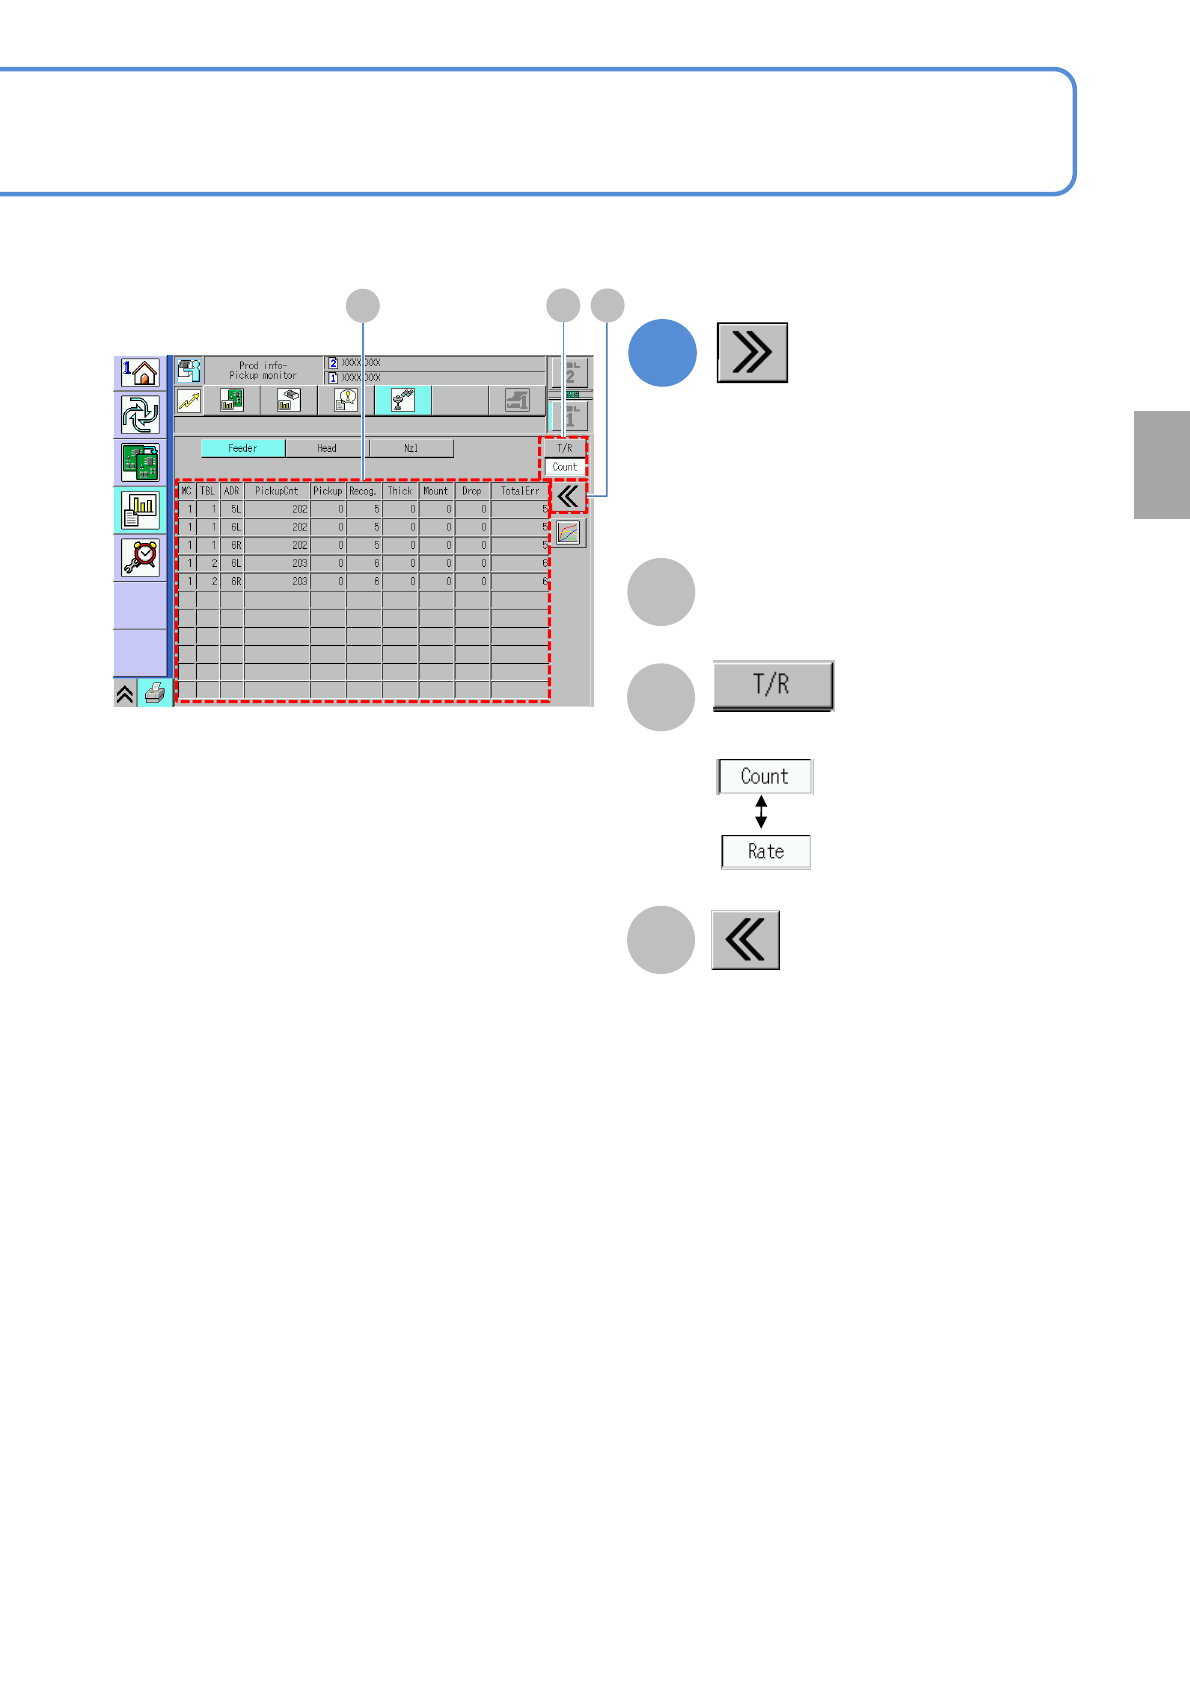
NPM- TT2 EJM1EE-MB -03O-02 3-2-9 -2 A B Returns to the previous screen. C Pickup information per feeder ( → P.3-2-1 -8 ) Choose the display type. 2 (Detailed error information is displayed) Production A B C

NPM-TT2 EJM1EE-MB-03O-02
3-2-9-1
1
You can check feeder component information per feeder address.
Produc-
tion
informa-
tion
Operating procedure
3-2-9
A
Pickup information per feeder
(→P.3-2-1-8)
B
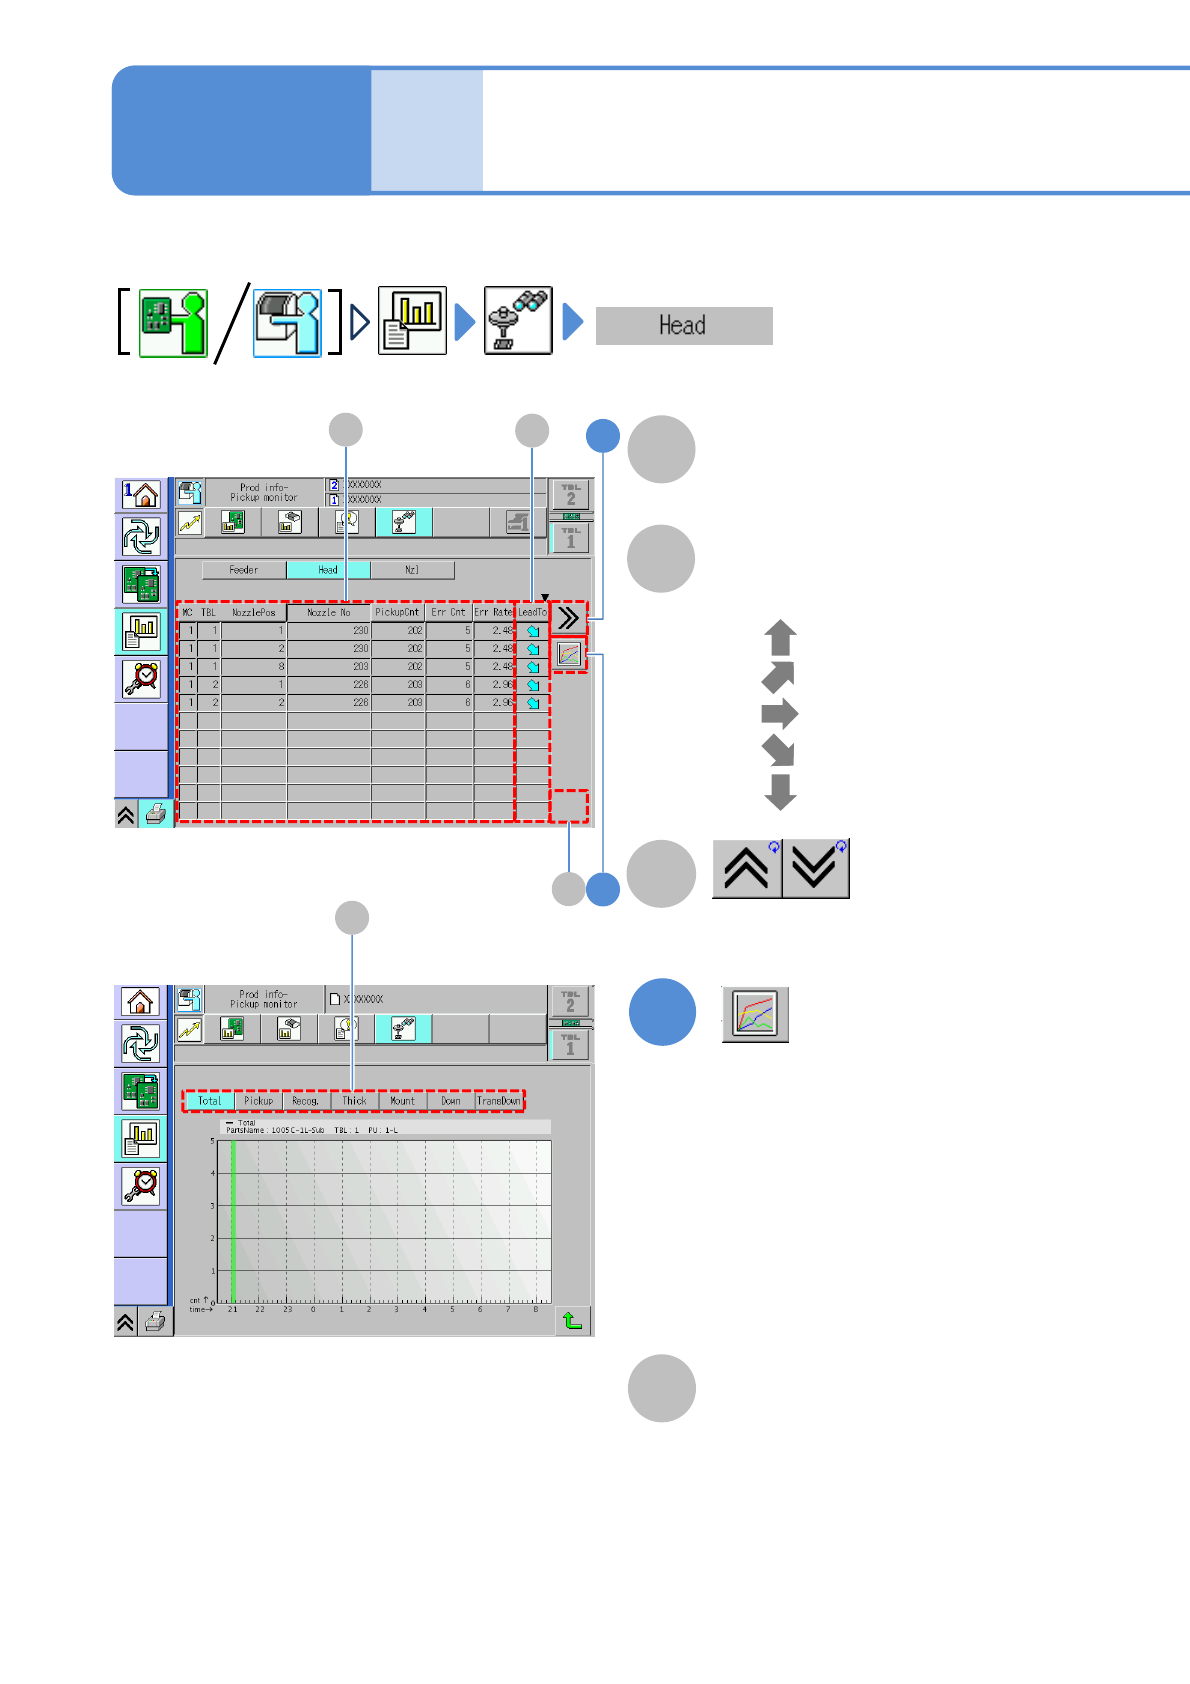
LeadTo
Displays increase or decrease tendency
of the error rate.
●
●
●
●
●
: Ultra up tendency
: Up tendency
: Constant tendency
: Ultra down tendency
: Down tendency
Shows the previous or next table.
C
Feeder pickup monitor
(Displays component error count in a
graph)
●Error count of the selecting feeder
per hour is displayed on the graph.
Vertical axis: Error count
Horizontal axis: Time
●Choosing the total error or an error
item can change the display of the
graph
D
Total error and error item
(→ P.3-2-3-2)
D
C
A
2
B
1
NPM-TT2 EJM1EE-MB-03O-02
3-2-9-2
A
B
Returns to the previous screen.
C
Pickup information per feeder
(→P.3-2-1-8)
Choose the display type.
2
(Detailed error information is displayed)
Production
A
B C
NPM-TT2 EJM1EE-MB-03O-02
You can check component pickup information of a nozzle, per nozzle.
Produc-
tion
informa-
tion
Head pickup monitor
1
B
(Displays component error count in a
graph)
A
LeadTo
Displays increase or decrease tendency
of the error rate.
●
●
●
●
●
: Ultra up tendency
: Up tendency
: Constant tendency
: Ultra down tendency
: Down tendency
Pickup information per head
(→P.3-2-1-10)
Shows the previous or next table.
C
●Error count of the selecting head
per hour is displayed on the graph.
Vertical axis: Error count
Horizontal axis: Time
●Choosing the total error or an error
item can change the display of the
graph
D
Total error and error item
(→ P.3-2-4-2)
3-2-10-1
Operating procedure
3-2-10
D
1
2
B
C
A