M3plus_OperationManual_e.pdf - 第56页
2 - 23 2 Basic oper ation 4. Starting and finishing production Delay Time (sec/board, sec) Shows the time that the machine has waited for PCB unloading. Note that when the machine is mounting components or the upstream m…
2 -22
2
Basic operation
4. Starting and finishing production
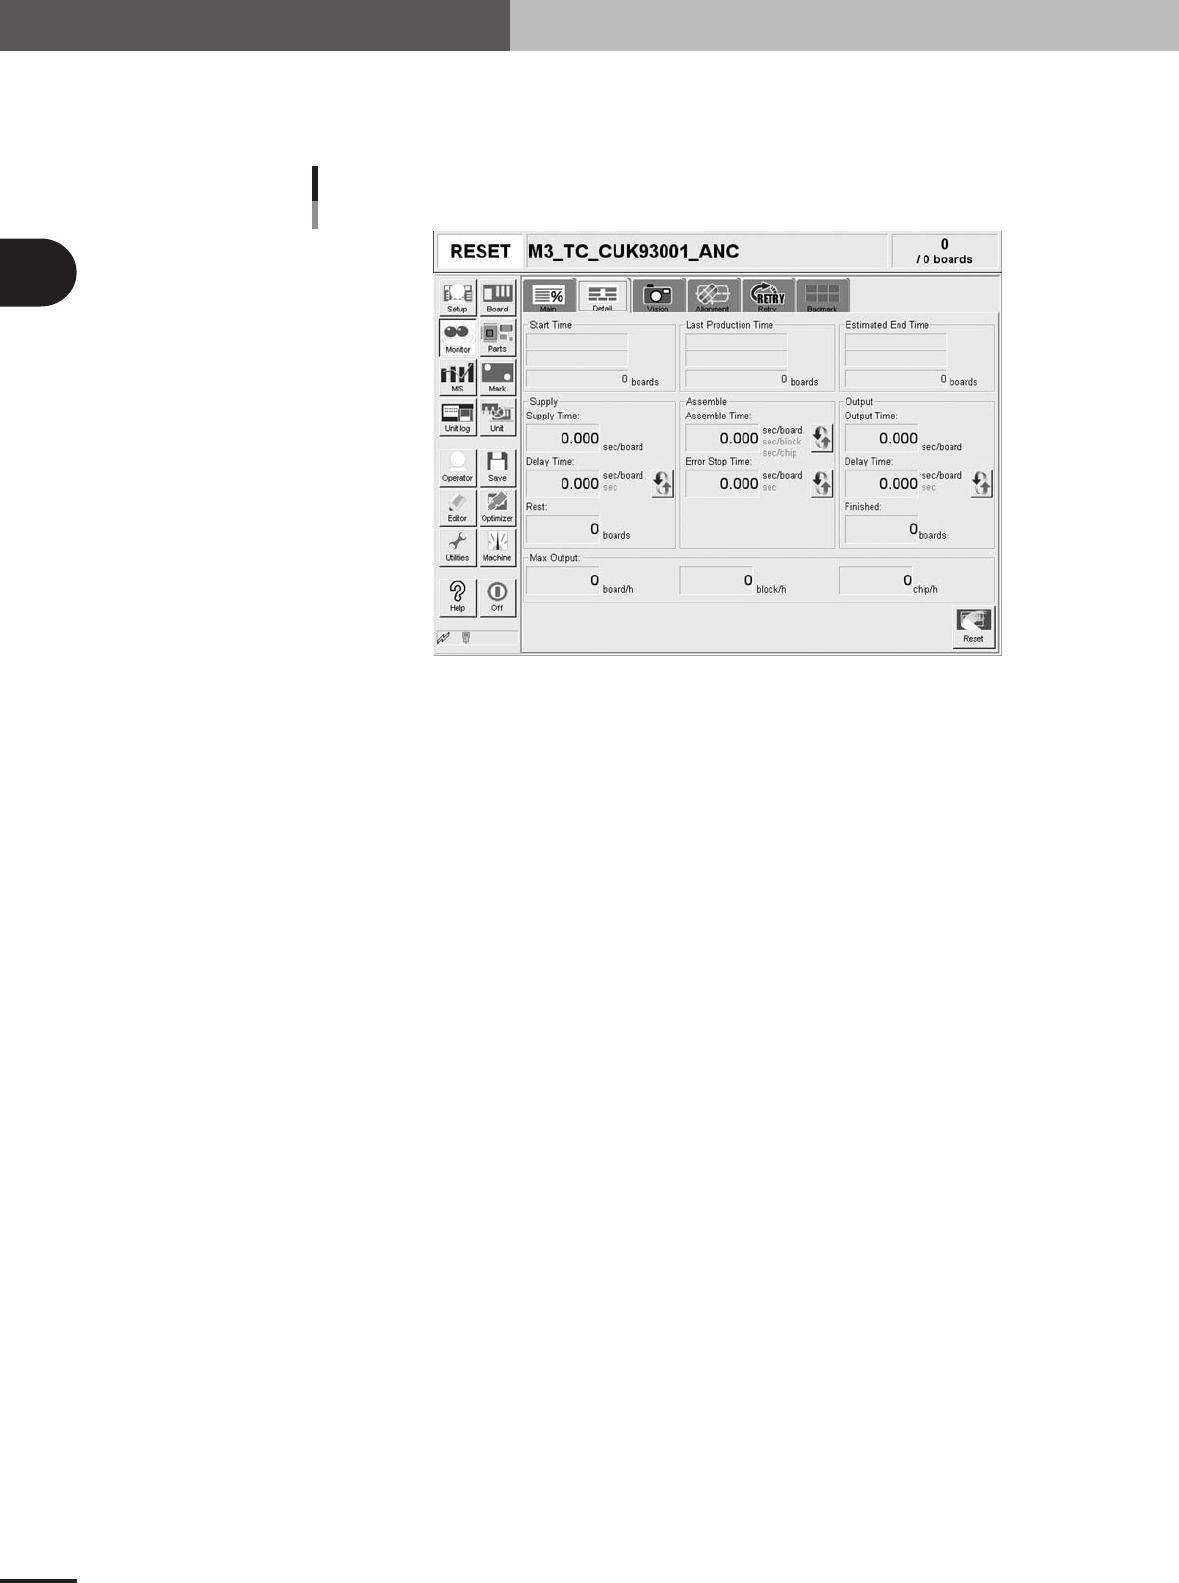
Monitor: Detail
The [Monitor]-[Detail] tab screen shows you the detailed production status of the current production
PCB data.
Monitor: Detail
27306-5E-20
Start Time
Shows the time that production was started (time that board selection was completed). The quantity
is normally zero boards.
Last Production Time
Shows the display data update time. The quantity is the number of PCBs produced up to the present
time.
Estimated End Time
Shows the estimated production end time. The quantity is the scheduled production quantity input on
the [Setup] screen. Note that this will be blank if the scheduled production quantity has not been
input.
Supply Time (sec/board)
Shows the average loading time per board.
Delay Time (sec/board)
Shows the time that the machine has waited for PCB loading. Note that when the machine is
mounting components, the delay time will not be counted even if the PCB is standing by. The
average delay time per board or the cumulative delay time can be displayed by pressing the [Unit
Change] button.
Rest (boards)
This is the value obtained by subtracting the production completed board quantity from the scheduled
production quantity.
Assemble Time (sec/board, sec/block, sec/chip)
Shows the time for mounting the board. This time includes the mark recognition (fiducial, bad mark,
etc.), component pickup, component recognition, mounting, dispensing, retry operation, nozzle
change and component dump time, etc. The average time per board, average time per block or the
average time per chip can be displayed by pressing the [Unit Change] button.
Error Stop Time (sec/board, sec)
Shows the time that the machine has been stopped with an error, and is the total from when the error
occurs to when the [CLEAR] button is pressed. Note that the time for recovery is not included. The
average error stop time per board or the cumulative error stop time can be displayed by pressing the
[Unit Change] button.
Output Time (sec/board)
Shows the average unloading time per board.

2 -23
2
Basic operation
4. Starting and finishing production
Delay Time (sec/board, sec)
Shows the time that the machine has waited for PCB unloading. Note that when the machine is
mounting components or the upstream machine is standing by for supply, the delay time will not be
counted even if the PCB is standing by for unloading. The average unloading delay time per board or
the cumulative unloading delay time can be displayed by pressing the [Unit Change] button.
Finished (boards)
Shows the quantity of finished PCBs.
Max. Output
board/h
This is the number of PCBs that can be produced in an hour. This is calculated in reverse from the
average mounting time and average transfer time. Note that the PCB supply delay time and error
stop time are not included.
block/h
This is the number of blocks that can be produced in an hour. This is calculated in reverse from the
average mounting time and number of blocks per board in the PCB information.
chip/h
This is the number of chips that can be produced in an hour. This is calculated in reverse from the
"Cycle Time (sec/chip)" displayed on the [Main] tab screen.
[Reset] button
Resets the production control information, including the various data, current production quantity,
current unloader quantity, scheduled production quantity and scheduled unloader quantity displayed
on the screen. The "Board Counter" value on the [Setup] screen is also reset when this production
data is reset.
2 -24
2
Basic operation
4. Starting and finishing production
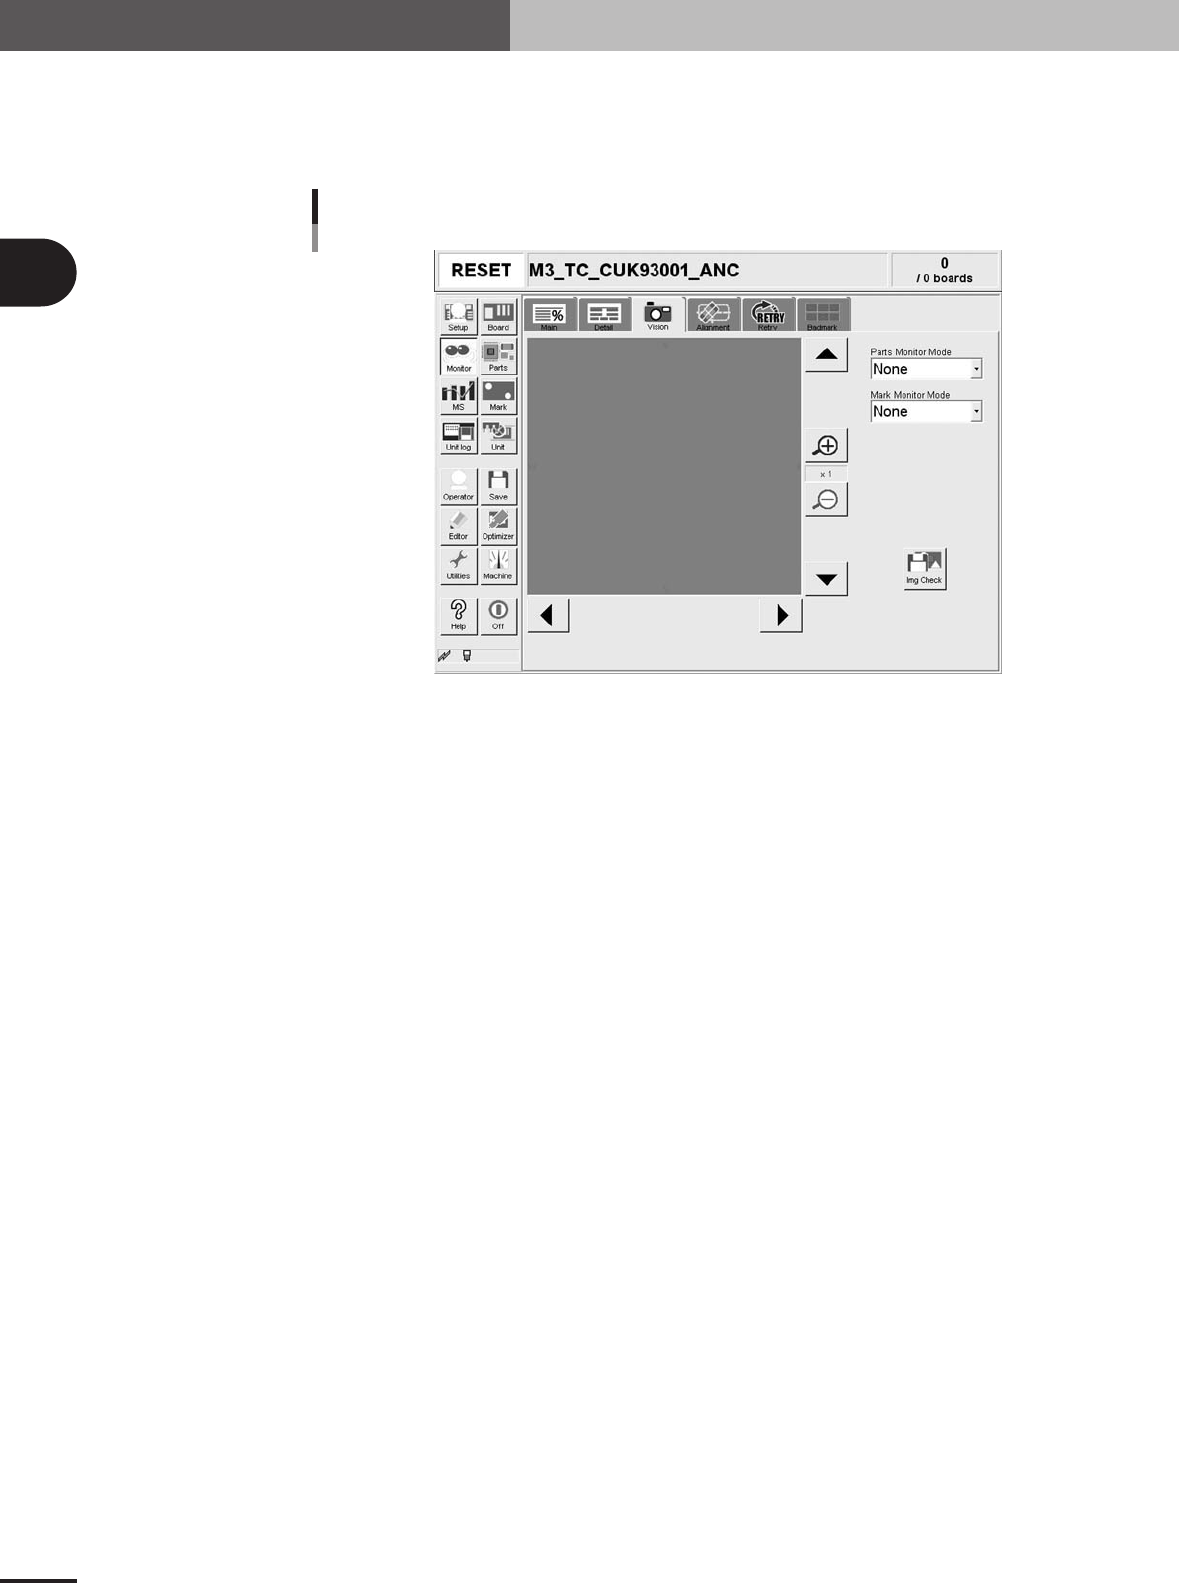
Monitor: Vision
When the fiducial mark, badmark or component is recognized during automatic operation, the
recognized image is displayed. When used with a multi-vision camera, the components will be
recognized continuously at a high speed, so only the component recognized last will be displayed.
Monitor: Vision
27307-5E-20
Enlarge/reduce buttons
The recognition results image can be enlarged from 1 to 16 times by pressing the enlarge (+) button.
The image can be reduced to 1/16 by pressing the reduce (-) button. Note that when the image is
enlarged, the smooth part edges may appear jagged, and when reduced, gray sections may appear
around the edges. But this is not a fault.
Up/down/left/right buttons
The arrow buttons at the right top and bottom of the screen are used to move the image vertically.
The arrow buttons at the bottom left and right of the screen are used to move the image horizontally.
Use these arrow buttons to view a section of the image that is not displayed on the screen.
Parts Monitor Mode
This specifies the mode for displaying the components on the monitor during vision recognition.
Depending on the selected item, the recognition results and detection range window will appear on
the image. This monitor mode can also be changed during operation.
"None"
Displays the image taken by the camera. The recognition result values are not displayed.
"Vision Result"
Displays information such as the recognition results X, Y and R direction position (pixels) and
number of detection leads. Note that the displayed items will differ according to the component
recognition type.
"Detection Range"
Draws a window for the component detection range. If the component does not fit within the
detection range, it will not be recognized correctly. In this case, check the pickup state or correct
the component data.
"Datum Pos."
Displays a cross cursor indicating the position used as a reference for detecting the lead or
component edge.
"Find Line"
Displays the line used for component detection, on a chip component or on the component leads. If
the detection line position is incorrect, adjust the Vision parameters.