13_Application_News_No_SCA_210_050.pdf - 第2页
▪ Exp erimental The sample is au toma tically delivered to a tube containing a filter, to which r eagents are adde d, mixed and then filtered. Precisely, 100 µL of acetonitrile were added to a PTFE filter vial (0. 45 µm …
Liquid Chromatography Mass Spectrometry
Fully automated sample preparation procedure to measure drugs
of abuse by liquid chromatography tandem mass spectrometry
▪ Abstract
For the analysis of drugs and pharmaceutical
compounds in biological matrices, extraction
procedures are typically used for LC-MS/MS
analysis which often require manual steps in
sample preparation. In this study, we report a fully
automated extraction directly coupled to an LC-
MS/MS system for the determination of
amphetamines, cocaine and opiates.
42 target compounds and 20 deuterated internal
standards were included in the method. The
extraction was carried out by a programable liquid
handler (CLAM-2000, Shimadzu) coupled directly
to an LC-MS/MS system (Nexera X2 reversed
phase LC separation & LCMS-8060, Shimadzu).
The acquisition was performed in positive
ionization mode with up to 15 MRM transitions per
compound, each with optimized collision energy
(MRM Spectrum mode) to enable qualitative library
searching in addition to quantitation.
This approach was successfully designed to
support parallel sample preparation and analysis
therefore significantly increasing sample
throughput and reducing cycle times.
▪ Introduction
Opiates, amphetamines (including analogues) and
cocaine are widely used drugs of abuse (DOA) and
many laboratories have developed LC-MS/MS
procedures to identify and quantify these compounds
[1-5] Such measurements are needed in multiple
contexts within clinical and forensic toxicology
(suspicion of overdose, monitoring of addicts, driving
under the influence of drugs, doping control).
To minimize the possibility of false positive or
negative results reporting without compromising the
accuracy, precision and limits of detection, methods
were developed to combine the sensitivity of MRM
detection with the identification power of MRM
spectrum. The method has the capability of following
up to 15 MRM transitions per compound and
enabling precise, accurate quantitation and library
searchable compound identification. Each transition
has optimized collision energies for each ion. Ion
intensities from each transition are used to construct
an MRM Spectrum that can be used to search
against registered library spectra.
To develop an automated generic sample
preparation method in clinical toxicology analysis, an
automated sample preparation system (the CLAM-
2000) was coupled to LC-MS/MS system (8060).
Once the primary tube is loaded onto the automated
system, no human intervention was required. The
sample is automatically delivered to a tube
containing a filter, to which reagents are added,
mixed and then filtered. The extract is finally injected
into the LC-MS-MS system.
The procedure was fully validated: repeatability,
reproducibility, matrix effects, extraction yields, inter-
matrix agreement, dilution tests and robustness.
To test its viability, the method was applied to
patients blood or plasma samples and compared
against a validated LC-MS/MS method using 2
MRM’s for each target compound [5].
No. SCA_210_050
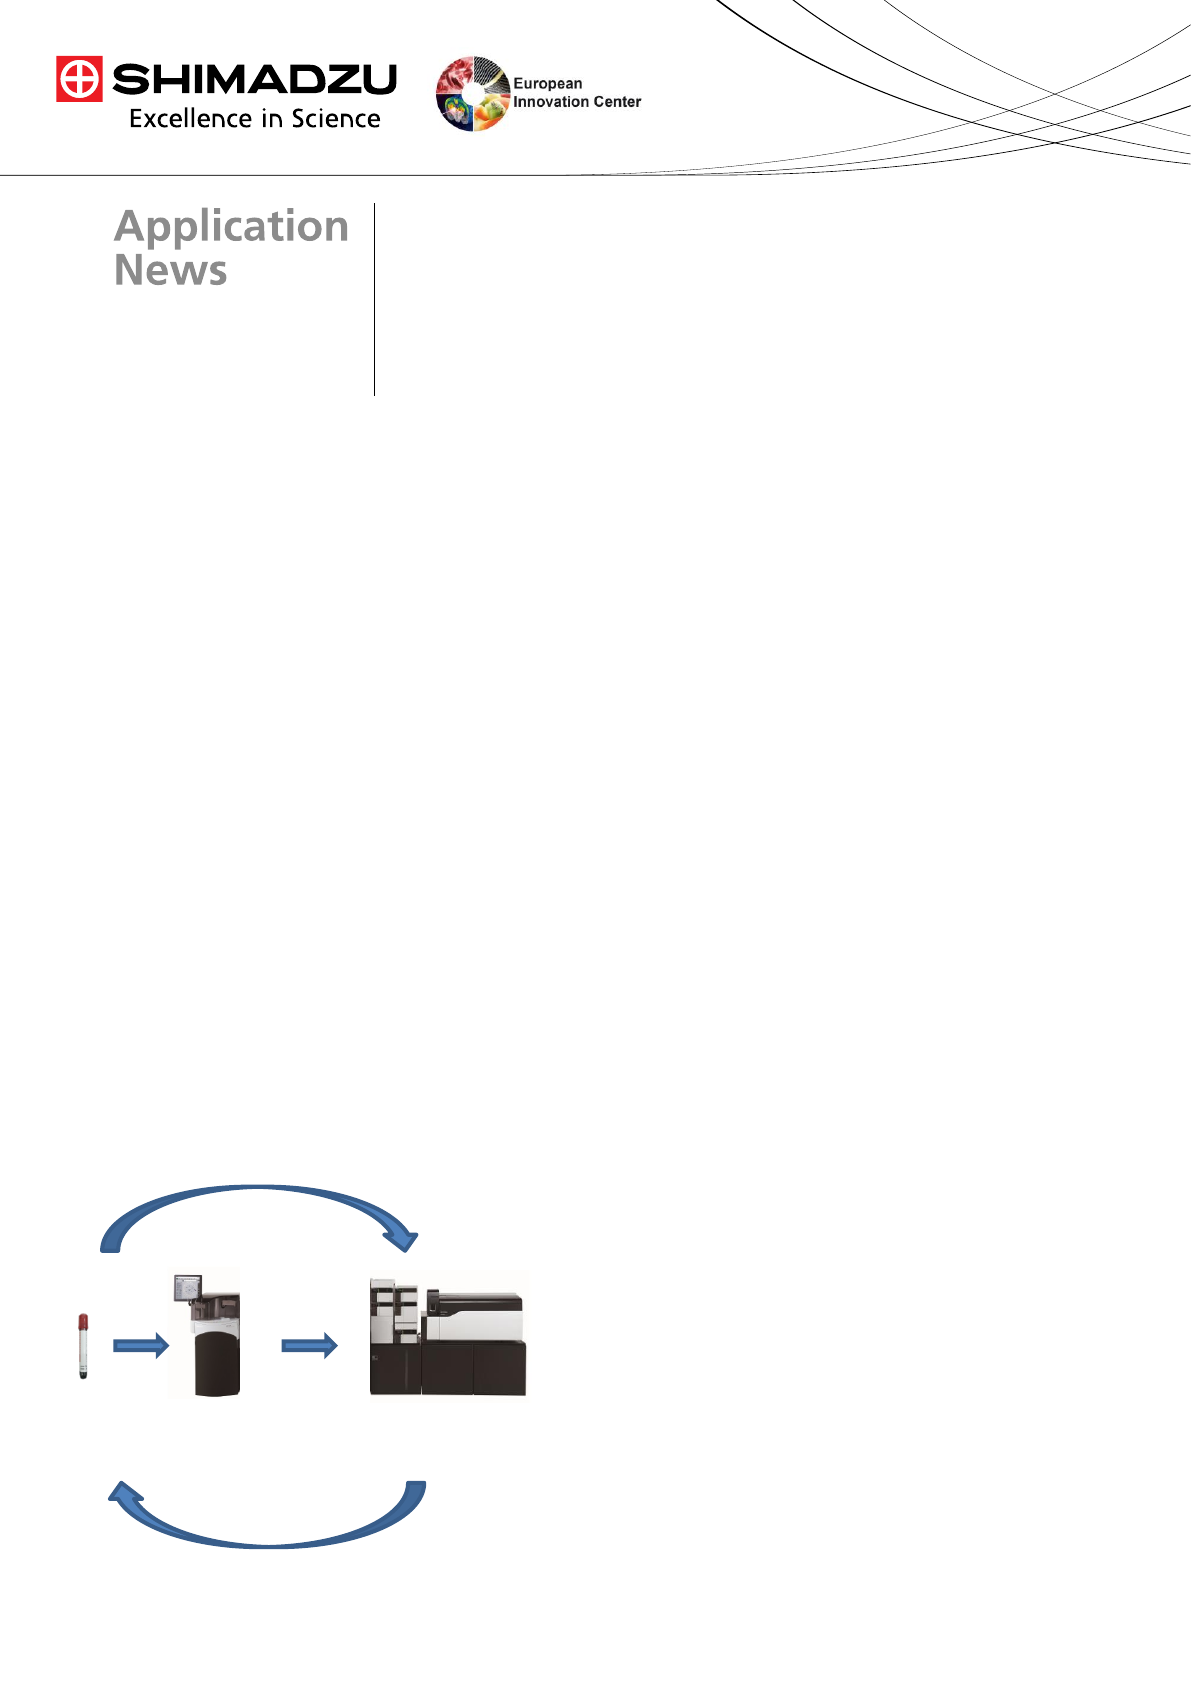
42 DOA Automated sample
preparation
(CLAM-2000)
MS identification and
quantification
(MRM spectrum mode)
18 minutes
No human intervention
Figure 1: sample analysis cycle
Tiphaine Robin
(1)
, Alan Barnes
(2)
, Sylvain Dulaurent
(1)
, Neil Loftus
(2)
, Sigrid Baumgarten
(3)
, Stéphane Moreau
(3)
, Pierre
Marquet
(1)
, Souleiman El Balkhi
(1)
, Franck Saint-Marcoux
(1)
(1) Department of pharmacology and toxicology, Limoges University Hospital, France
(2) Shimadzu Corporation, Manchester, UK (3) Shimadzu Europa GmbH, Duisburg, Germany
▪ Experimental
The sample is automatically delivered to a tube
containing a filter, to which reagents are added,
mixed and then filtered.
Precisely, 100 µL of acetonitrile were added to a
PTFE filter vial (0.45 µm pore size) previously
conditioned with 20 µL methanol. Then, 50 µL of
plasma (or whole blood) and 10 µL of isotopically
labelled internal standards (0.2 mg/L in acetonitrile)
were added. The mixture was stirred for 120
seconds (1900 rpm) then filtered by application of
vacuum pressure (-60 to -65 kPa) for 120 seconds
into a collection vial. Finally, 3 µL of the extract was
injected into the LC-MS-MS system.
All compounds were measured by scheduled MRM,
with up to 15 transitions per compound throughout
the entire scheduled window using
1msec pause time and 3 to 10 msec dwell time. All
transitions were collision energy optimised from
authentic standard flow injection analysis.
Chromatographic peak apex intensity were used to
extract ion intensities for construction of an MRM
Spectrum.
▪ Validation and robustness study
The laboratory of Pharmacology-toxicology of the
Limoges University Hospital works towards
accreditation by the International Standards
Organization (ISO) 15189 standard (accreditation
number: 8-2607). These requirements were applied to
the present method.
A robustness study was performed to evaluate the
acceptable quantitative accuracy that could be
provided by a calibration curve. Freshly prepared
control standards (5 and 50 ng/mL) were quantified
with freshly prepared calibration standards over a 4
weeks period. Control sample data were first
processed using calibration standards prepared on the
same day as the control samples and then re-
processed using calibration standard data which are
up to 4 weeks old.
▪ Results
Automated sample preparation was performed in 8
minutes followed by chromatographic separation of the
DOA in about 9 min (with an additional 9 min for
column wash and equilibration) with retention time
from 0.97 min for ecgonine methylester to 7.9 minutes
for methadone. About 26 minutes were needed to
obtain the first result and then, extraction and
separation were performed in parallel with the system
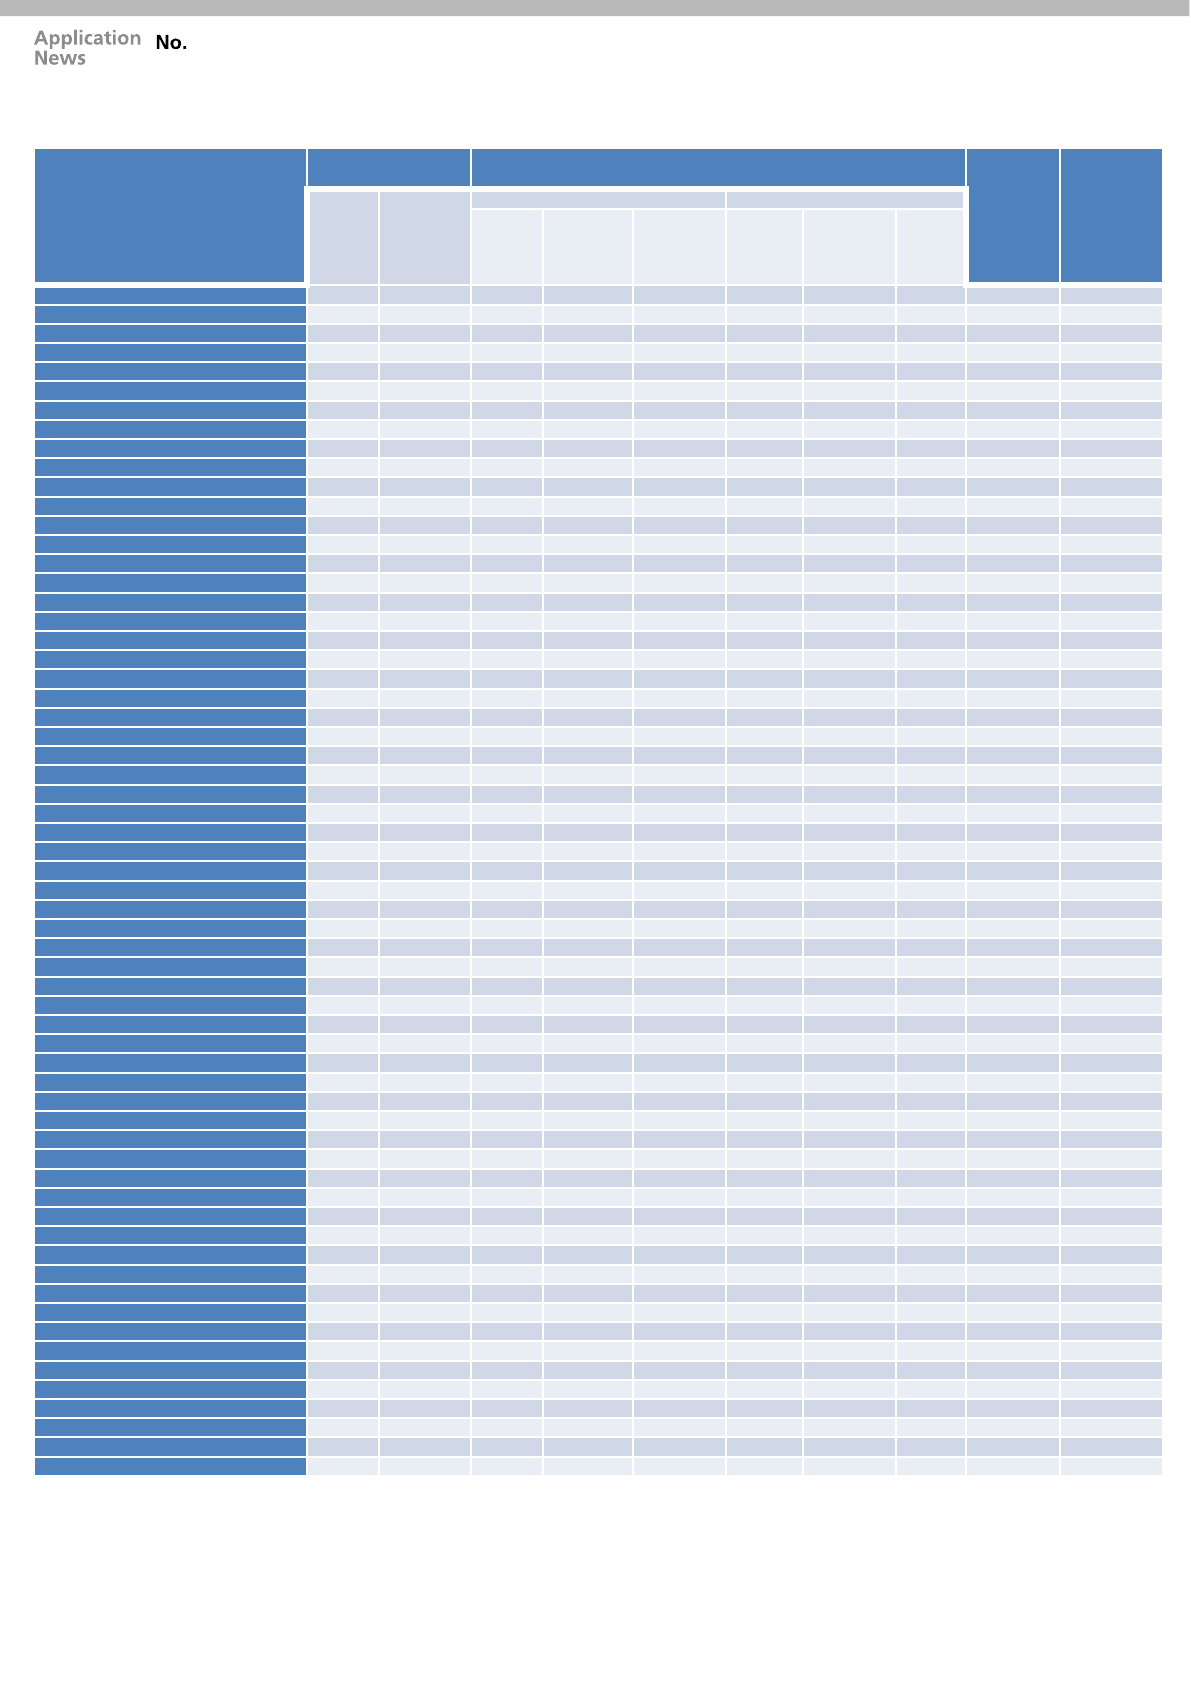
producing a result every 18 minutes. Table 3
summarizes the results of the optimization of MRM
transitions acquisition. Up to 15 MRM transitions were
obtained for a targeted compound.
The results of the validation study are summarized in
Table 4. Acceptance criteria were obtained for all
explored parameters. Concerning the intra-assay and
the inter-assay (n=6) precision and accuracy, the CV
values were less than 15% (except for benzoylecgonine,
cocaethylene, EDDP and naltrexone for which values
less than 20% were reported at the LLOQ). Using
quadratic models with a 1/x or 1/x² weighting regression,
the correlation coefficients of the calibration curves
(LLOQ to 500 ng/mL) were higher than 0.99 for all the
compounds. Depending on the molecule, the LLOD and
the LLOQwere set at 1, 2.5 or 5 ng/mL. No matrix effects
(n=6) were reported in our conditions. Dilution tests (n=3)
also reported good results.
The quantification of the control standards (5 and 50
ng/mL) with calibration curve acquired up to one month
before the injection of the controls produced accuracy
variation between 70 and 130%. The maximum CV
value was 13.0% for the control at 5 ng/mL and 14.9% at
50 ng/ml. Correct accuracy was also obtained for the
quantification of the control standard with calibration
curve acquired up to one month after the injection of the
controls. The maximum CV was 13.4% for the control at
5 ng/ml and 14.2%at 50 ng/mL.
Figure 2 illustrates the approach for 2 isobaric
compounds.
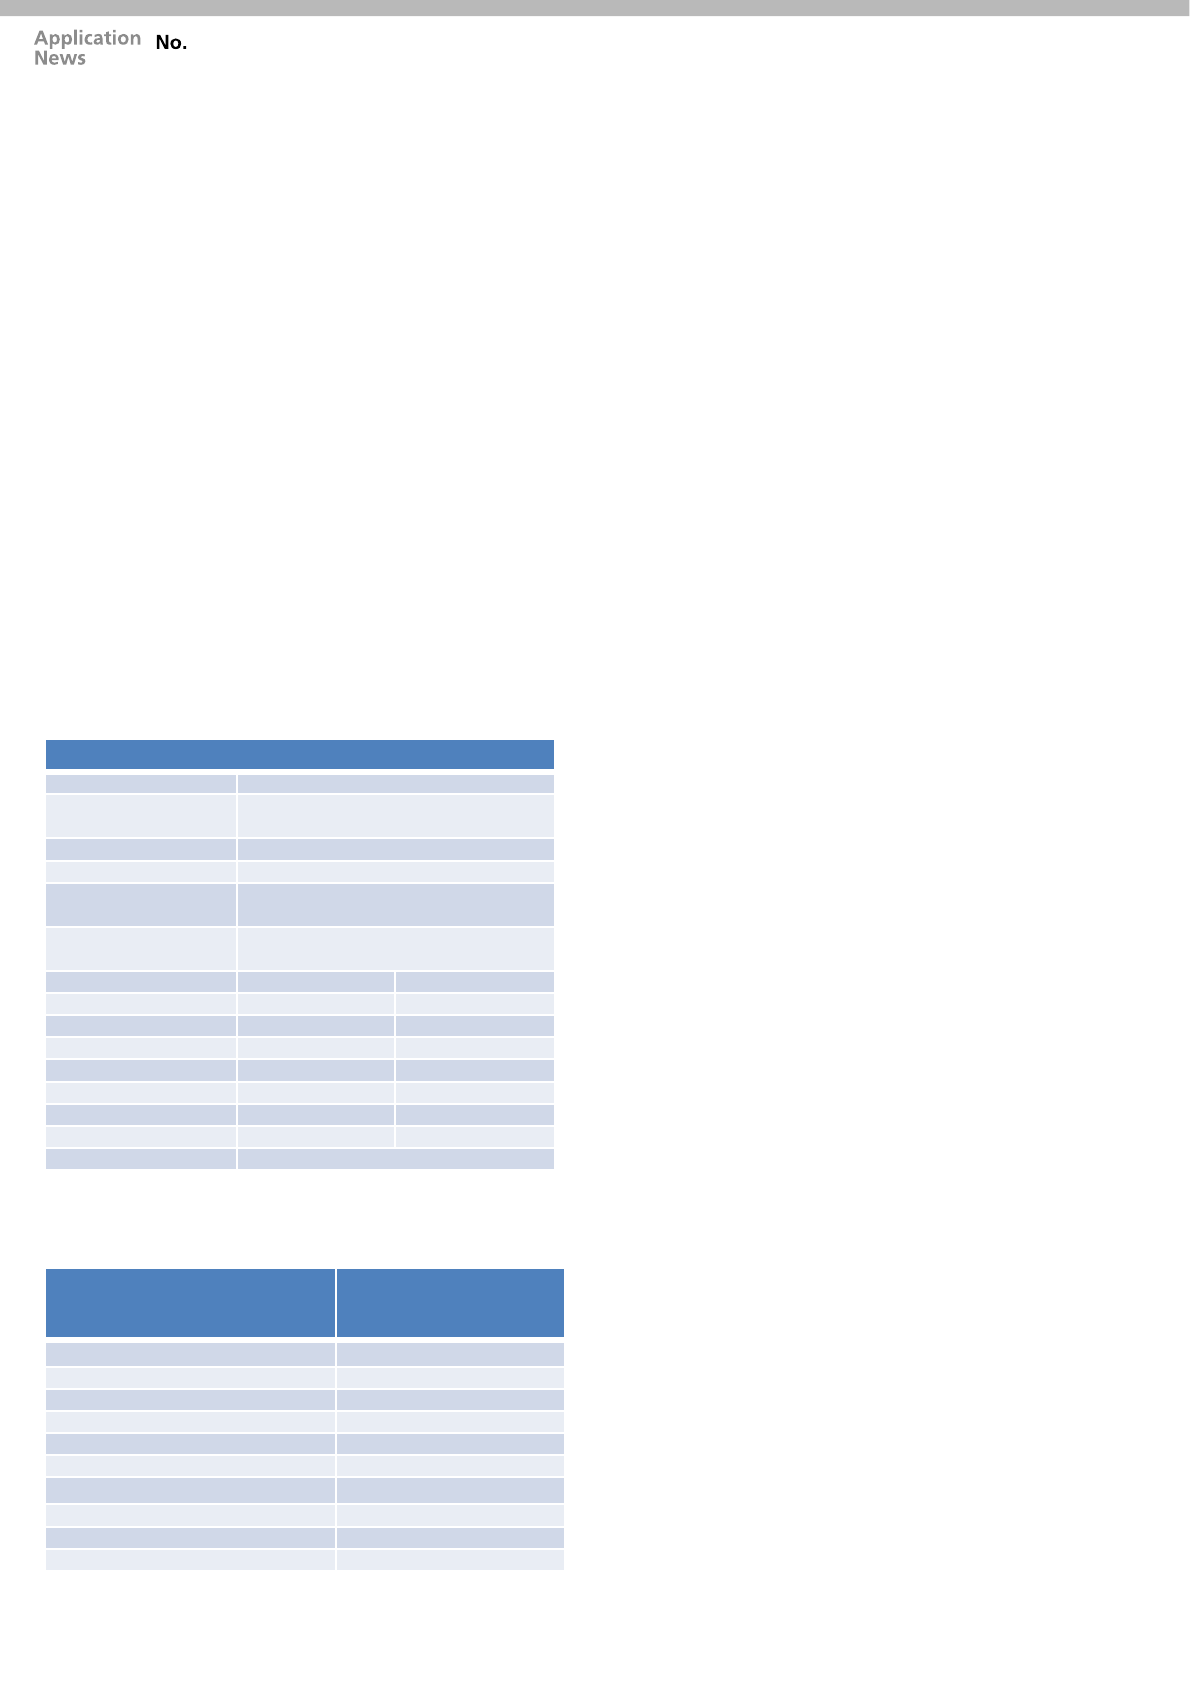
SCA_210_050
Liquid chromatography
UHPLC Nexera LC system
Analytical column Restek Raptor Biphenyl (2.7 um 100 x
2.1 mm)
Column temperature 40
o
C
Flow rate 0.3 mL/minute
Solvent A 2 mmol/L ammonium formate and
0.002% formic acid
Solvent B 2 mmol/L ammonium formate and
0.002% formic acid in methanol
Binary Gradient Time (mins) %B
1.0 10
2.0 40
10.5 100
13.5 100
13.51 10
17.0 Stop
Column conditioning 11-16.2 min 0.5 mL/min
Injection volume
3 µL
Table 1: LC acquisition parameters
Table 2: LC-MS/MS method used to acquire a library searchable
data
LC-MS/MS
Mass spectrometry
MRM Spectrum mode
generating library
searchable spectra
Target number of compounds 42 (including 20 ISTDs)
Pause time/dwell time 1 msec./3 to 10 msec.
Ionisation mode ESI +/-
Polarity switching time 5 msec
Interface temperature 300
o
C
Heat block temperature 400
o
C
Desolvation line temperature 250
o
C
Nebulising gas 3 L/min
Heating gas 10 L/min
Drying gas 10 L/min
Compounds
Precursor ion
Product ion
Retention
time
(min)
Number
total
of MRM
transitions
m/z
Q1
pre
-bias
(V)
Quantitation
Reference
m/z
Collision
energy
(V)
Q3
pre-bias
(V)
m/z
Collision
energy
(V)
Q3
pre
-
bias
(V)
2
-CI
308.00
-
11.0
290.85
-
14.0
-
13.0
275.85
-
24.0
-
29.0
5.03
15
2C
-B
260.05
-
10.0
242.90
-
12.0
-
11.0
227.85
-
22.0
-
23.0
4.58
15
3,4
-Methylenedioxypyrovalerone
276.15
-
10.0
126.10
-
14.0
-
12.0
175.00
-
12.0
-
17.0
5.18
15
4
-MTA
182.10
-
12.0
117.10
-
21.0
-
11.0
165.05
-
12.0
-
10.0
4.45
15
6
-acetylmorphine
328.35
-
12.0
164.95
-
39.0
-
16.0
211.00
-
27.0
-
21.0
3.61
15
6
-acetylmorphine-D3
331.35
-
24.0
165.15
-
43.0
-
17.0
211.10
-
27.0
-
21.0
3.61
2
Amphetamine
136.10
-
10.0
91.00
-
22.0
-
17.0
119.05
-
15.0
-
20.0
3.42
8
Amphetamine
-D5
141.10
-
15.0
93.10
-
18.0
-
17.0
124.15
-
14.0
-
13.0
3.42
2
Anhydroecgonine methyl ester
182.10
-
12.0
118.00
-
23.0
-
11.0
91.05
-
29.0
-
20.0
3.17
15
BDB
194.10
-
13.0
135.00
-
20.0
-
13.0
177.05
-
12.0
-
17.0
4.06
8
Benzoylecgonine
290.15
-
11.0
168.05
-
10.0
-
16.0
77.00
-
29.0
-
13.0
4.57
15
Benzoylecgonine
-D3
293.15
-
14.0
171.20
-
20.0
-
17.0
77.05
-
56.0
-
13.0
4.57
2
Buprenorphine
468.30
-
16.0
54.95
-
52.0
-
20.0
396.00
-
41.0
-
26.0
7.31
15
Buprenorphine
-D4
472.30
-
13.0
59.10
-
50.0
-
22.0
88.10
-
50.0
-
16.0
7.31
2
Cocaethylene
318.15
-
20.0
196.00
-
10.0
-
20.0
76.95
-
32.0
-
30.0
5.49
15
Cocaethylene
-D3
321.15
-
12.0
199.25
-
21.0
-
22.0
85.20
-
32.0
-
16.0
5.49
2
Cocaine
304.15
-
11.0
182.00
-
10.0
-
20.0
76.95
-
30.0
-
29.0
4.94
15
Cocaine
-D3
307.15
-
22.0
185.15
-
19.0
-
20.0
85.25
-
31.0
-
15.0
4.94
2
Codeine
300.15
-
11.0
215.00
-
25.0
-
22.0
151.95
-
62.0
-
28.0
3.56
15
Codeine
-D3
303.15
-
14.0
215.25
-
26.0
-
20.0
181.20
-
37.0
-
17.0
3.56
2
Dextromethorphan
272.20
-
10.0
171.00
-
20.0
-
17.0
215.05
-
12.0
-
14.0
6.43
15
Dihydrocodeine
302.20
-
11.0
198.95
-
33.0
-
19.0
127.95
-
64.0
-
23.0
3.56
15
Dihydrocodeine
-D3
305.20
-
15.0
199.15
-
35.0
-
21.0
128.30
-
55.0
-
25.0
3.56
2
Ecgonine methylester
200.15
-
12.0
182.05
-
18.0
-
18.0
82.05
-
26.0
-
13.0
0.97
15
Ecgonine methylester
-D3
203.15
-
14.0
185.25
-
18.0
-
13.0
85.20
-
26.0
-
30.0
0.97
2
EDDP
278.20
-
10.0
234.00
-
17.0
-
20.0
249.05
-
13.0
-
16.0
6.95
15
EDDP
-D3
281.20
-
19.0
234.30
-
31.0
-
16.0
249.35
-
25.0
-
17.0
6.95
2
Ephedrine
-D3
169.15
-
17.0
151.25
-
14.0
-
16.0
91.20
-
33.0
-
17.0
3.28
2
Ethylmorphine
314.20
-
12.0
152.00
-
65.0
-
14.0
165.00
-
42.0
-
16.0
4.04
15
Hydrocodone
300.15
-
11.0
198.95
-
31.0
-
20.0
127.90
-
59.0
-
22.0
3.82
15
Hydromorphone
286.15
-
10.0
185.00
-
30.0
-
19.0
157.00
-
42.0
-
15.0
3.24
15
MBDB
208.15
-
20.0
134.95
-
6.0
-
20.0
50.95
-
60.0
-
19.0
4.28
9
m
-CPP
197.10
-
12.0
118.10
-
34.0
-
11.0
154.00
-
20.0
-
15.0
4.38
15
MDA
180.10
-
12.0
105.05
-
21.0
-
22.0
163.05
-
13.0
-
16.0
3.65
15
MDA
-D5
185.10
-
13.0
110.15
-
22.0
-
11.0
168.15
-
13.0
-
18.0
3.65
2
MDEA
208.15
-
11.0
163.00
-
13.0
-
15.0
105.00
-
25.0
-
10.0
4.11
11
MDEA
-D5
213.15
-
23.0
163.15
-
14.0
-
30.0
105.20
-
28.0
-
18.0
4.11
2
MDMA
194.10
-
13.0
163.05
-
15.0
-
28.0
105.05
-
25.0
-
18.0
3.84
12
MDMA
-D5
199.10
-
21.0
165.15
-
15.0
-
18.0
107.15
-
25.0
-
11.0
3.84
2
Mephedrone
178.10
-
13.0
145.05
-
20.0
-
14.0
160.05
-
15.0
-
10.0
3.99
15
Methadone
310.20
-
18.0
310.20
-
8.0
-
21.0
76.95
-
30.0
-
13.0
7.60
14
Methadone
-D9
319.20
-
20.0
268.25
-
20.0
-
20.0
105.05
-
25.0
-
20.0
7.60
2
Methamphetamine
150.15
-
10.0
91.00
-
22.0
-
20.0
119.05
-
16.0
-
21.0
3.63
8
Methcathinone
164.10
-
30.0
131.05
-
21.0
-
23.0
146.05
-
16.0
-
30.0
3.43
13
Methiopropamine
156.10
-
11.0
97.00
-
23.0
-
10.0
58.00
-
12.0
-
23.0
3.39
15
Methylphenidate
234.15
-
20.0
84.00
-
8.0
-
20.0
91.0
-
46.0
-
17.0
4.71
7
Morphine
286.15
-
10.0
152.00
-
60.0
-
15.0
201.00
-
27.0
-
20.0
3.11
15
Morphine
-D3
289.15
-
14.0
152.10
-
59.0
-
26.0
201.15
-
26.0
-
21.0
3.11
2
Naloxone
328.15
-
12.0
310.00
-
21.0
-
21.0
212.00
-
39.0
-
22.0
3.60
14
Naloxone
-D5
333.15
-
12.0
315.20
-
20.0
-
22.0
258.10
-
29.0
-
27.0
3.60
2
Naltrexone
342.15
-
12.0
324.05
-
22.0
-
15.0
270.05
-
28.0
-
28.0
3.75
14
Naltrexone
-D3
345.15
-
16.0
327.15
-
22.0
-
23.0
270.15
-
28.0
-
29.0
3.75
2
Norbuprenorphine
414.25
-
28.0
54.90
-
63.0
-
24.0
83.05
-
50.0
-
14.0
5.50
15
Norephedrine
152.10
-
10.0
134.05
-
15.0
-
13.0
115.05
-
25.0
-
11.0
3.02
11
Norfenfluramine
204.10
-
14.0
159.00
-
20.0
-
15.0
109.05
-
40.0
-
18.0
4.16
15
Noroxycodone
302.15
-
11.0
199.00
-
37.0
-
20.0
196.95
-
26.0
-
20.0
3.56
15
Noroxycodone
-D3
305.15
-
22.0
287.15
-
17.0
-
20.0
190.10
-
25.0
-
20.0
3.56
2
Norpseudoephedrine
152.10
-
10.0
134.05
-
15.0
-
13.0
115.05
-
25.0
-
11.0
3.12
11
Oxycodone
316.15
-
12.0
298.00
-
20.0
-
20.0
240.95
-
29.0
-
24.0
3.73
14
Oxycodone
-D3
319.15
-
23.0
301.10
-
19.0
-
21
259.10
-
26.0
-
27.0
3.73
2
Pholcodine
399.25
-
14.0
114.05
-
36.0
-
11.0
381.05
-
25.0
-
18.0
3.20
5
Ritalinic acid
220.15
-
14.0
84.10
-
22.0
-
14.0
56.05
-
44.0
-
22.0
4.14
10
Table 3: MRM transitions, retention times and the total number of MRM transitions measured using MRM Spectrum mode during the acquisition for
42 compounds and their 20 internal standard compounds. Quantitative data was measured using quantifier ion and reference ion with ion ratio
percentage tolerance of 20%. Additional MRM transitions were used for Library identification.
SCA_210_050