High-speed-solder-ball-shear-and-pull-tests.pdf - 第2页
hot-air convective reflow oven. The Pb-free soldering profile had a 150 ±2 o C pre-heat, with a peak temperature of 260 o C. Thermal aging to accelerate IMC growth was conducted at 125 o C in an oven for several tim e du…
High-Speed Solder Ball Shear and Pull Tests vs. Board Level Mechanical Drop Tests:
Correlation of Failure Mode and Loading Speed
Fubin Song
1
, S. W. Ricky Lee
1
, Keith Newman
2
, Bob Sykes
3
, Stephen Clark
3
1
EPACK Lab, Center for Advanced Microsystems Packaging, Hong Kong University of Science & Technology
2
SUN Microsystems
3
DAGE Holdings Limited
Abstract
This study compares high-speed bondtesting (shear and
pull) with board level drop testing (BLDT) of BGA packages
using Sn4.0%Ag0.5%Cu solder balls and either an ENIG or
OSP package substrate surface finish. High-speed shear and
pull testing were carried out at various speeds; failure modes
were recorded, together with force and fracture energy data.
In addition, detailed microscopic analysis (SEM and EDX)
was executed on both complementary surfaces (ball and pad)
of brittle fracture failures from both shear and pull test
samples. The results of these studies showed close similarity
to those from brittle fractures generated during BLDT of the
same packages. Furthermore, there was strong correlation
between various bondtesting parameters at which brittle
fractures occurred and the number of drops to failure seen in
BLDT. In summary, it is suggested that brittle fractures
obtained in high-speed bondtesting are a strong indicator of
BLDT behavior.
1. Introduction
The reliability of lead-free solder joints under mechanical
shock loading is a major concern. Brittle fractures at the
interfaces between solder balls and package substrate bond
pads are considered unacceptable. In principle, this kind of
solder joint reliability should be characterized by board level
drop testing. However, such testing has some major
drawbacks. Firstly, each drop test will consume several
packages and hundreds of solder joints, incurring
considerable expense. Secondly, the crack in the solder joint
may close after the impact, resulting in an undetectable failure
unless there is a high-speed real time data acquisition system
available for in-situ monitoring. Thirdly, analysis of the data
is very time consuming, adding significant expense.
Therefore, there is an imperative to find alternative methods
for evaluating solder joint integrity under mechanical shock
loading [1-3].
The present study was performed to compare high-speed
solder ball shear and pull tests with BLDT. Emphasis has
been placed on the correlation of failure mode and energy
absorption between the two methods. The objective was to
investigate the feasibility of using high-speed solder ball
shear and pull tests as an alternative method of evaluating
solder joint integrity under dynamic loading [4-8]. During the
course of this study, a comprehensive testing program was
conducted, which included BGA package constructions
employing various combinations of solder alloys, surface
finishes, substrate material, solder ball size and package
dimensions.
Due to space constraints, however, this paper describes
results for a single 316 PBGA (27 mm x 27 mm)
construction, using Sn4.0%Ag0.5%Cu (SAC405) solder balls,
but fabricated with different surface finish options: electroless
nickel immersion gold (ENIG), and organic solderability
preservative (OSP).
The samples were divided into groups which were
subjected to thermal aging at 125
o
C (0 to 500 hours) in order
to accelerate the formation of intermetallic compound (IMC)
at the package substrate/solder-joint interface. The ball shear
tests ranged from 10 mm/s to 3000 mm/s and the ball pull
tests ranged from 5 mm/s to 500 mm/s. An advanced, state-of-
the-art machine, the DAGE 4000HS, was used to perform all
of the tests. This high-speed testing machine was equipped
with the most updated control and analysis software and a
new generation of force transducers, which are now able to
evaluate the fracture energy of solder balls in both ball shear
and ball pull tests.
In the current testing program, the peak shear/pull force
and energy absorption were evaluated for each test, and the
corresponding failure mode documented. The second part of
this study was BLDT. During each drop test, records of
electrical resistance, circuit board strain, and fixture
acceleration were recorded. Detailed analyses were performed
to identify the failed solder joints and corresponding failure
modes. The failure modes and loading speeds of solder ball
shear and pull tests were cross-referenced with the
mechanical drop tests for comparison. From the test results,
various correlations between failure mode and loading speed
have been observed. Also, the energy absorption value
recorded during solder ball shear and pull tests is considered
an effective index to interpret the solder joint failure mode.
Future publications will document more thoroughly the
analytical relationships observed between BLDT, high-speed
shear/pull and solder joint fracture energy. Unfortunately, the
wide scope of the study precludes full description within an
individual paper.
2. Experimental Procedures
Two types of substrate pad finishes were investigated in
this study: OSP and ENIG. The chemical composition of
lead-free solder alloy used in this work is SAC405. The
objective of the present study is to investigate the correlation
of board level drop test and solder ball shear/pull tests. The
316 PBGA samples used standard 0.76 mm (0.030 in.) dia.
spheres. The package substrates were composed of BT
laminate, with a thickness of 0.36 mm. The solder bond pads
were solder-mask-defined with an opening of 0.635 mm in
diameter. The solder balls were attached to the substrates in a
1-4244-0985-3/07/$25.00 ©2007 IEEE 1504 2007 Electronic Components and Technology Conference
hot-air convective reflow oven. The Pb-free soldering profile
had a 150 ±2
o
C pre-heat, with a peak temperature of 260
o
C.
Thermal aging to accelerate IMC growth was conducted at
125
o
C in an oven for several time durations (100, 300 and
500 hours). After thermal aging, some PBGA specimens with
solder balls were molded, cross-sectioned and etched
(2%HCl+98%methanol). They were inspected and analyzed
by scanning electron microscopy (SEM). The compositions of
IMC phases grown during reflow and thermal aging were
evaluated.
Similar BGA samples were assembled on test boards and
dropped using a dual-rail guided device. Since the packages
used in the present study were relatively large, the
specifications of the test boards (142x142 mm, 8 layer Cu,
2.35 mm thick) were different from those given in JESD22-
B111 [9]. Some board level test samples were also subjected
to thermal aging, as above. All samples were equipped with
daisy chains and subjected to real time data acquisition
monitoring.
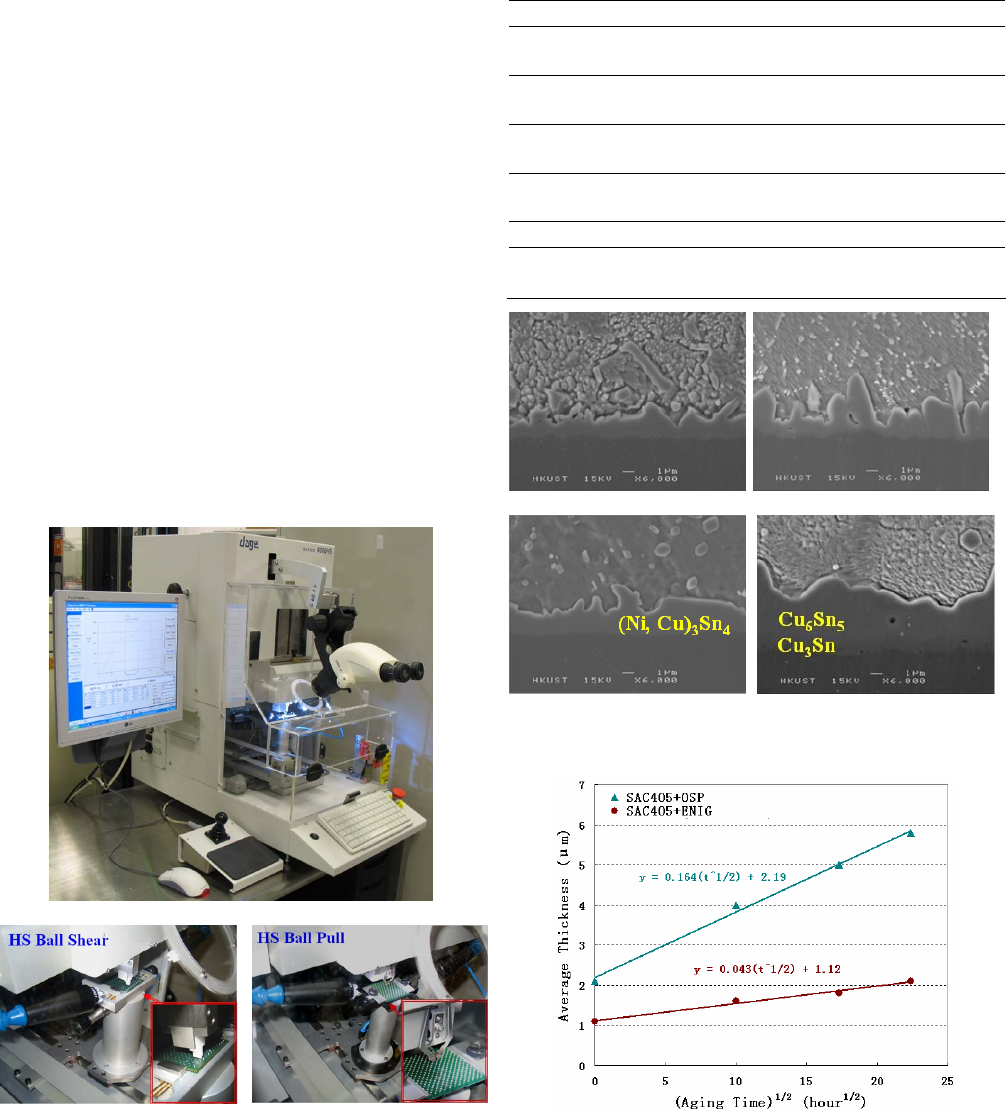
The ball shear and pull tests were performed with different
speeds on the lead-free solder balls after thermal aging using
a DAGE 4000HS bond tester (Figure 1). Each set of ball
shear or pull test data consisted of a series of 20 individual
measurements.
(a) DAGE 4000HS Bond tester
(b) Ball shear system (c) Ball pull system
Figure 1. DAGE 4000HS Bond tester system
A summary of various sample and test parameters is listed
in Table 1. High-speed video capture (2,000–20,000 frames/s)
was conducted for selected solder ball shear/pull samples.
Various kinetic effects of the test hardware and sample
fixturing were observed. Test speeds above approximately
100 mm/s proved the most uniform during solder joint
fracture.
Table 1. Description of mechanical tests for solder balls
Test Method HS Shear Test HS Pull Test
Loading
Rates
10, 100, 500, 1000
and 3000 mm/s
5, 50, 100, 250, and
500 mm/s
Shear
Height
50 µm
-
Clamping
Force
-
2.2 bar
Solder
Composition
Sn4.0%Ag0.5%Cu Sn4.0%Ag0.5%Cu
Pad Finish ENIG and OSP ENIG and OSP
Sample
Status
As-reflowed
(two times reflow)
As-reflowed
(two times reflow)
(a) ENIG, 0 hour (b) OSP, 0 hour
(c) ENIG, 500 hours (d) OSP, 500 hours
Figure 2. IMC growth and morphology changes subject to
thermal aging at 125
o
C (ENIG and OSP)
Figure 3. Correlation between IMC thickness and aging time
3. Results and Discussion
3.1 Intermetallic Growth
Representative photos of the intermetallic structures and
thickness for BGA samples (unattached to a circuit board) are
shown in Figure 2. Given the highly non-uniform topography
of the IMC layer, the average thickness was determined by
dividing the cross-sectional area of the IMC by its base
1505 2007 Electronic Components and Technology Conference
length. Figure 3 plots the measured IMC thickness against
time, yielding the expected linear fit when plotted against the
square root of the aging time. The experimental data follows
classical diffusion theory (Fick’s law), which specifies a
linear relationship between the thickness of IMC layer and the
square root of time. Figure 3 also shows that the IMC growth
rates in solders on OSP surface finish are higher than those on
ENIG. This demonstrates that the Ni layer in ENIG serves as
a good barrier to inhibit growth of Cu-Sn IMC [8].
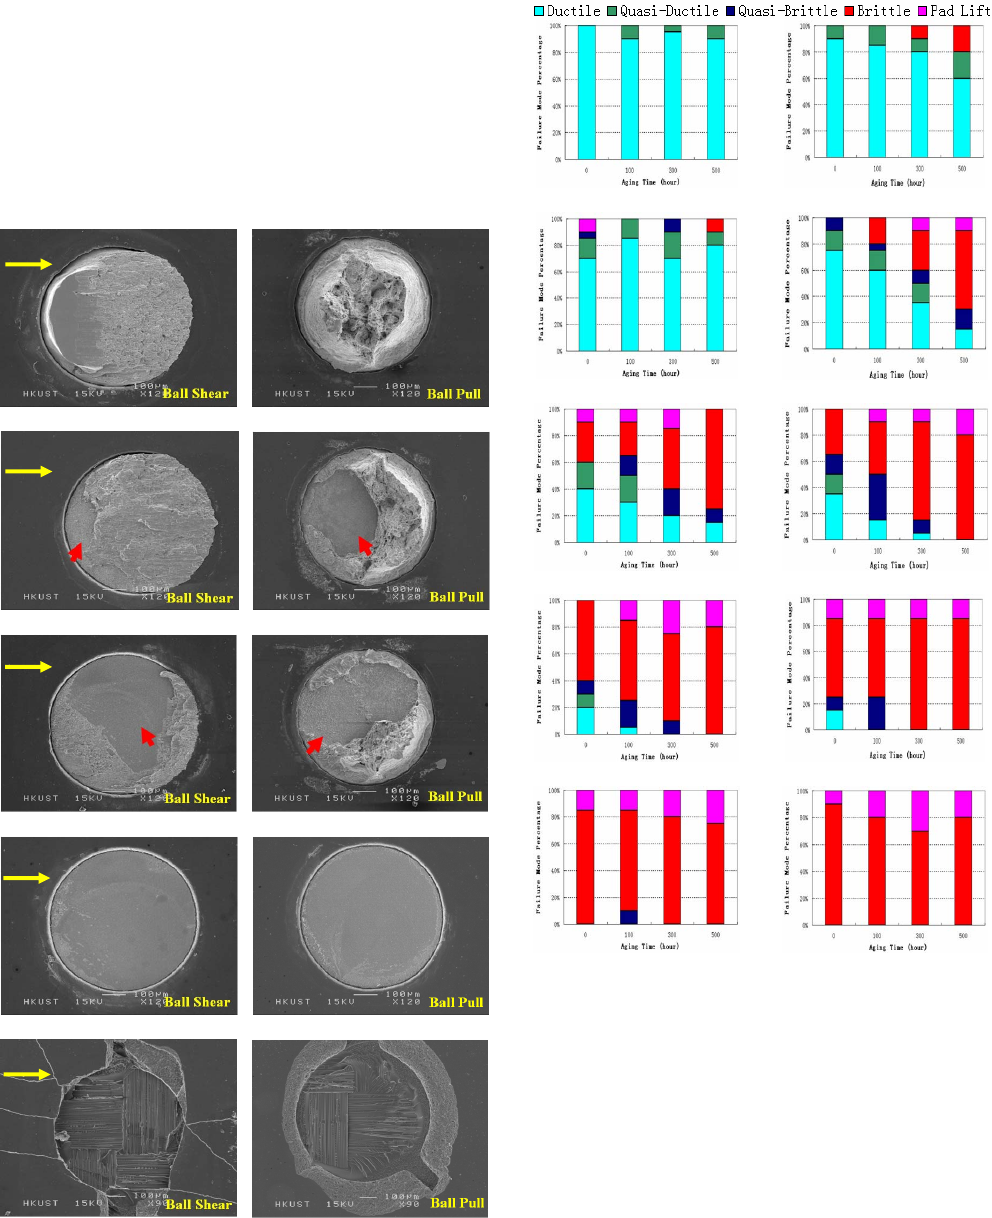
(a) Ductile mode (100% area with solder left)
(b) Quasi-ductile mode (<50% area with exposed pad)
(c) Quasi-brittle mode (>50% area without solder)
(d) Brittle mode (almost no solder left)
(e) Pad lift with brittle
Figure 4. High-speed ball shear and pull failure modes
(a) 10 mm/s (ENIG) (b) 10 mm/s (OSP)
(c) 100 mm/s (ENIG) (d) 100 mm/s (OSP)
(e) 500 mm/s (ENIG) (f) 500 mm/s (OSP)
(g) 1000 mm/s (ENIG) (h) 1000 mm/s (OSP)
(i) 3000 mm/s (ENIG) (j) 3000 mm/s (OSP)
Figure 5. Failure mode distribution in ball shear of
specimens with ENIG and OSP pad finishes
3.2 Solder Ball Shear/Pull Failure Modes
In this investigation, the solder ball shear and pull test
samples were evaluated both quantitatively (force and fracture
energy) and qualitatively (failure mode). In order to enhance
discrimination of the qualitative failure mode assessments,
mixed ductile/brittle modes were divided into two
classifications: quasi-ductile (<50% of the surface pad
remains exposed) and quasi-brittle (>50% of the surface pad
remains exposed). Representative photographs of the 5 failure
modes (ductile, quasi-ductile, quasi-brittle, brittle and pad lift)
are shown in Figure 4.
Shear Direction
Shear Direction
Shear Direction
Shear Direction
Shear Direction
1506 2007 Electronic Components and Technology Conference