6_PO-CON1602E.pdf - 第4页
4 High throughput analysis for novel oral anticoagulants using LC-MS/MS system Integrated with automated sample preparation Result and discussion Each of the compounds were calibrated within the range from 5ng/mL to 500n…
3
High throughput analysis for novel oral anticoagulants using
LC-MS/MS system Integrated with automated sample preparation
System
Column : Mastro C18 2.1*100mm, 3μm
Column Temp. : 50 ºC
Mobile Phase A : 0.1% Formic Acid - Water
Mobile Phase B : 0.1% Formic Acid - Methanol
Time Program : 5%B(0-4 min) – 100%B(4-5min) – 5%B(5min)
Flow Rate : 0.4mL/min
Injection Volume : 2μL
Ionization : ESI Positive
[LC] NexeraX2
[MS] LCMS-8040
Table 1 LC-MS/MS condition
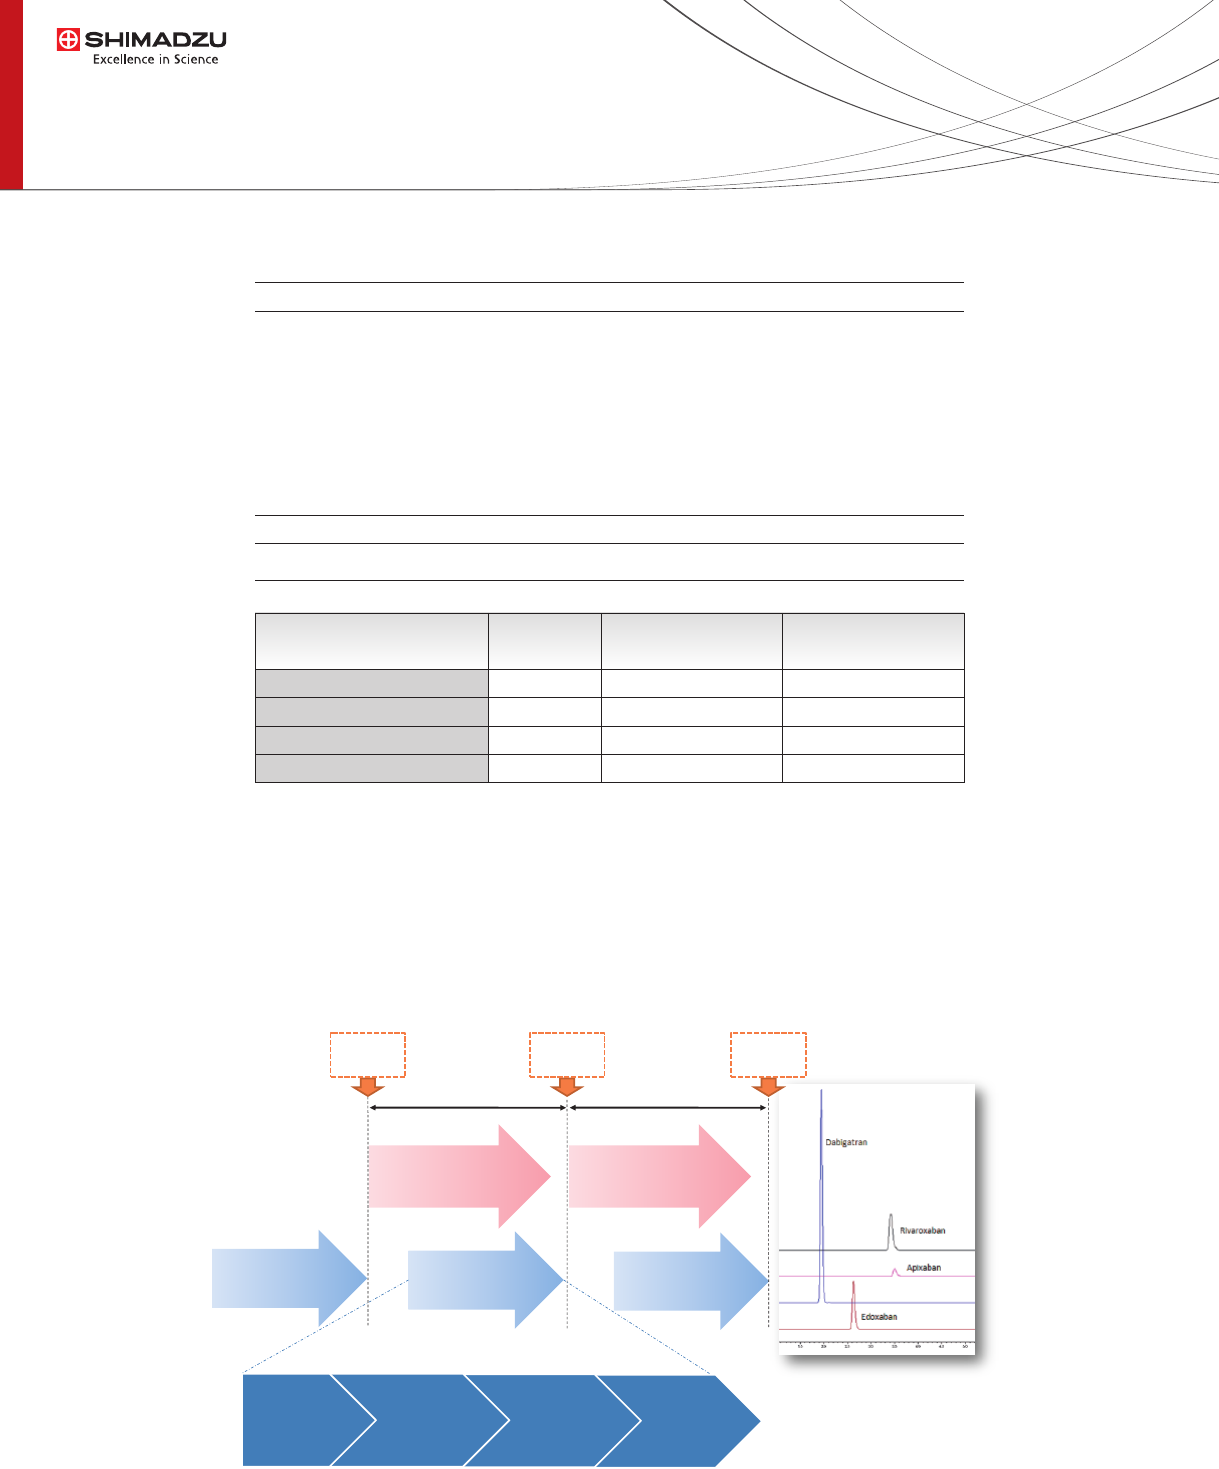
Plasma spiked with four NOACs (Apixaban, Rivaroxaban,
Edoxaban, Dabigatran) were used for calibration. Six
calibration standards, QC samples and human plasma
samples were prepared. These were precipitated in the
CLAM-2000 using acetonitrile and vacuum ltration. In
contrast, manual sample preparation used a
centrifugation step following precipitation to remove the
protein content. The ltrated sample was injected into
LC-MS/MS.
Sample preparation
Fig.2 Automated analysis from sample preparation to LC-MS/MS
460.20
436.10
548.20
472.00
+
+
+
+
Precursor (m/z)
443.10
145.00
152.20
289.05
Product (m/z)Polarity
Apixaban
Rivaroxaban
Edoxaban
Dabigatran
Compounds
MRM MS analysis
10min
Sample
Preparation
6min
Sample
Preparation
6min
MRM MS analysis
10min
Sample
Preparation
6min
12min 12min
Sample
injection
Filtration
• Time 120sec
Shaking
• Time 150sec
Reagent
Dispensing
• Acetonitrile
Sample
Dispensing
• Human plasma
Sample
injection
Sample
injection
4
High throughput analysis for novel oral anticoagulants using
LC-MS/MS system Integrated with automated sample preparation
Result and discussion
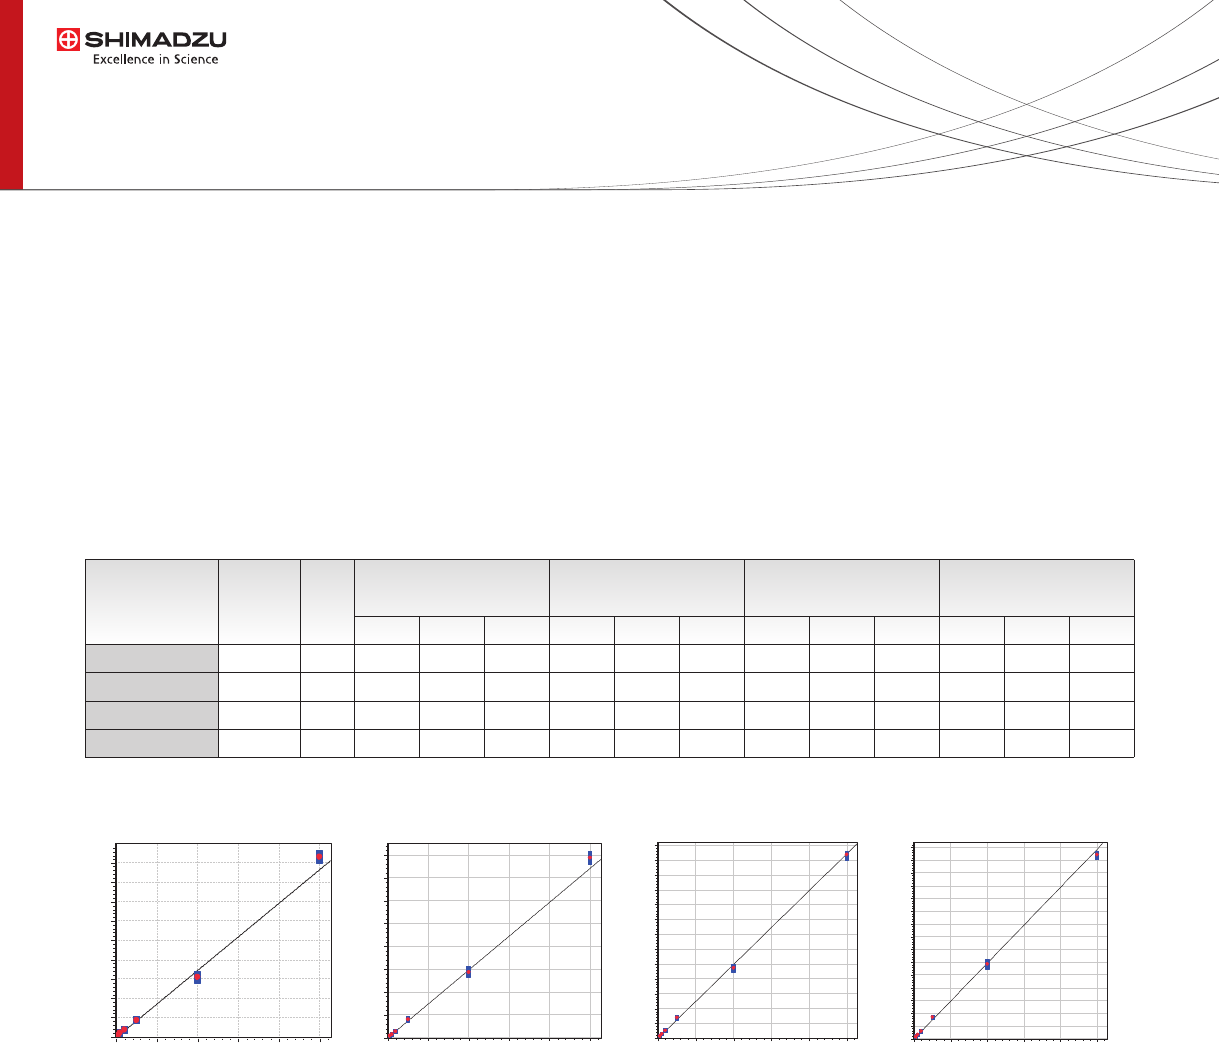
Each of the compounds were calibrated within the range
from 5ng/mL to 500ng/mL by the six calibration points
(5, 10, 20, 50, 200, 500ng/mL). Table 2 illustrates
linearity, accuracy and reproducibility of all compounds.
The calibration curves showed good linearity (R
2
>0.992).
The reproducibility (N=6) at six concentrations, including
LLOQ, of each compounds was excellent (CV<10%).
Different day reproducibility (N=6) for 5 days at three
concentrations (5, 50, 500ng/mL) as well (CV<15%).
Linearity, accuracy and reproducibility
Fig.3 Calibration curves for each compound
Table.2 Analytical performance
50
50
50
50
5
5
5
5
500
500
500
500
0.992
0.993
0.996
0.994
Concentrations of QC
samples (ng/mL)
LLOQ ULOQMiddle
4.95
5.84
2.92
2.19
9.16
4.65
2.52
0.85
1.53
2.21
1.26
1.05
% RSD (n=6)
LLOQ ULOQMiddle
10.44
7.20
5.49
5.54
13.74
12.30
8.64
7.28
14.23
6.20
5.61
6.22
% RSD (n=6)
LLOQ ULOQMiddle
r
2
Apixaban
Rivaroxaban
Edoxaban
Dabigatran
Compound
5 - 500
5 - 500
5 - 500
5 - 500
Range
(ng/mL)
99.1
107.8
109.1
111.4
95.7
104.8
100.0
101.7
107.1
106.0
99.2
96.9
Accuracy (%)
LLOQ ULOQMiddle
0 100 200 300 400
0
10000
20000
30000
40000
50000
60000
70000
80000
90000
2
3
4
5
6
7
0 100 200 300 400
0
25000
50000
75000
100000
125000
150000
175000
200000
2
3
4
5
6
7
Apixaban Rivaroxaban
0 100 200 300 400
0
50000
100000
150000
200000
250000
300000
350000
400000
450000
500000
550000
600000
650000
700000
750000
2
3
4
5
6
7
0 100 200 300 400
0
50000
100000
150000
200000
250000
300000
350000
400000
450000
500000
550000
600000
650000
2
3
4
5
6
7
Dabigatran
Edoxaban
Area
Concentration
Area
Concentration Concentration
Area
Area
Concentration
5
High throughput analysis for novel oral anticoagulants using
LC-MS/MS system Integrated with automated sample preparation
Apixaban
Table 4 The difference of the automated operation against the manual operation
93.7
140.5
196.6
306.5
234.1
207.7
106.4
Manual
(ng/mL)
109.4
145.3
201.4
353.7
261.3
183.8
123.9
CLAM
(ng/mL)
Difference
(%)
14.4
3.3
2.4
13.3
10.4
-13.0
14.1
1
2
3
4
5
6
7
ID
Edoxaban
186.7
337.9
35.5
108.9
26.5
Manual
(ng/mL)
169.6
319.1
38.6
102.0
29.8
CLAM
(ng/mL)
Difference
(%)
-10.1
-5.9
8.0
-6.9
11.2
1
2
3
4
5
ID
Dabigatran
20.6
51.5
19.8
136.4
Manual
(ng/mL)
21.8
56.9
22.4
159.5
CLAM
(ng/mL)
Difference
(%)
5.6
9.6
11.4
14.5
1
2
3
4
ID
Rivaroxaban
21.1
21.9
117.8
32.7
154.8
Manual
(ng/mL)
20.5
19.7
114.1
32.5
161.6
CLAM
(ng/mL)
Difference
(%)
-2.7
-10.1
-3.2
-0.5
4.5
1
2
3
4
5
ID
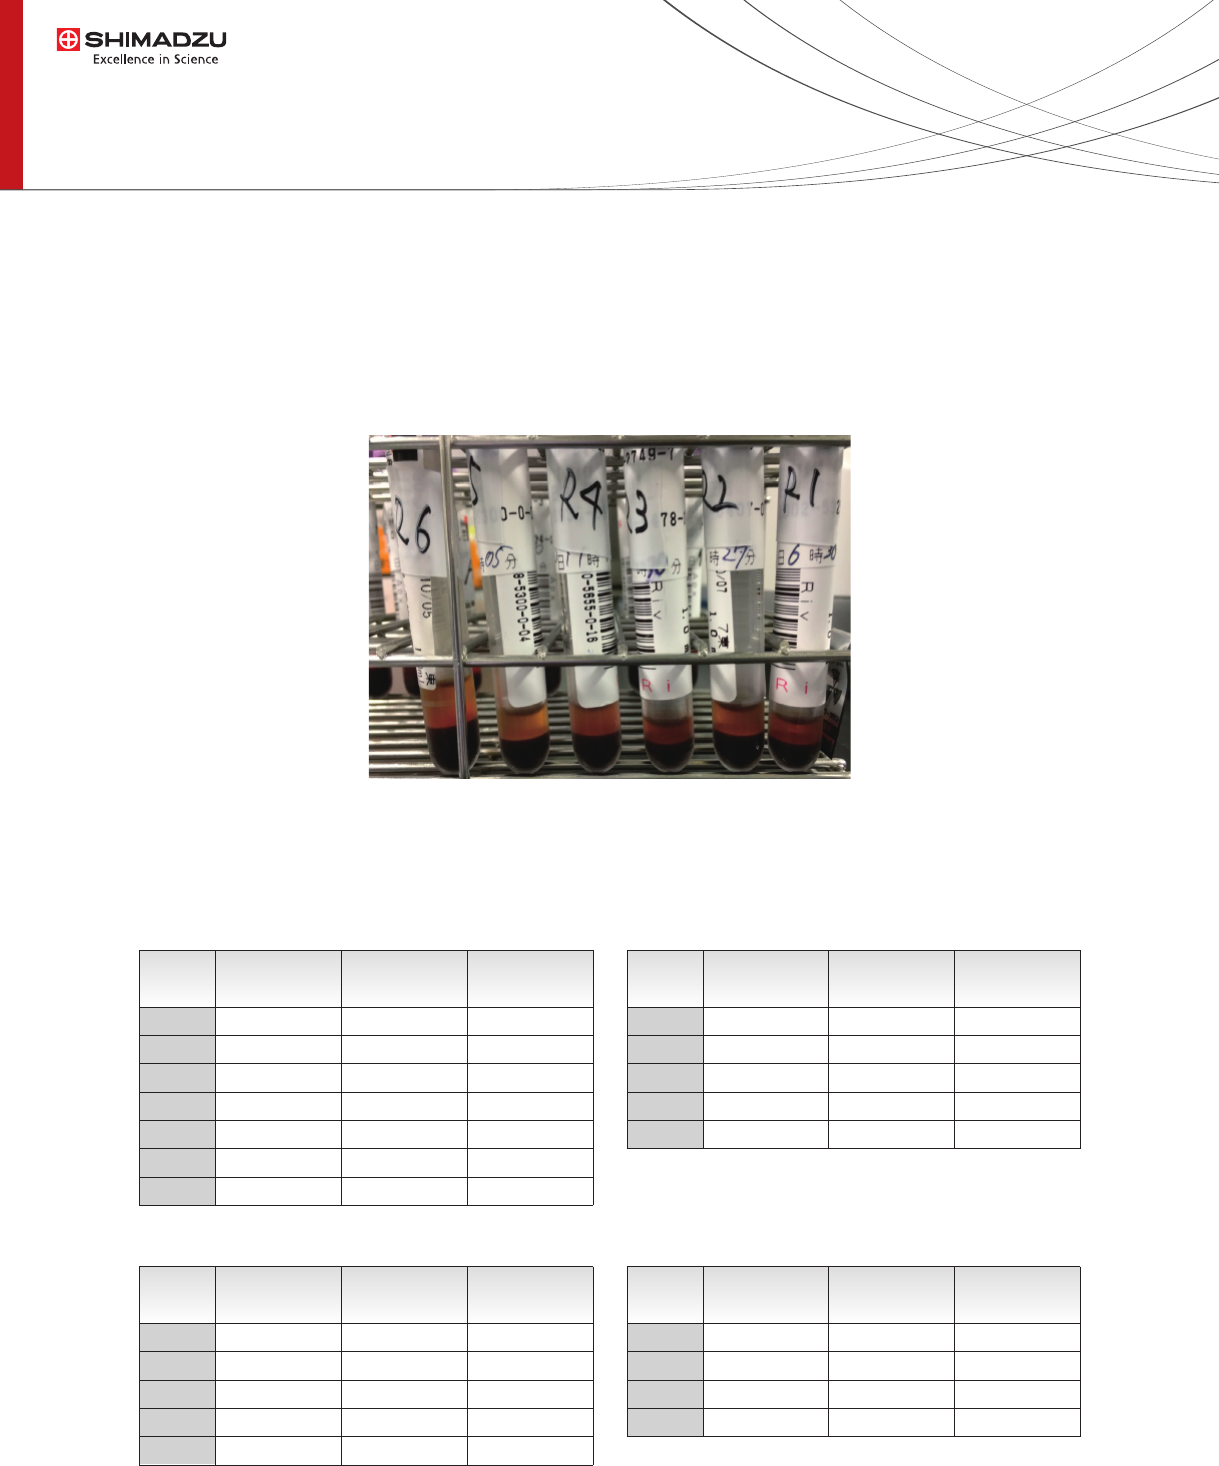
Comparison of concentration between manual sample preparation and automated sample preparation using plasma
from patients who are treated with NOACs shows good agreement. The difference of the automated operation against
the manual operation was between -15% and 15%
Comparison of concentration between manual sample preparation and
automated sample preparation
Fig.4 Plasma sample from subjects