10_Application_News_No_LC_26_ADI_049.pdf - 第4页
© Shimadzu Corporation, 2015 ■ Reference : 1. "Vitamin A" . M icro nutrient Info rmation Center, Linus Pauling Institute, Oregon State University, Corvallis . January 2015 . Retrieved 6 July 2017 . 2. Fennema O…
LC-26-ADI-049
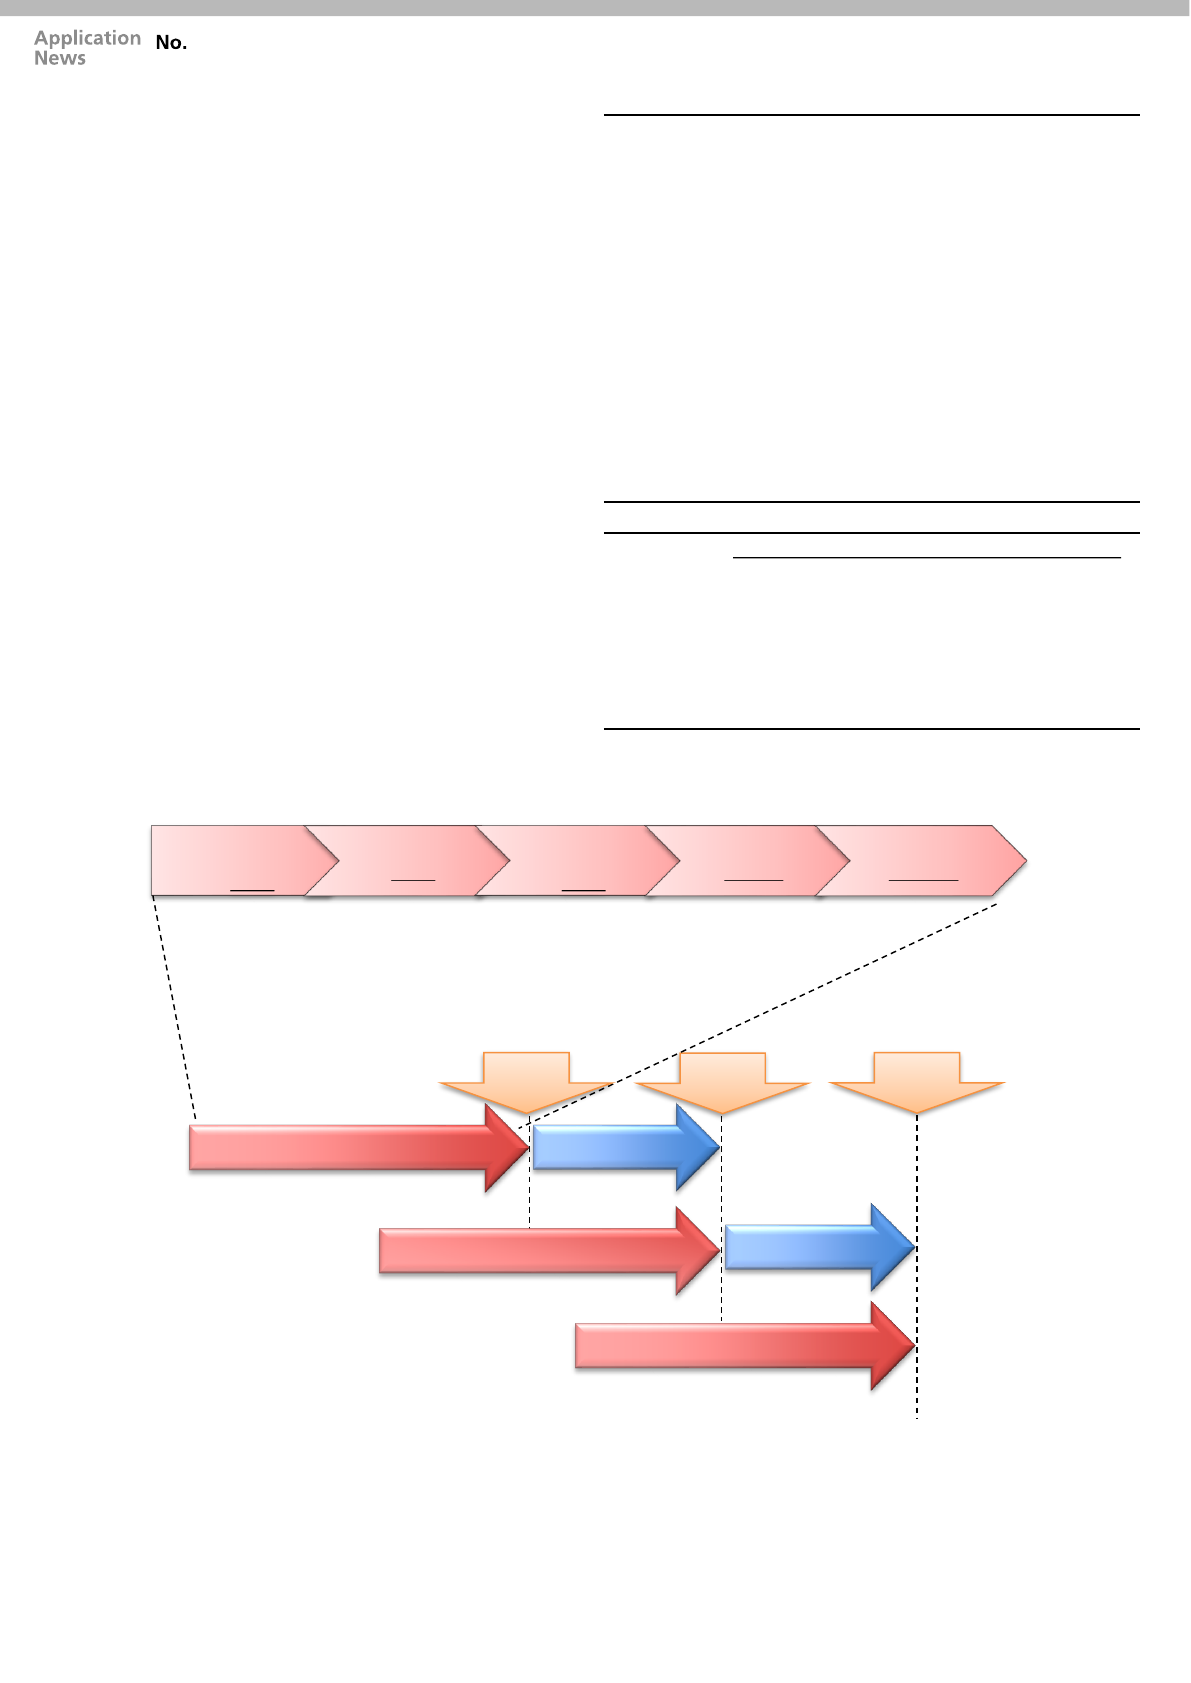
Fig. 2 Analytical Flow with Parallel Processing
■ Method
Vitamin A was analyzed using home brew method. Serum
sample was loaded directly into the automated sample
preparation system CLAM-2000.
The CLAM-2000 was programmed to perform protein
precipitation using acetonitrile followed by precipitation and
sample collection. Sample preparation involved taking 15 uL of
sample, adding to it 90 uL of precipitant solution. Following
filtration, the filtrated sample is then transported using an arm
from the CLAM-2000 to autosampler of LC-MS/MS for analysis
without any human intervention. In Fig. 2 the analytical
workflow which works parallel to sample analysis and sample
preparation is represented.
The LC-MS/MS instrument was equipped with an atmospheric
pressure chemical ionization source (APCI).
The sample was analyzed on column at 40°C with isocratic
mode with flow rate of 300 µL/min.
■ Analytical Conditions
The auto optimization feature of Lab Solution software was
used to optimize MS/MS conditions using Vitamin A standard.
The autosampler was used for injecting the standard.
LC-MS/MS conditions are described in Tables 1 & 2.
Two MRM transitions were recorded and summed for signal
integration.
The CLAM-2000 was programmed to perform sample
extraction by protein precipitation followed by filtration and
sample collection.
System
Column
Column Temperature
Mobile Phases
Flow Rate
Total Run Time
Injection Volume
System
Ionization
Probe Voltage
Temperature
Gas Flow
: Nexera X2 (high pressure binary gradient)
: Information available on request
: 40°C
: 0.1% Formic Acid in Methanol
: 300 µL/min
: 1.5 min
: 50 µL
: LCMS-8040
: APCI
: 4.5 kV (positive ionization)
: Interface: 350°C
Desolvation Line: 280°C
Heater Block: 300°C
: Nebulizing Gas: 3 L/min
Drying Gas: 15 L/min
Table 1 Analytical Conditions
MRM
Transitions
Name MRM CE Dwell Time (msec)
Vitamin A 269.15 > 93.00 -12 80
269.15 > 81.00 -21 80
Dwell Time
CID Gas
Pressure
: 63 msec
: 230 kPa
Quadrupole
Resolution : Q1: Unit Q3: Unit
Table 2 MS/MS Acquisition Parameters
Reagent
Dispensing
10 uL
Sample
15 uL
Reagent
Dispensing
90 uL
Shaking
50 secs
Filtration
150 secs
Sample Preparation 5.5 mins
LC-MS/MS
Analysis 1.5 mins
Sample Preparation 5.5 mins
Sample Preparation 5.5 mins
Sample
Injection
LC-MS/MS
Analysis 1.5 mins
Sample
Injection
Sample
Injection
LC-26-ADI-049
Table 6 Estrone QC Results
y = 1.0052x - 10.904
R² = 0.9316
0
500
1000
1500
2000
2500
0 500 1000 1500 2000 2500
CLAM
-2000 prp. Vitamin A Conc. (ng/mL)
Manual prep. Vitamin A Conc. (ng/mL)
Vitamin A sample preparation manually v/s CLAM-2000
Vit A Lower Range Upper Range Median Linear (Vit A)
0.00 0.25 0.50 0.75 1.00 1.25 min
0.0
1.0
2.0
3.0
(x100,000)
1:Vitamin A TIC(+) 20180511_S_00000317_Vit A(0000)_01.lcd
1:Vitamin A TIC(+) 20180511_S_00000318_Vit A(0000)_02.lcd
1:Vitamin A TIC(+) 20180511_S_00000319_Vit A(0000)_03.lcd
1:Vitamin A TIC(+) 20180511_S_00000320_Vit A(0000)_04.lcd
1:Vitamin A TIC(+) 20180511_S_00000317_Vit A(0000)_01.lcd
1:Vitamin A TIC(+) 20180511_S_00000318_Vit A(0000)_02.lcd
1:Vitamin A TIC(+) 20180511_S_00000319_Vit A(0000)_03.lcd
1:Vitamin A TIC(+) 20180511_S_00000320_Vit A(0000)_04.lcd
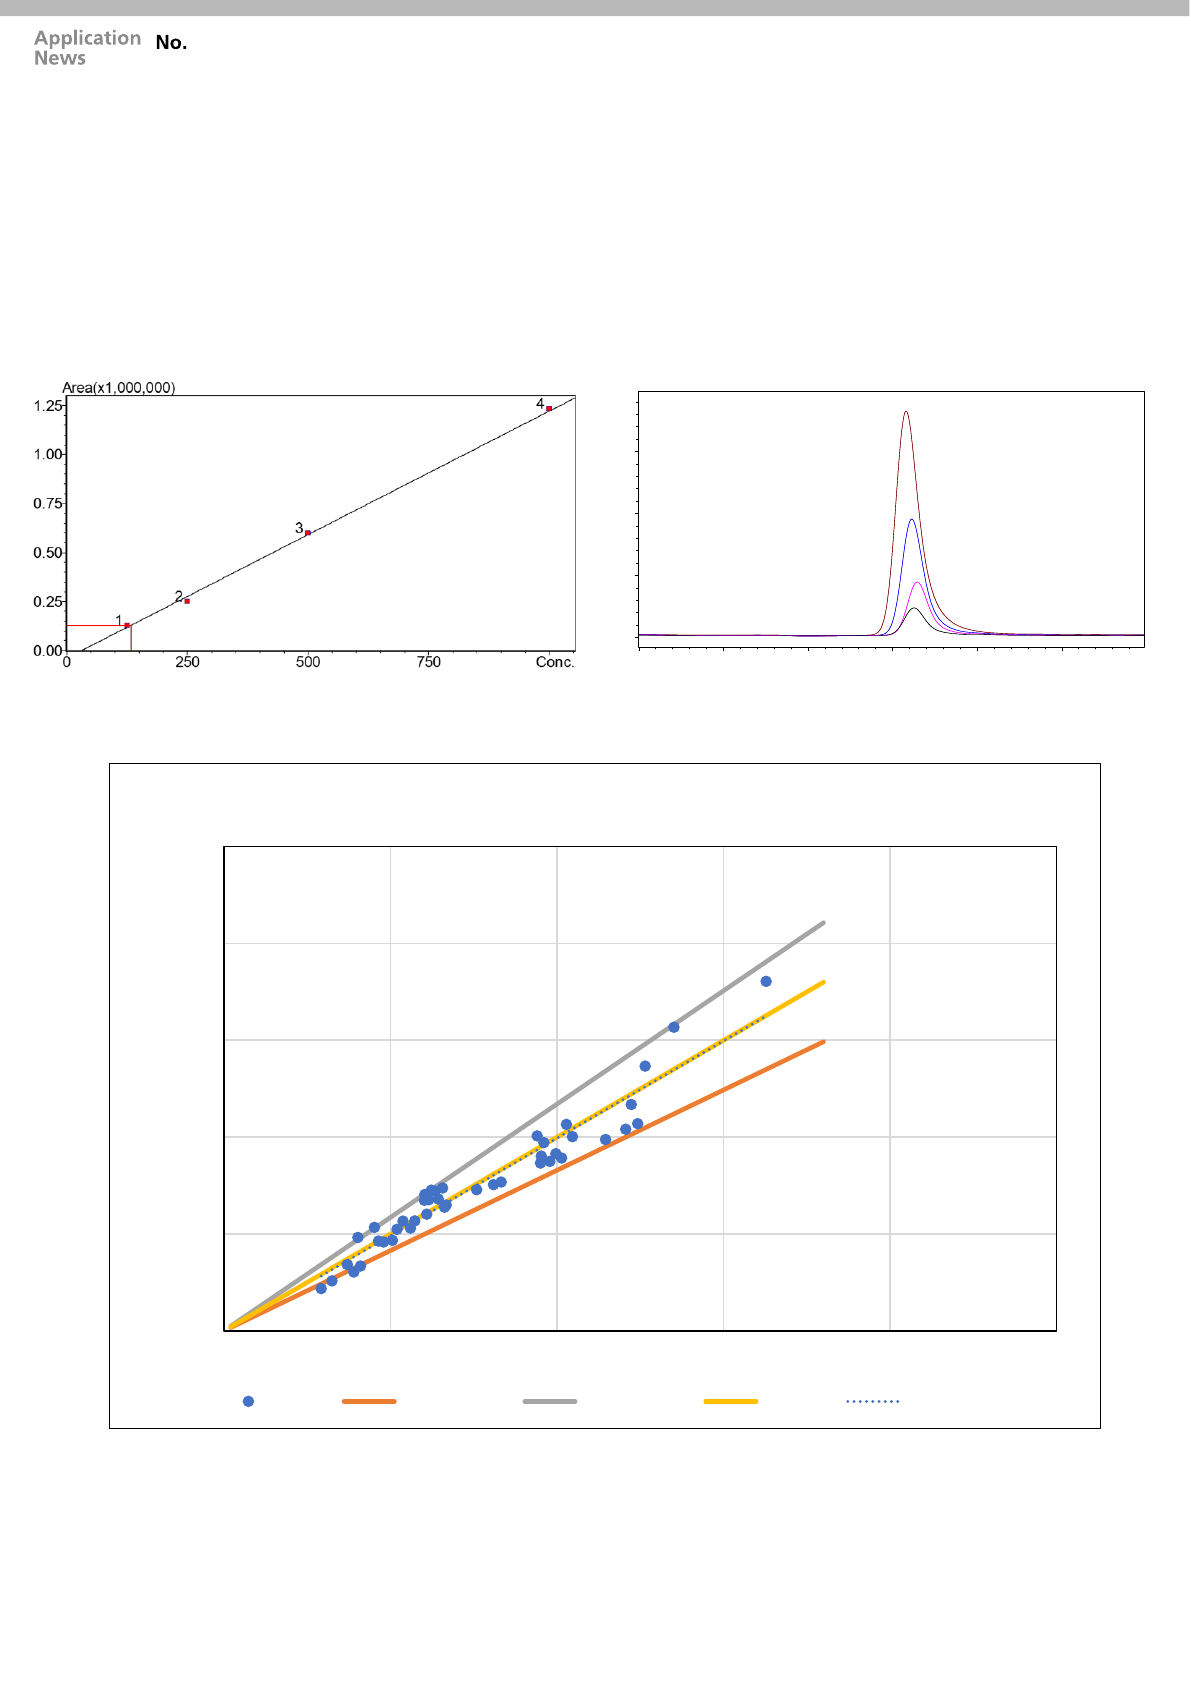
■ Calibration Curve
The Vitamin A standards, were serially diluted over a desired
clinical range of 125 - 1000 ng/mL and were placed on CLAM-
2000 for sample preparation, the way we carried out for samples.
The calibration curves showed good linearity (r
2
>0.996) over a
desired clinical range of 125 - 1000 ng/mL for Vitamin A (Fig. 3)
and calibration levels TIC’s are shown in (Fig. 4).
■ Data correlation with Manual method
Analytical data obtained using manual and automated sample
preparation methods for 43 human serum samples of Vitamin A
with known concentrations were studied and compared. In fig. 5,
orange line, grey line and yellow line represents the lower range,
upper range and median respectively. Percentage of Total error
(%TE) was used to define the upper and lower range of the
analyte. %TE refers to the amount of error that is allowable
without invalidating the interpretation of a test result.
As per Westgard guideline %TE of Vitamin A is ±17.1%. The
blue colored are the data points of Vitamin A obtained by CLAM-
2000.The r
2
(regression) obtained is 0.93 and r (correlation co-
efficient) is 0.96. Maximum data points of Vitamin A are within
the %TE.
Fig. 5 Data Correlation Plot between Automated Sample Preparation (CLAM – 2000)
and Manual Method (n=43 Human Serum Sample)
Fig. 3 Calibration Curve of Vitamin A (L1 –L4)
Fig. 4 TIC (Total Ion Chromatogram) of Calibrator

© Shimadzu Corporation, 2015
■ Reference:
1. "Vitamin A". Micronutrient Information Center, Linus
Pauling Institute, Oregon State University, Corvallis.
January 2015. Retrieved 6 July 2017.
2. Fennema O (2008). Fennema's Food Chemistry. CRC
Press Taylor & Francis. pp. 454–455. ISBN
9780849392726.
3. "Vitamin A". MedlinePlus, National Library of Medicine, US
National Institutes of Health. 2 December 2016.
4. Tanumihardjo SA (August 2011). "Vitamin A: biomarkers
of nutrition for development"The American Journal of
Clinical Nutrition. 94 (2): 658S–65S.
doi:10.3945/ajcn.110.005777
5. Wolf G (June 2001). "The discovery of the visual function
of vitamin A"The Journal of Nutrition. 131 (6): 1647–50.
6. Office of Dietary Supplements, US National Institutes of
Health. 31 August 2016.
7. News Medical. "What is Vitamin A?“ Retrieved 1 May 2012.
Copyright © 2011 SHIMADZU Analytical (India) Pvt. Ltd
All rights reserved. No part of this document may be reproduced in any form or by any
means without permission in writing from SHIMADZU Analytical (India) Pvt. Ltd, Mumbai
First Edition: August 2018
LC-26-ADI-049
■ Conclusion
Fully automated sample preparation procedure resulted in
developing suitable method for the quantitation of Vitamin A by
elimination of all manual preparation steps.
Shimadzu’s cutting edge technology in automation has proved
to be successful for quantitation of Vitamin A in Human serum
samples.
Needless to say, ease of operation, rugged technology,
reduction in reagent quantities, cost of analysis, unambiguous
outcome and overall performance, will definitely appeal to
industries and CLAM-2000 will replace conventional sample
preparation methods in diagnostic laboratories in near future.
SHIMADZU Analytical (India) Pvt.Ltd.
1 A/B, Rushabh Chambers, Makwana Road,
Marol, Andheri (East), Mumbai- 400059, India.
Tel: +91 22 29204741 Fax: +91 22 29205679
Website: www.shimadzu.in