13_Application_News_No_SCA_210_050.pdf - 第6页
• Application of the whole procedure to real patient The whole automated sample prepara tion and LC - MS/M S analysis was tested by comparing quantitativ e results from 43 pati ents samples (plasma or whole blood) prepar…
3.6 3.7 3.8 3.9 4.0
0.0e0
5.0e5
1.0e6
1.5e6
2.0e6
Codeine
RT : 3.756
Compound
Codeine
Formula C18H21NO3
CAS 76-57-3
[M+H]+ 300.15
Q: 300.1 > 152.1
R: 300.1 > 215.1
3.8 3.9 4.0 4.1 4.2
0.0e0
1.0e6
2.0e6
3.0e6
4.0e6
Hydrocodone
RT : 4.018
Compound
Hydrocodone
Formula C18H21NO3
CAS 125-29-1
[M+H]+ 300.15
Q: 300.1 > 199.1
R: 300.1 > 128.1
115.00
127.95
141.00
151.95
165.00
183.00
199.00
215.00
224.95
m/z
125 150 175 200 225
2.0e6
4.0e6
6.0e6
8.0e6
1.0e7
115.00
127.95
141.00
151.95
165.00
183.00
199.00
215.00
224.95
243.00
0.0e0
2.0e5
4.0e5
6.0e5
8.0e5
Acquired MRM spectrum
RT: [3.692 – 3.815] (+)
Codeine MRM spectrum Library Spectrum RT: [3.701] (+) SI: 98
127.90
141.00
151.95
154.95
171.00
182.95
198.95
213.00
241.00
m/z
125 150 175 200 225
2.0e6
4.0e6
6.0e6
8.0e6
1.0e7
127.90
141.00 151.95
152.95
171.00
185.00
198.95
213.00
241.00
0.0e0
5.0e5
1.0e6
1.5e6
2.0e6
2.5e6
3.0e6
Acquired MRM spectrum
RT: [3.963 – 4.069] (+)
Hydrocodone MRM spectrum Library Spectrum RT: [4.001] (+) SI: 94
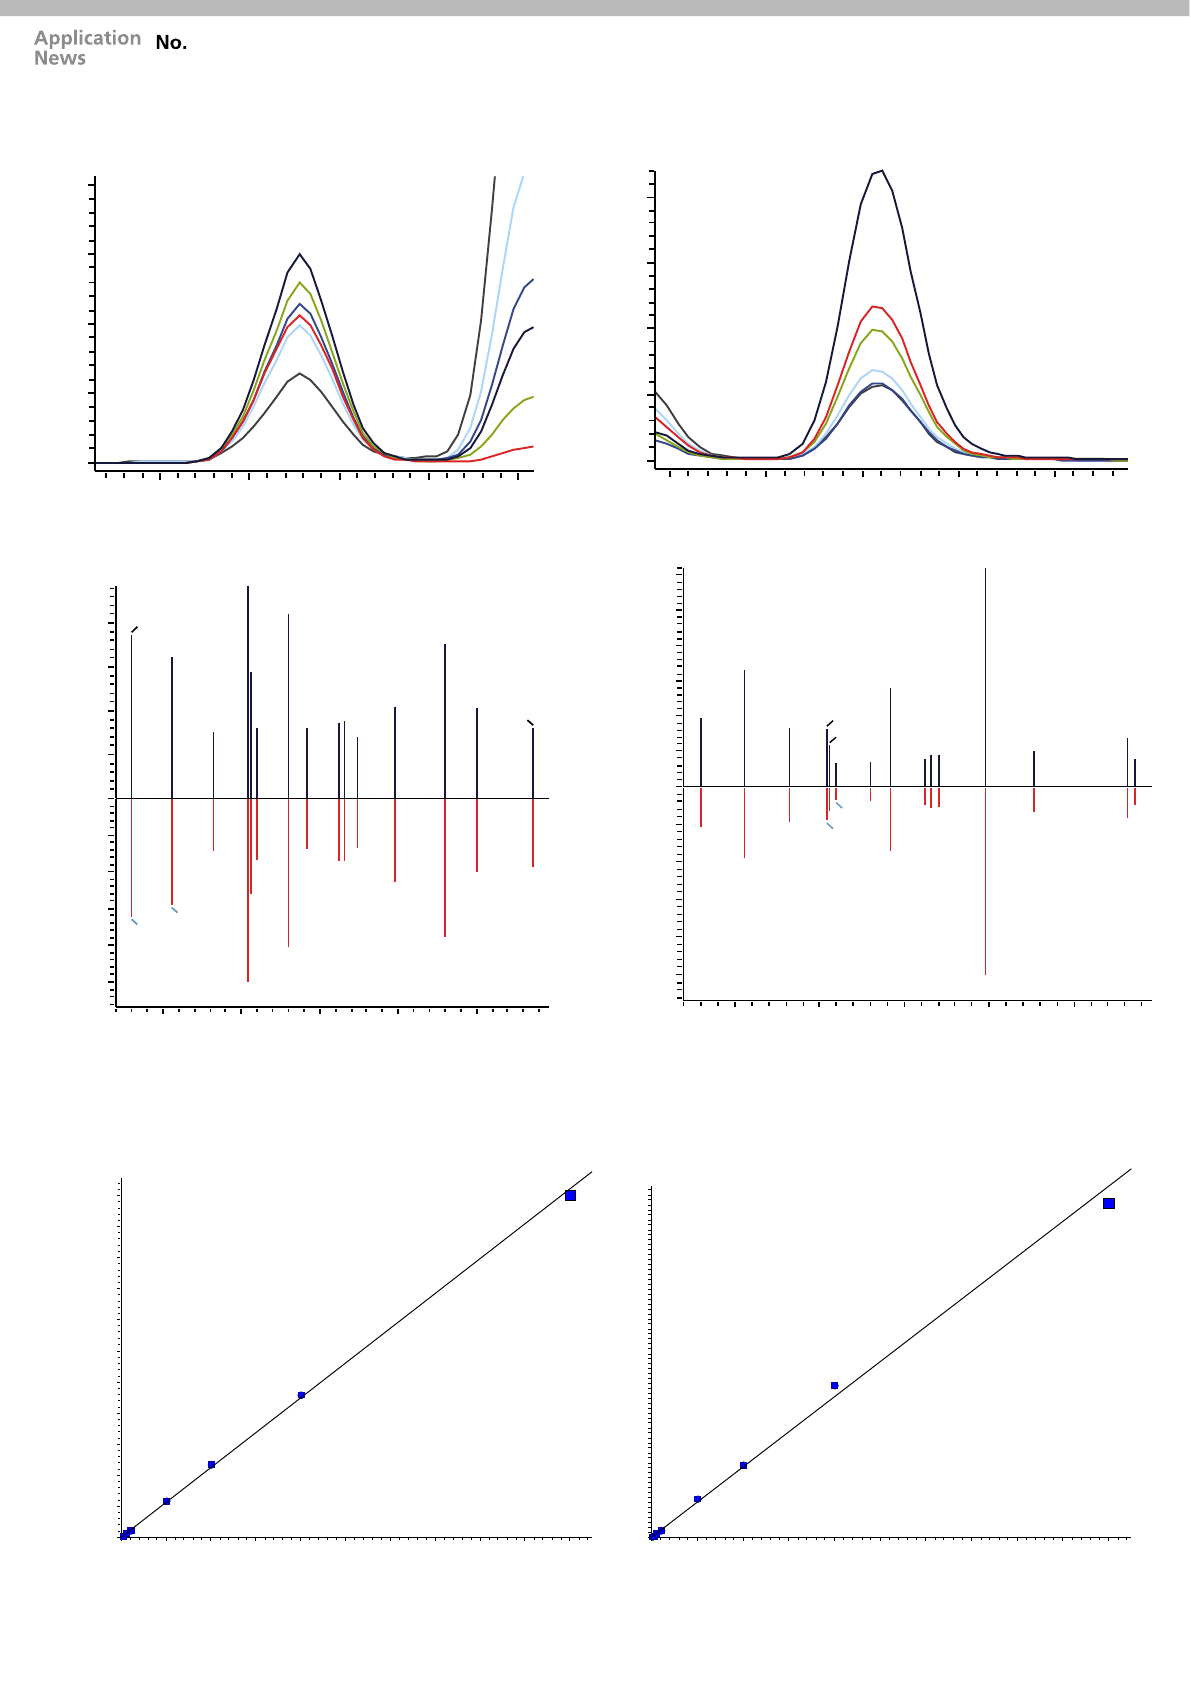
Figure 2: MRM spectrum mode MS/MS data for codeine and hydrocodone extracted from plasma samples using the CLAM-2000
extraction protocol. The identification of isobaric compounds such as codeine and hydrocodone in plasma samples was
confirmed by matching acquired MRM spectrum data with a reference library generated using certified materials.
Compound Codeine
Calibration range 2.5-500ug/L
Q: 300.1 > 152.1
Regression analysis
y = 0.04496957 + 0.01203203
R² = 0.999347
0 50 100 150 200 250 300 350 400 450 500
0
2
4
6
8
10
12
14
16
18
20
22
Area Ratio
Conc.
0 50 100 150 200 250 300 350 400 450 500
0
2
4
6
8
10
12
14
16
18
20
22
24
26
28
Compound Hydrocodone
Calibration range 1-500ug/L
Q: 300.1 > 199.1
Regression analysis
y = 0.05681472x - 0.01050782
R² = 0.9959177
Area Ratio
Conc.
Figure 3: Calibration curve data for codeine and hydrocodone extracted from plasma samples (calibration range 1-500ug/L).
SCA_210_050
• Application of the whole procedure to real
patient
The whole automated sample preparation and LC-
MS/MS analysis was tested by comparing
quantitative results from 43 patients samples
(plasma or whole blood) prepared by the “CLAM-
8060” with those from a pre-existing validated
method using an LCMS-8050 system, using
QuEChERS salts extraction method, routinely
used in the lab [5]. The “CLAM-8060” method was
measured by MRM Spectrum mode whereas the
LCMS-8050 system measured samples using a
conventional MRM method. Patient blood or
plasma samples were obtained from a diverse
range of backgrounds commonly encountered in
the laboratory including routine drug testing, DUID
or emergency overdose.
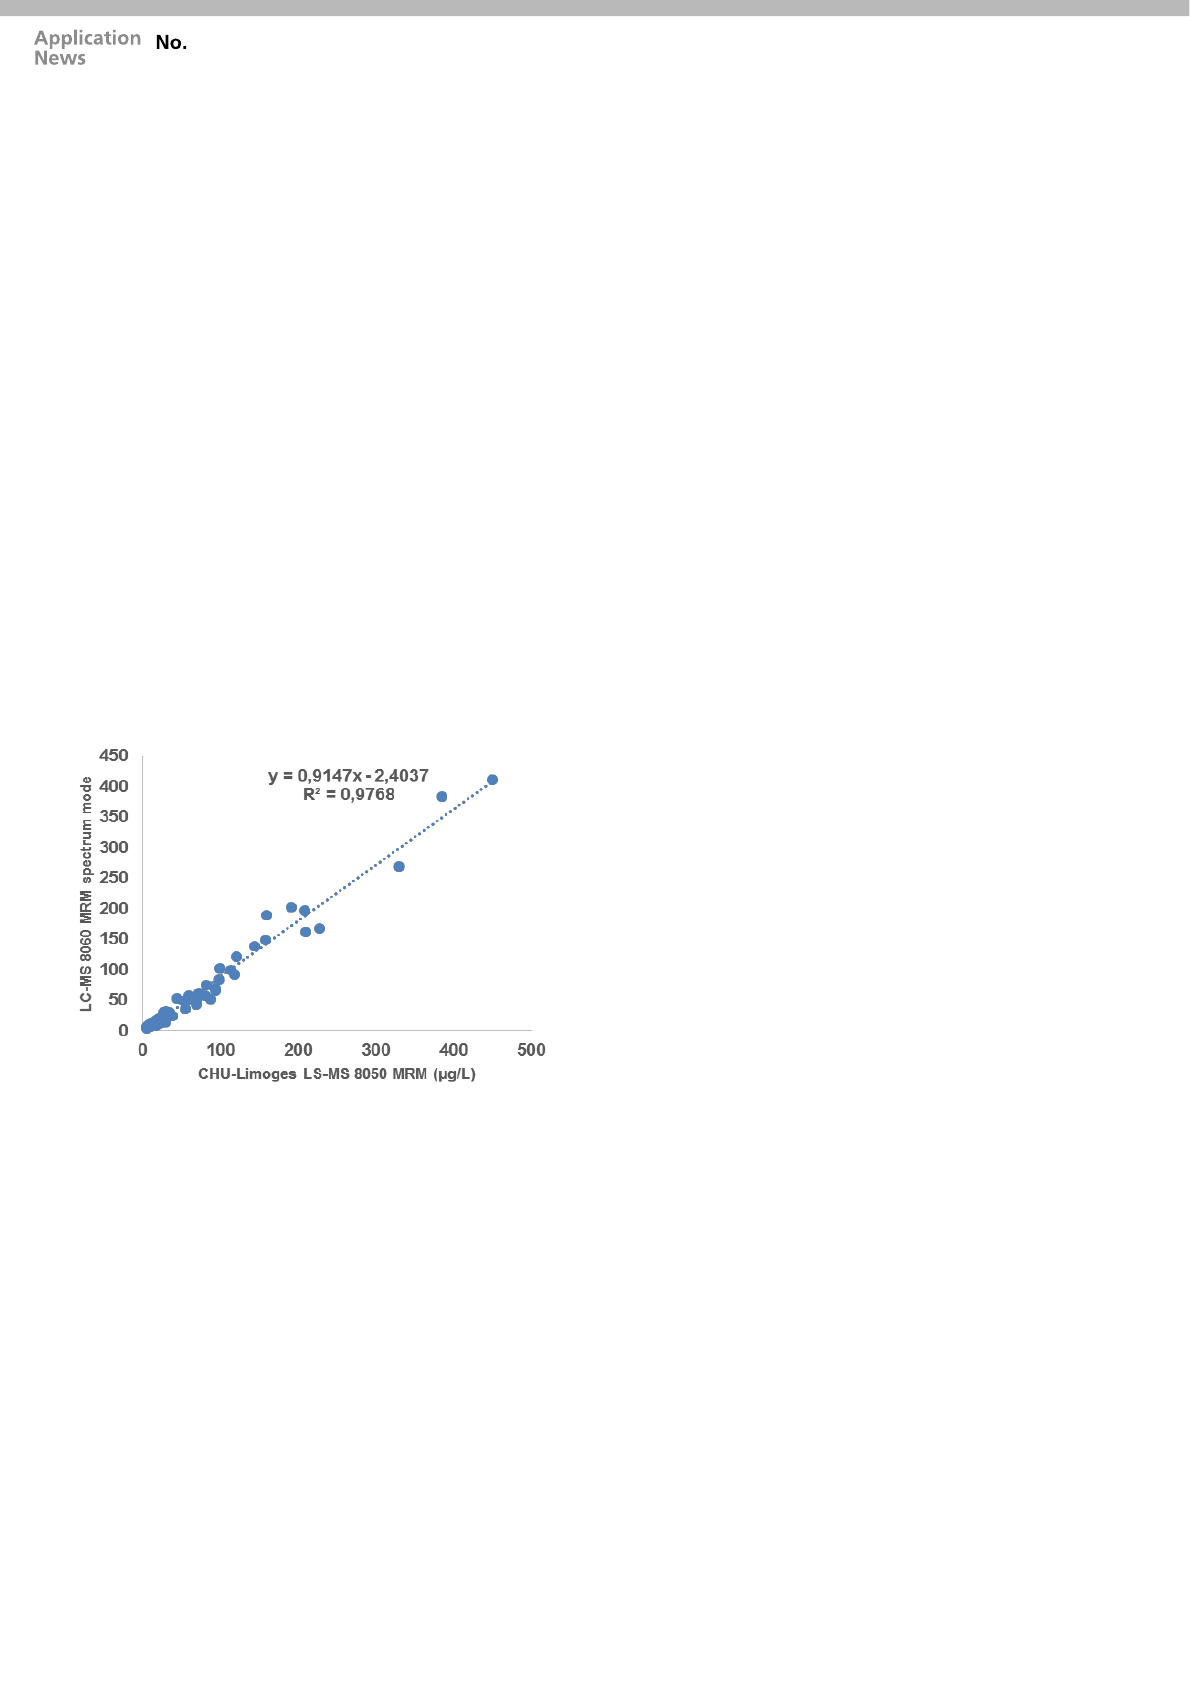
Figure 4 shows a global agreement in terms of
quantitation of these compounds.
▪ Conclusion
We report the first fully automated LC-MS/MS
analysis method for the detection and
determination of DOA in blood with the inclusion of
library identification using MRM Spectrum mode.
The implementation of automation for all or part of
the analysis process eliminates human errors
made by manual preparation and saves time in the
laboratory enabling technicians to perform other
manual tasks while the system performs the
analysis automatically.
We have developed a method where no human
intervention was necessary when the primary tube
was loaded on board the system. Sample
preparation was synchronized with the LC-MS/MS
system resulting in no time being lost whilst
maintaining the ability to prepare the sample on-
line and direct injection immediately after
preparation.
We used a spectral acquisition method that allows
to reconstruct a spectrum containing all the
specific transitions of a molecule. Unlike other
previously published approaches where two or
three collision energies were applied to all
molecules in a method using product ion scanning,
we have optimized collision energy for up to 15
transitions per molecule. This approach makes it
possible to obtain extremely specific and rich
spectral information. Furthermore no threshold
triggering was applied, so all MRMs were
measured during the entire scheduled acquisition
period. Therefore even at very low signal
intensities an MRM Spectrum could be generated.
By using very fast dwell and pause times the
burden of measuring additional MRM transitions
did not alter the sensitivity compared to the
standard 2-3 transition approach and the 42
molecules were all validated to the requirements of
ISO 15189 accreditation. We validated the
specificity, sensitivity and robustness of this
method for the analysis of 42 DOA and we
compared its performance with that of a method
accredited in the laboratory in a panel of samples
obtained from patients. Investigation in to the
system stability and robustness by repeat
calibration curve analysis demonstrated excellent
reproducibility. With inclusion of spiked deuterated
standards in unknown samples for quality control
purposes we estimated our results could be
quantified with an uncertainty of less than 20%
using a calibration curve dating up to one month.
In the case of emergency patient sample analysis,
quantifying a concentration from an unknown
sample to this level of accuracy with such speed
may mean that lifesaving treatment might be
administered within a time frame which is normally
not possible with conventional sample treatment
and analysis.
Figure 4: Regression analysis comparing the results from 43 patient
blood or plasma samples acquired using the LCMS-8060 MRM
spectrum mode method with library searching to a conventional
LCMS-8050 MRM method.
SCA_210_050
▪ References
1. Cailleux A, Le Bouil A, Auger B, Bonsergent
G,Turcant A, Allain P. Determination of
opiates and cocaine and its metabolites in
biological fluids by high-performance liquid
chromatography with electrospray tandem
mass spectrometry. J Anal Toxicol. 1999;23:
620–4.
2. Moeller MR, Steinmeyer S, Kraemer T.
Determination of drugs of abuse in blood. J
Chromatogr B Biomed Sci Appl. 1998;713:91–
109.
3. Saussereau E, Lacroix C, Gaulier JM, Goulle
JP. On-line liquid chromatography/tandem
mass spectrometry simultaneous
determination of opiates, cocainics and
amphetamines in dried blood spots. J
Chromatogr B. 2012;885–886:17.
4. Anzillotti L, Odoardi S, Strano-Rossi S.
Cleaning up blood samples using a modified
“QuEChERS” procedure for the determination
of drugs of abuse and benzodiazepines by
UPLC–MSMS. Forensic Sci Int. 2014;243:99–
106.
5. Dulaurent, S., El Balkhi, S., Poncelet, L.,
Gaulier, J.M., Marquet, P., Saint-Marcoux, F.
(2016) QuEChERS sample preparation prior
to LC-MS/MS determination of opiates,
amphetamines, and cocaine metabolites in
whole blood, Analytical and Bioanalytical
Chemistry, 408(5), 1467–1474.
6. Sauvage, F.L., Gaulier, J.M., Lacha tre, G.,
Marquet, P (2008) Pitfalls and Prevention
Strategies for Liquid Chromatography–
Tandem Mass Spectrometry in the Selected
Reaction–Monitoring Mode for Drug Analysis,
Clinical Chemistry, 54:9, 1519–1527
SCA_210_050
www.shimadzu.eu
Shimadzu Europa GmbH