5_PO-CON1693E.pdf - 第5页
5 Fully automated platform for determination of immunosuppressant drugs in whole blood Figure 4: Methods comparison. A) n=59 real samples Tacrolimus. B) n=20 real samples Tacrolimus. Real samples (EDTA whole blood from p…
4
Fully automated platform for determination of
immunosuppressant drugs in whole blood
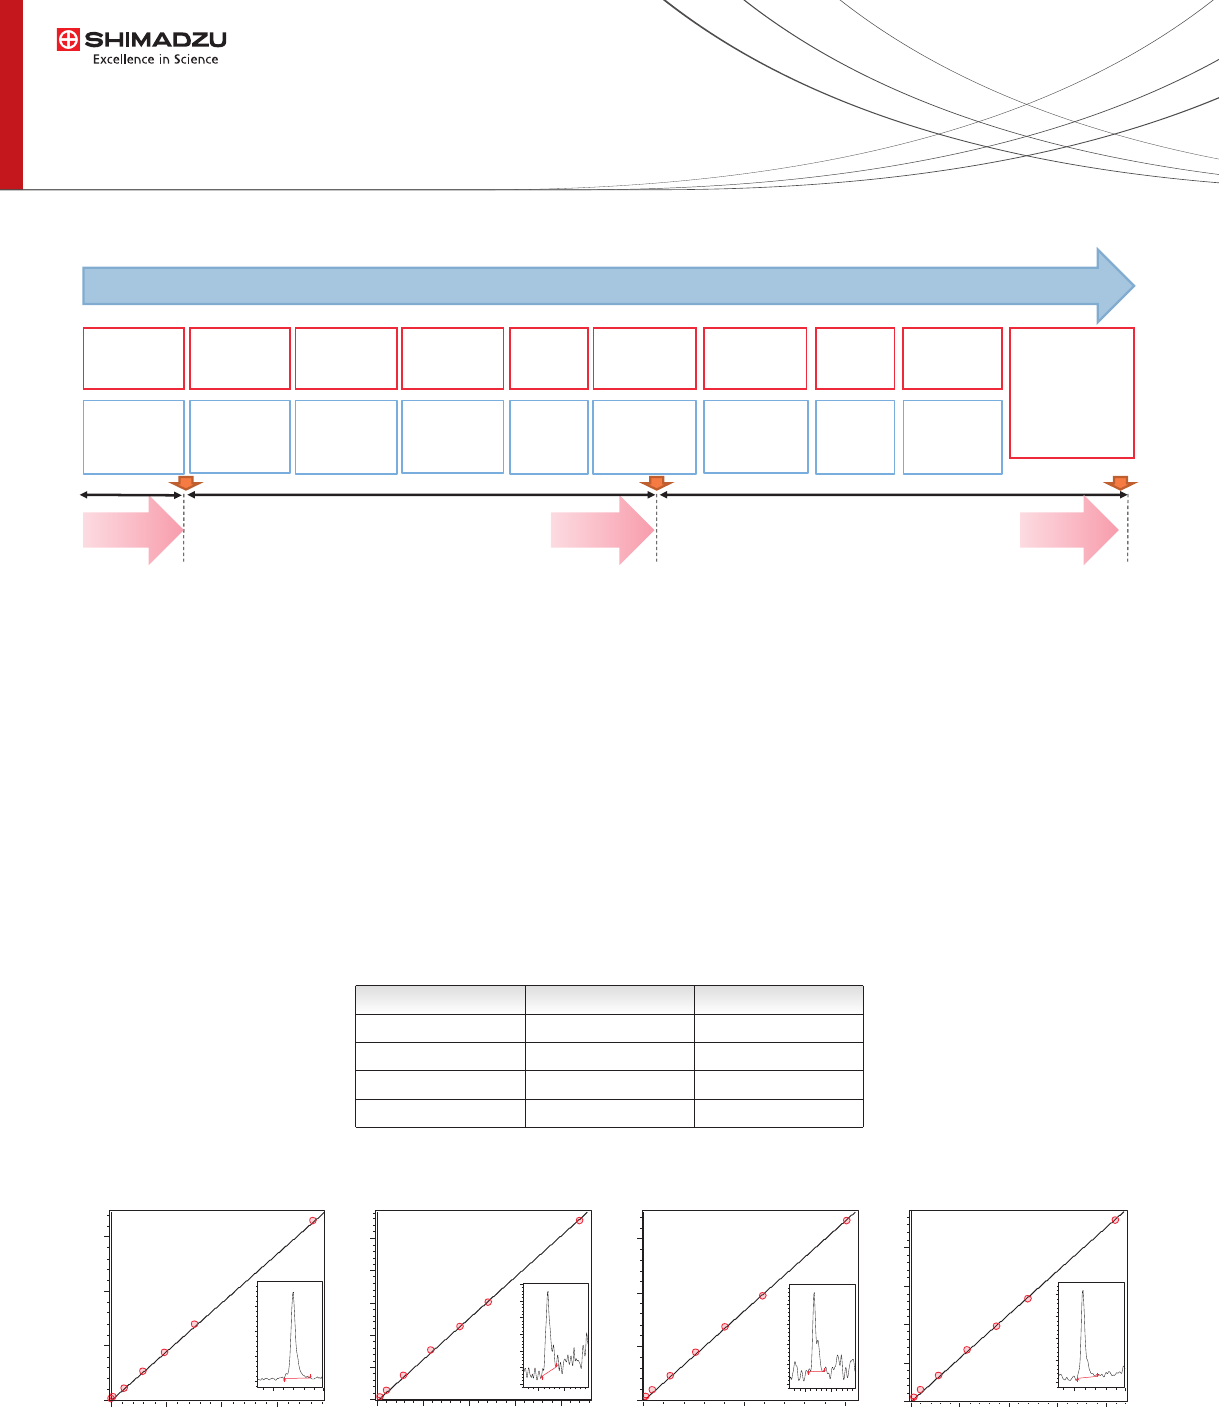
Figure 3: Linearity and LLOQ.
Figure 2: CLAM2000 fully automated sample preparation and analysis.
Due to the overlapped sample preparation the throughput of the instrument was
1 result each 3.7 minutes for Immunosuppressant quantication.
Linearity and Accuracy were evaluated using reference
whole blood calibrators (7 levels) spanning from a wide
range of concentrations (Cyclosporin 16.5 – 1100 µg/mL,
Everolimus 0.86 – 32.7 µg/mL , Sirolimus 0.9 – 32.7
µg/mL, Tacrolimus 0.96 – 34.8 µg/mL). For all analytes
Linearity was >0.99 (see Table 3) with S/N >25 for LLOQ
levels (Figure 3). Precision of the assay was evaluated
using Chromsystems reference materials (whole blood
controls levels) spanning from low concentration to
highest concentration for each analyte (Table 4).
Linearity, Accuracy and Precision
Reagent
Dispensing
Extr. Buffer
50 ul
Sample
Dispensing
Whole blood
25 ul
Internal STD
12.5 ul
Reagent
Dispensing
Stirring
2200 rpm
Incubation
Room
temperature
Reagent
Dispensing
Filtration
Aspiration
Direct UHPLC
connection for
LCMS analysis
(2.3 min)
Stirring
2200 rpm
Parallel/Sequential sample preparation and analysis
Reagent
Dispensing
MetOH
20 ul
Sample 3
processing
Sample 2
processing
Sample 1
result
Prec. Reagent
125 ul
Table 3: Linearity & Accuracy.
Cyclosporin A
Tacrolimus
Sirolimus
Everolimus
Compound
90.4%-103.6%
99.7%-101-3%
95.1%-105.5%
96.9%-107%
Accuracy
0.998
0.997
0.998
0.998
r
2
0 500 1000 Conc. Ratio
0,0
2,5
5,0
7,5
Area Ratio
1,5 2,0
0
5000
10000
15000
0 10 20 30 Conc. Ratio
0,0
0,5
1,0
1,5
2,0
2,5
Area Ratio
1,50 1,75
0
250
500
750
1000
1250
1500
0,0 25,0 Conc. Ratio
0
1
2
3
Area Ratio
1,50 1,75
0
500
1000
1500
2000
0 10 20 Conc. Ratio
0,0
0,5
1,0
1,5
2,0
Area Ratio
1,5 2,0
0
2500
5000
7500
10000
Cyclosporin A Everolimus Sirolimus Tacrolimus
5
Fully automated platform for determination of
immunosuppressant drugs in whole blood
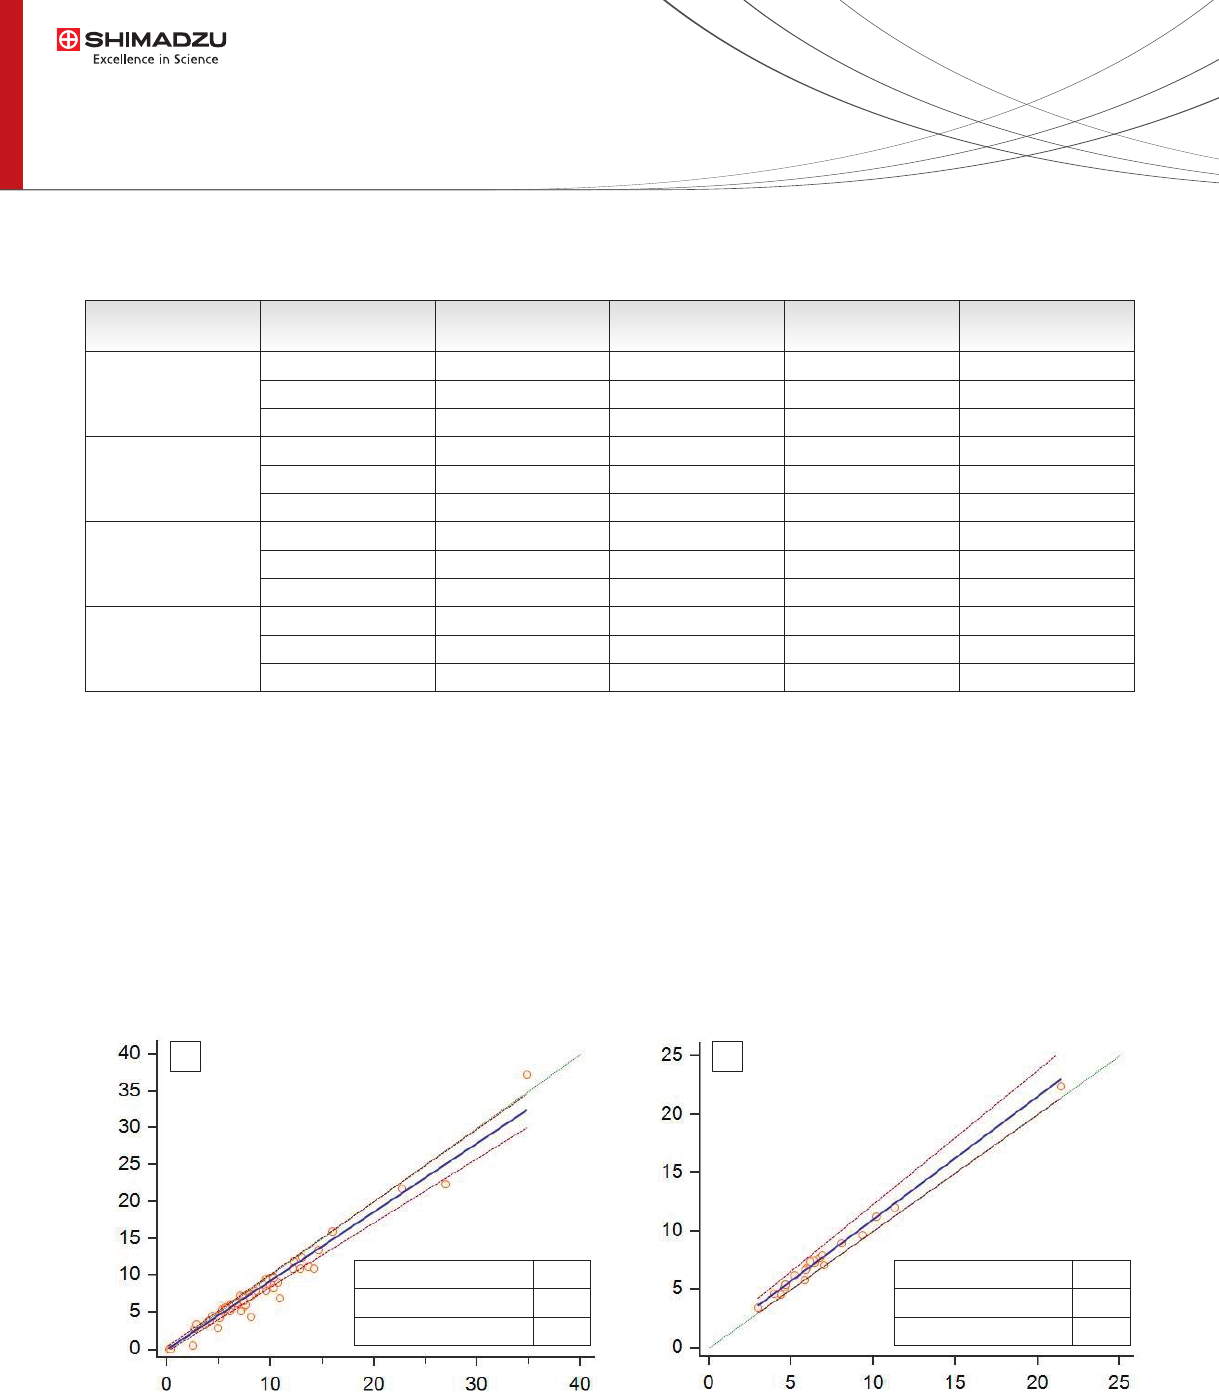
Figure 4: Methods comparison. A) n=59 real samples Tacrolimus. B) n=20 real samples Tacrolimus.
Real samples (EDTA whole blood from patients treated
with Tacrolimus) were analyzed using both manual
sample preparation and fully automated sample
preparation (CLAM-2000). The Tacrolimus concentration
obtained by the two sample preparation methods shown
a good agreement (Figure 4 B). Moreover the Tacrolimus
concentration in 59 whole blood real samples was
evaluated with Immunoassay and CLAM-2000
LC-MS/MS approaches. As shown by Passing and Bablok
plots (Figure 4 A) there was a good agreement between
the two different methods of quantication.
Methods correlation
Cyclosporin
Tacrolimus
Sirolimus
Everolimus
1.70%
1.33%
2.56%
2.95%
8.00%
1.85%
2.68%
12.18%
6.01%
4.54%
7.16%
4.75%
BIAS%
(intra-assay)*
7.9%
4.3%
5.8%
5.6%
4.7%
4.4%
3.7%
4.1%
4.9%
8.9%
8.2%
3.3%
CV%
(inter-assay)**
1.68%
1.22%
3.08%
3.58%
12.33%
6.57%
5.59%
14.77%
12.99%
6.44%
11.77%
7.64%
BIAS%
(inter-assay)**
Low (16.5)
Mid (49.7)
High (1100)
Low (2.86)
Mid (7.73)
High (34.8)
Low (2.76)
Mid (9.89)
High (32.7)
Low (2.6)
Mid (4.79)
High (32.7)
Ref. Level
(ug/L)
6.0%
2.2%
1.83%
3.29%
2.69%
2.76%
1.02%
2.44%
2.59%
2.04%
5.98%
2.55%
CV%
(intra-assay)*
Intercept A (95%CI)
Slope (95%CI)
Corr. Coeff. (P<0,0001)
-0.1
0.94
0.95
Intercept A (95%CI)
Slope (95%CI)
Corr. Coeff. (P<0,0001)
0.4
1.08
0.99
CLAM-2000
CLAM-2000
Table 4: Repetability, Reproducibility , Accuracy, evaluated using Chromsystems reference controls.
* n=7 . ** n=3 non consecutive days with instrument shutdown.
Manual Sample PreparationIMMUNOASSAY
A B

Fully automated platform for determination of
immunosuppressant drugs in whole blood
First Edition: October, 2016
Conclusions
• Fully Automated sample preparation procedure resulted suitable for the quantitation of Immunosuppressant by
elimination of all manual preparation steps.
• The automation of the method increases the analytical performance, reduces the risk for human operators and,
due to the reduced reagent consumption, reduces also the cost of the analysis.