3_Application_News_No_C123.pdf - 第2页
Application New s No. C 12 3 Fig. 2 shows the mass chromatogram for a control sample consisting of seven antiepileptic drugs and drug metabolites added to human blood serum. Because LC/ MS/MS can detect target drugs sele…
Application
News
No.
C123
Liquid Chromatography Mass Spectrometry
High-Throughput Optimization of Therapeutic Drug
Monitoring Using Fully Automated Sample Preparation
LC/MS/MS System (CLAM-2000 + LCMS-8040)
LAAN-A-LM-E094
Therapeutic drug monitoring (TDM) is a series of
processes where the blood concentration of drugs in a
patient is measured to determine the optimal dose and
method of administration for an individual based on
pharmacokinetic and pharmacodynamic analysis. TDM
is used during drug treatment with drugs that pose
administration management difficulties, such as drugs
with a narrow therapeutic range or with an effective
range and toxic range that are close to each other. High
performance liquid chromatography (HPLC) has been
the main analytical method used with TDM, but recently
liquid chromatography-mass spectrometry (LC/MS/MS)
is being used to improve analytical accuracy and
precision based on its superior selectivity.
LC/MS/MS normally requires sample preparation steps
such as deproteinization and dilution to analyze a blood
serum or blood plasma sample. These steps introduce
the risk of error or variability occurring based on
operator skill. The volume of work performed by an
operator also increases in accordance with the number
of samples. Therefore, the sample preparation process
can become the bottleneck of an analytical workflow
when analyzing a large number of samples.
n High-Throughput Analytical Workflow for
Antiepileptic Drug Analysis
We introduce an example simultaneous analysis of
seven antiepileptic drugs and drug active metabolites in
blood serum using a fully automated sample
preparation LC/MS/MS system.
Preparation of blood serum samples for analysis
normally requires deproteinization by the addition of
organic solvent, and then centrifugal separation of solid
components followed by supernatant recovery. The fully
automated sample preparation LC/MS/MS system only
Fully Automated Sample Preparation LC/MS/MS System
This article introduces the results of TDM using a fully
automated sample preparation LC/MS/MS system
comprised of the CLAM-2000 fully automated LCMS
sample preparation unit and the LCMS-8040 high
performance liquid chromatograph-mass spectrometer.
This system resolves the above-mentioned problems
associated with TDM, and achieves TDM research results
on a fast and high-precision analytical workflow.
requires placing of the blood collection tube in the
system, as the system performs all these preparation
steps automatically, followed by LC/MS/MS analysis
(Fig. 1).
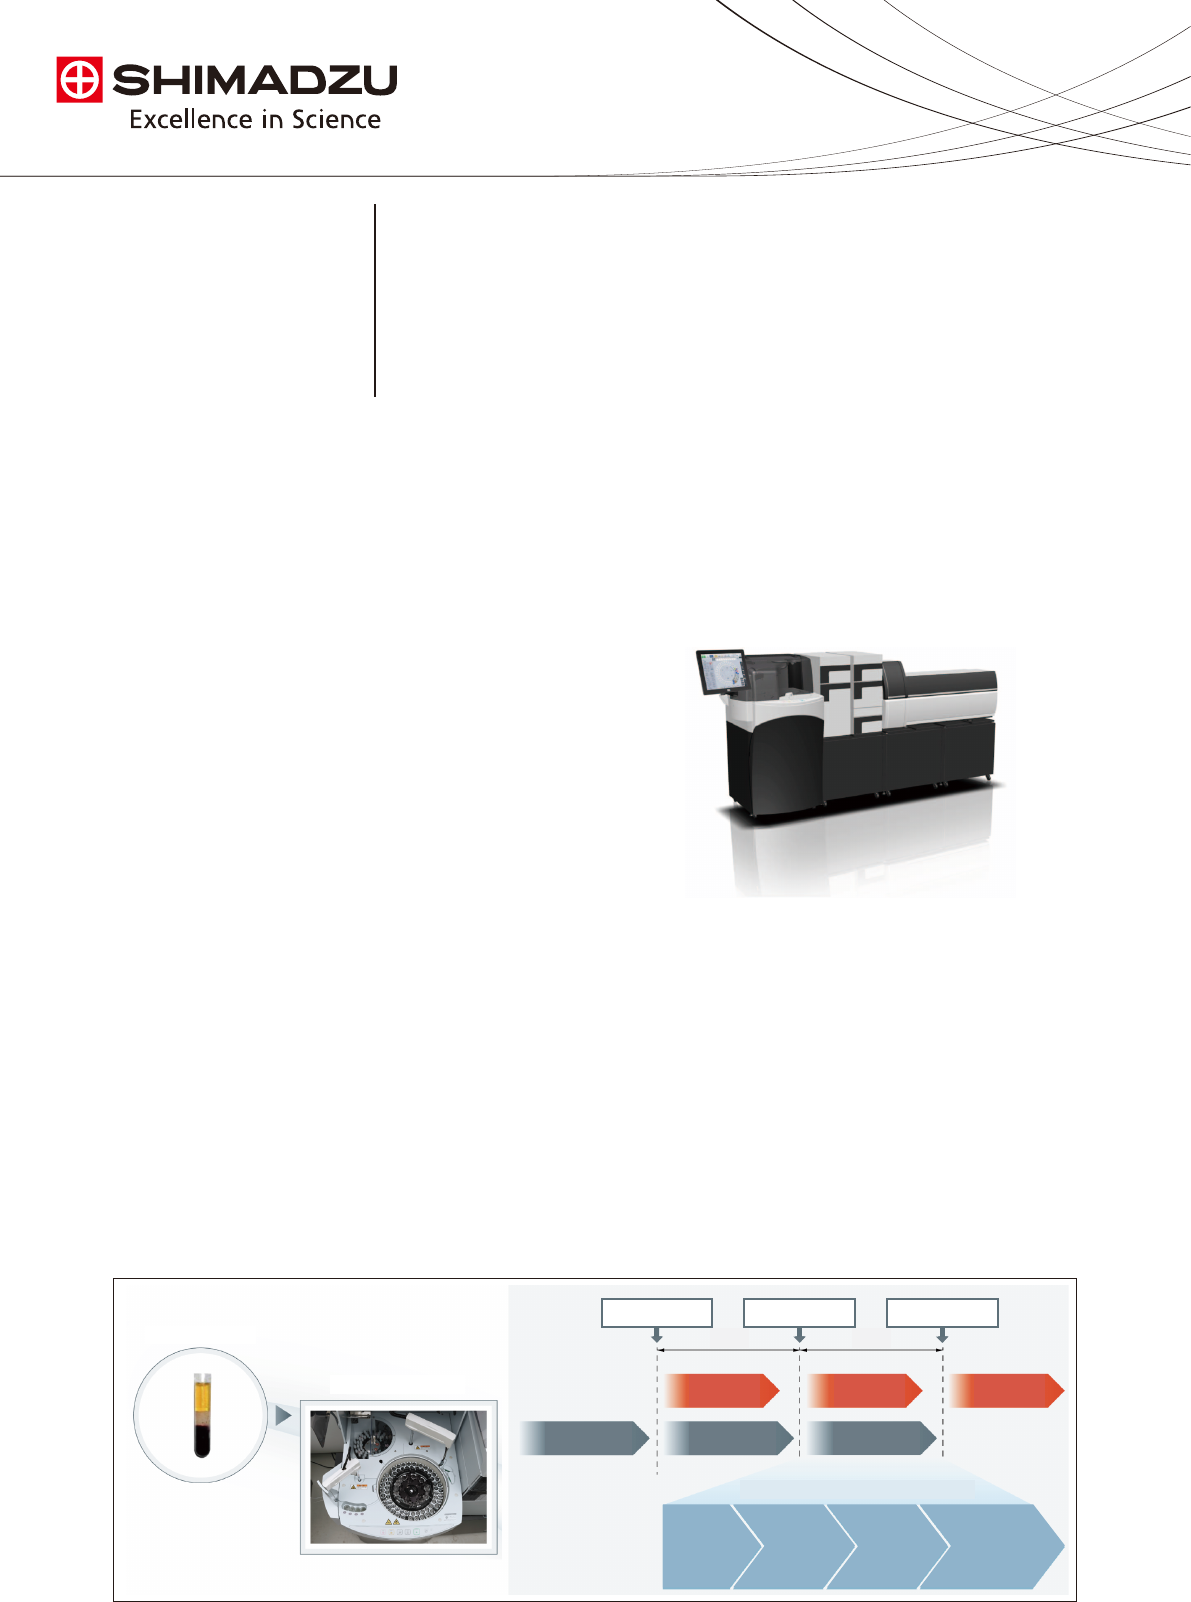
Preparation of the next sample can also be performed
in parallel with LC/MS/MS analysis, which can greatly
reduce the time required for each sample analysis. In
our example, a per-sample cycle time including analysis
of 9 minutes is achieved.
Fig. 1
Workflow for Simultaneous Analysis of Antiepileptic Drugs in Blood Serum Using Fully Automated Sample Preparation LC/MS/MS System
Preparation of the
blood collection tube
9 min 9 min
MS analysis
7 min
MS analysis
7 min
MS analysis
7 min
Deproteinization step
8 min
Deproteinization step
8 min
Deproteinization step
8 min
Deproteinization using the CLAM-2000
Sample injection
Sample injectionSample injection
Setting of blood collection
tube and reagents in system
Serum
Sample
injection
• Freeze-dried
blood serum
• 30 µL
Filtration
• PTFE membrane
• Pore size:
0.45 µm
• Pressure:
-50 to -60 kPa
• Time: 150 sec
Reagent
injection
• Methanol
• 270 µL
Stirring
• Rotation
speed
1800 rpm
• Time:
150 sec
Application
News
No.
C123
Fig. 2 shows the mass chromatogram for a control
sample consisting of seven antiepileptic drugs and drug
metabolites added to human blood serum. Because LC/
MS/MS can detect target drugs selectively based on the
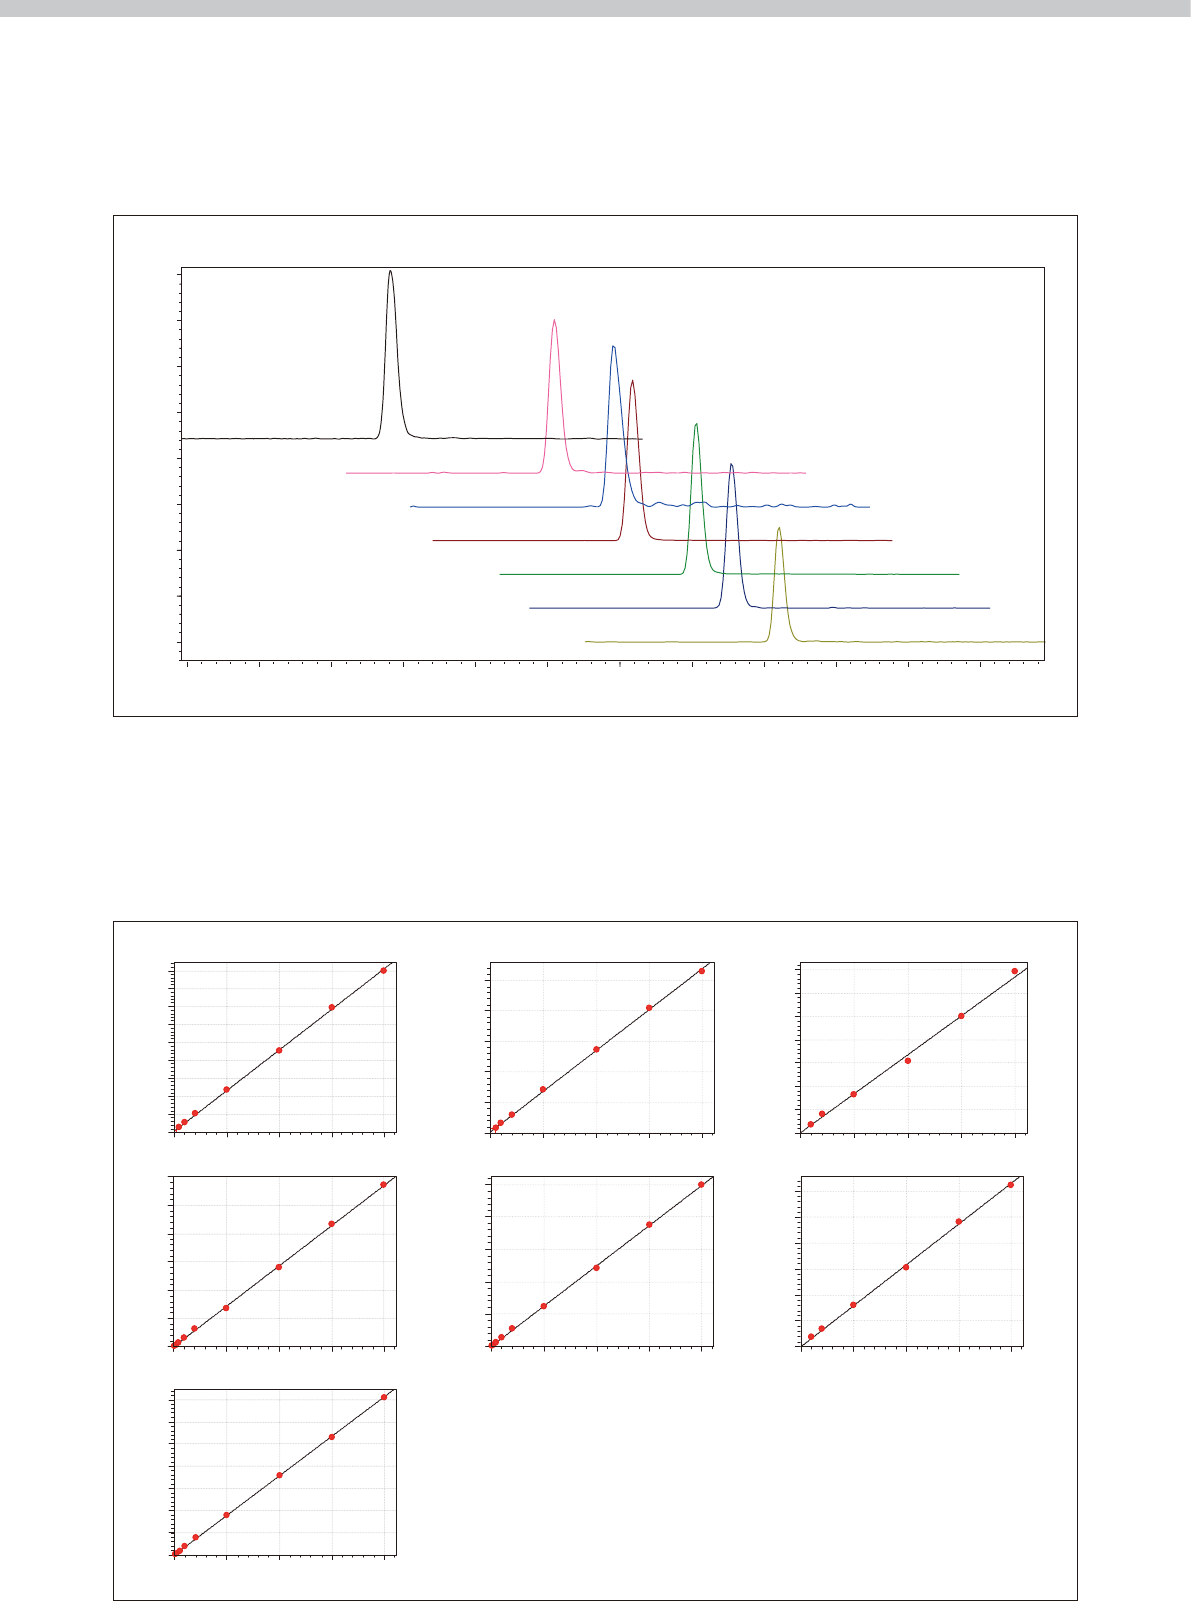
Calibration curves were prepared by continuous analysis
with fully automated sample preparation and analysis,
and used to assess accuracy and precision (repeatability).
Good linearity was obtained across the set calibration
curve range for each antiepileptic drug (Fig. 3), with
mass and structure of those drugs, the results show no
apparent interference from other constituents in the
blood serum.
accuracy within 100 % ±15 % over the entire
measurement range including the minimum limit of
quantification. Similarly, precision was measured at a
%RSD of within 15 %, showing that good repeatability
was achieved (Table 1).
Fig. 2 Mass Chromatogram of Seven Antiepileptic Drugs and Drug Metabolites in a Control Serum Sample
Fig. 3 Calibration Curves of Seven Antiepileptic Drugs and Drug Metabolites
2.00 2.50 3.00 3.50 4.00 4.50 min
0.00
0.50
1.00
1.50
2.00
(× 100,000)
Diazepam 285.15 > 153.95 (+)
Tiagabine 376.25 > 111.05 (+)
Carbamazepine 237.20 > 194.05 (+)
Topiramate 338.10 > 78.00 (-)
Carbamazepine 10-11-epoxide 253.15 > 180.05 (+)
Felbamate 239.20 > 117.00 (+)
Levetiracetam 171.15 > 126.10 (+)
Diazepam
Tiagabine
Carbamazepine
Carbamazepine 10-11-epoxide
Topiramate
Felbamate
Levetiracetam
r
2
r= 0.999
= 0.999
2
r999.0=
2
=0.999
r
2
r
2
r999.0=
2
=0.999
r
2
=0.999
Levetiracetam
Felbamate
Topiramate
Carbamazepine
-10,11-epoxide
Carbamazepine
Tiagabine
Diazepam
Concentration Concentration Concentration
Concentration
Concentration
Concentration Concentration
Area AreaArea
Area AreaArea
Area
0
250000
500000
750000
1000000
1250000
1500000
1750000
2000000
2250000
0
500000
1000000
1500000
2000000
2500000
3000000
0
100000
200000
300000
400000
500000
600000
700000
0
100000
200000
300000
400000
500000
0
1000000
2000000
3000000
4000000
5000000
0
25000
50000
75000
100000
125000
150000
175000
0
250000
500000
750000
1000000
1250000
1500000
0 250 500 750
0 250 500 75
0
0 2500 5000 7500
0 250 500 750
0 250 500 750
0 250 500 750
0 250 500 750
Application
News
No.
C123
Table 1 Results of Validation Test for Simultaneous Analysis of Antiepileptic Drugs
Table 2 Analytical Conditions for Antiepileptic Drugs
Compounds
Range
(ng/mL)
QC samples concentration
(ng/mL)
Accuracy (%) % RSD (n=6)
LLOQ Medium ULOQ LLOQ Medium ULOQ LLOQ Medium ULOQ
Levetiracetam 10 - 750
10 100 750 94.6 106.1 99.2 3.42 1.23 1.98
Felbamate 25 - 1000 25 250 1000 98.6 101.8 99.6 6.28 1.88 1.50
Topiramate 500 - 10000 500 2500 10000 102.3 97.1 100.6 6.71 3.58 2.96
Carbamazepine-10, 11-epoxide 5 - 1000 5 100 1000 92.9 107.8 99.3 7.48 3.32 1.41
Carbamazepine 10 - 1000 10 100 1000 90.6 110.3 99.1 3.79 3.42 1.19
Tiagabine 50 - 1000 50 250 1000 98.5 101.9 99.6 1.95 2.00 1.26
Diazepam 5 - 1000 5 250 1000 98.1 102.4 99.5 4.61 1.50 1.53
Column : Inertsil ODS-4 (50 mm L. × 2.1 mm I.D., 2 μm)
Mobile Phase : A 10 mmol/L Ammonium acetate - Water
: B Methanol
Flowrate : 0.4 mL/min
Time Program : B. Conc. 3 % (0 - 0.5 min) - 90 % (3.0 - 5.0 min) - 3 % (5.01 - 7.0 min)
Column Temperature : 40 °C
Injection Volume : 1 μL
Probe Voltage : 4.5 kV / - 3.5 kV (ESI-positive / negative mode)
DL Temperature : 150 °C
Block Heater Temperature : 400 °C
Nebulizing Gas Flow : 3 L/min
Drying Gas Flow : 10 L/min
MRM Transition : Levetiracetam (+) m/z 171.15 > 126.10, Felbamate (+) m/z 239.20 > 117.00,
Carbamazepine-10,11-epoxide (+) m/z 253.15 > 180.05,
Carbamazepine (+) m/z 237.20 > 194.05, Tiagabine (+) m/z 376.25 > 111.05,
Diazepam (+) m/z 285.15 > 153.95, Topiramate (-) m/z 338.10 > 78.00
n
System Validation for Antiarrhythmic Drugs Analysis
TMD is used with a wide variety of drugs, and the
physicochemical properties of these drugs differ
individually. Therefore, confirming whether a given
series of standard operations, which includes the
process steps, tools, instruments and equipment used in
an analytical workflow, are appropriate for the target
drug is important for ensuring the analytical results
obtained are valid. We introduce an example validation
of sample preparation and analysis operations using
antiarrhythmic drugs with very different physicochemical
properties, and in particular very different hydrophilic
properties.
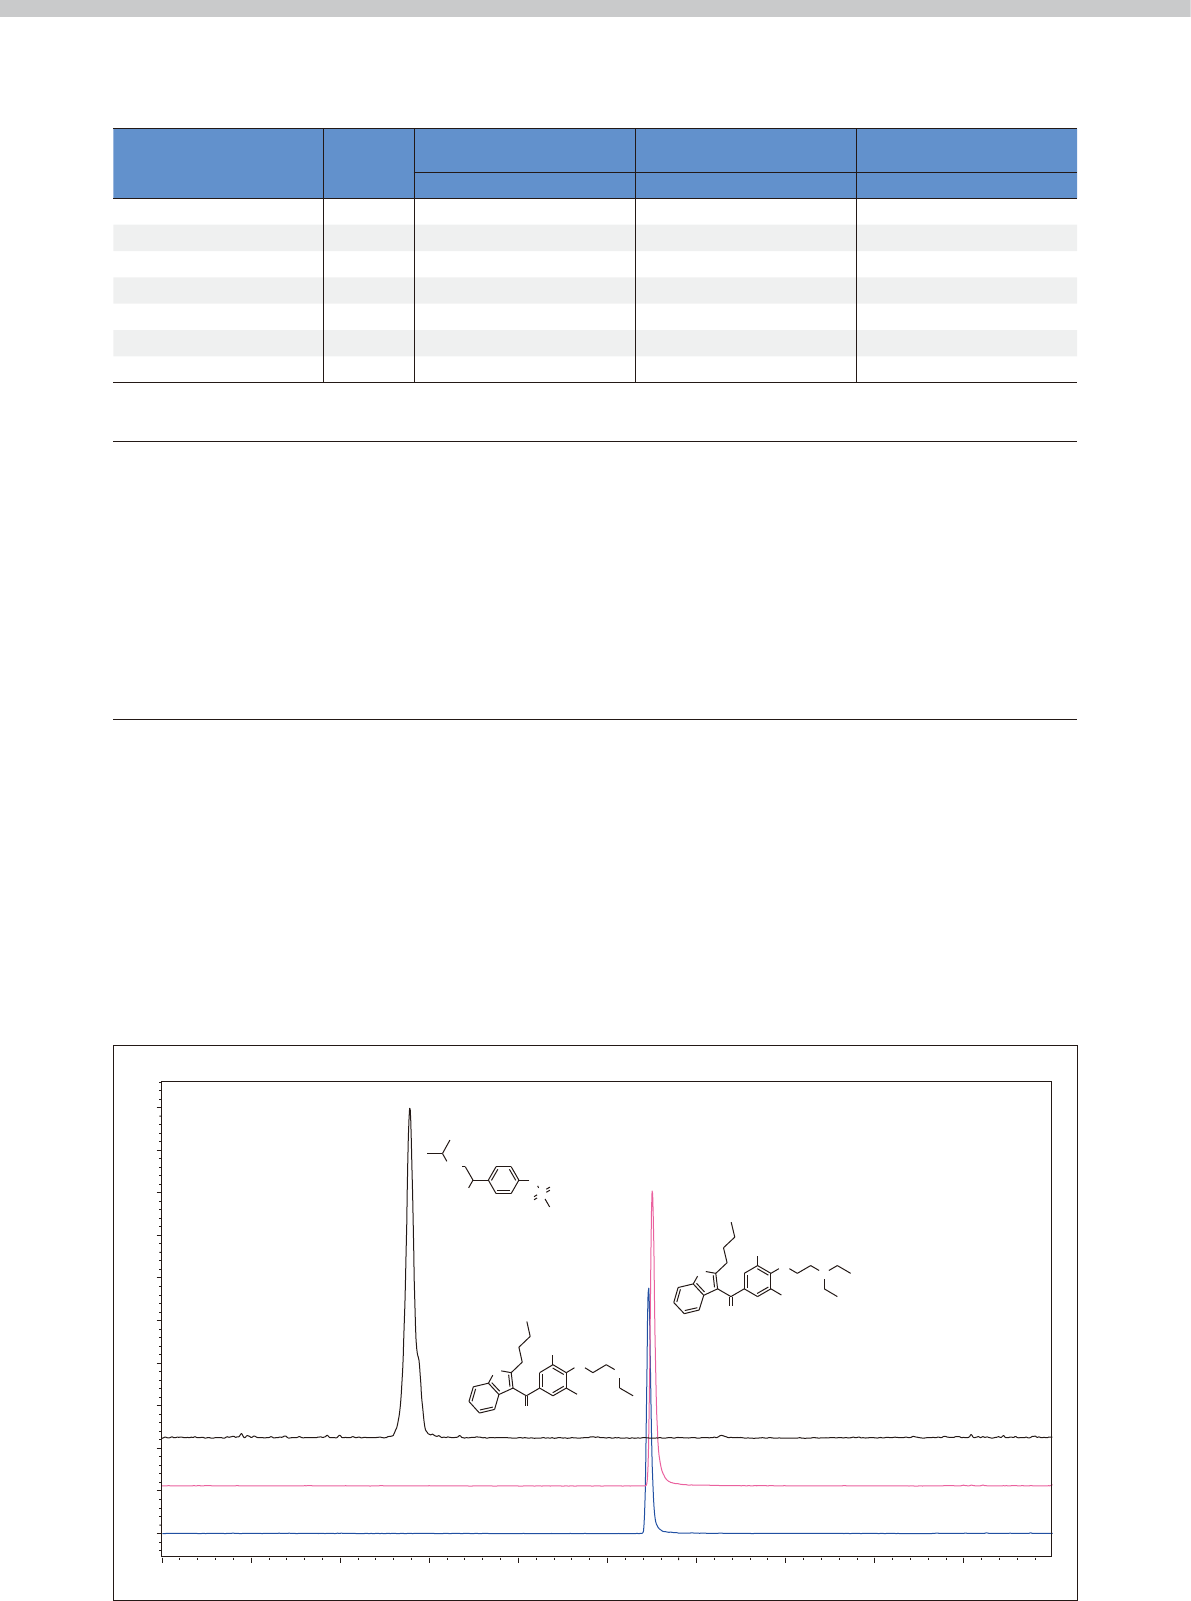
We chose the highly hydrophilic drug sotalol (partition
coefficient: log P=2.6342) and the highly hydrophobic
drug amiodarone (log P=6.9326) and its active
metabolite N-desethylamiodarone were chosen, and
performed simultaneous analysis using the fully
automated sample preparation LC/MS/MS system
(Fig. 4).
Fig. 4 Mass Chromatogram of Three Antiarrhythmic Drugs and Drug Metabolite in a Control Serum Sample
0.0 1.0 2.0 3.0 4.0 5.0 6.0 7.0 8.0 9.0 min
0.0
1.0
2.0
3.0
4.0
5.0
(× 100,000)
DEA 618.00 > 72.20 (+)
AMD 646.00 > 58.20 (+)
Sotalol 273.10 > 133.00 (+)
Sotalol
Amiodarone
N-Desethylamiodarone
S
HO
O
O
NH
NH
O
O
I
I
O
N
O
O
I
I
O
NH