3_Application_News_No_C123.pdf - 第4页
Application New s No. For Research Use Only . Not for use in diagnostic procedures. The content of this publication shall not be reproduced, alter ed or sold for any commercial purpose without the written approval of Shi…
Application
News
No.
C123
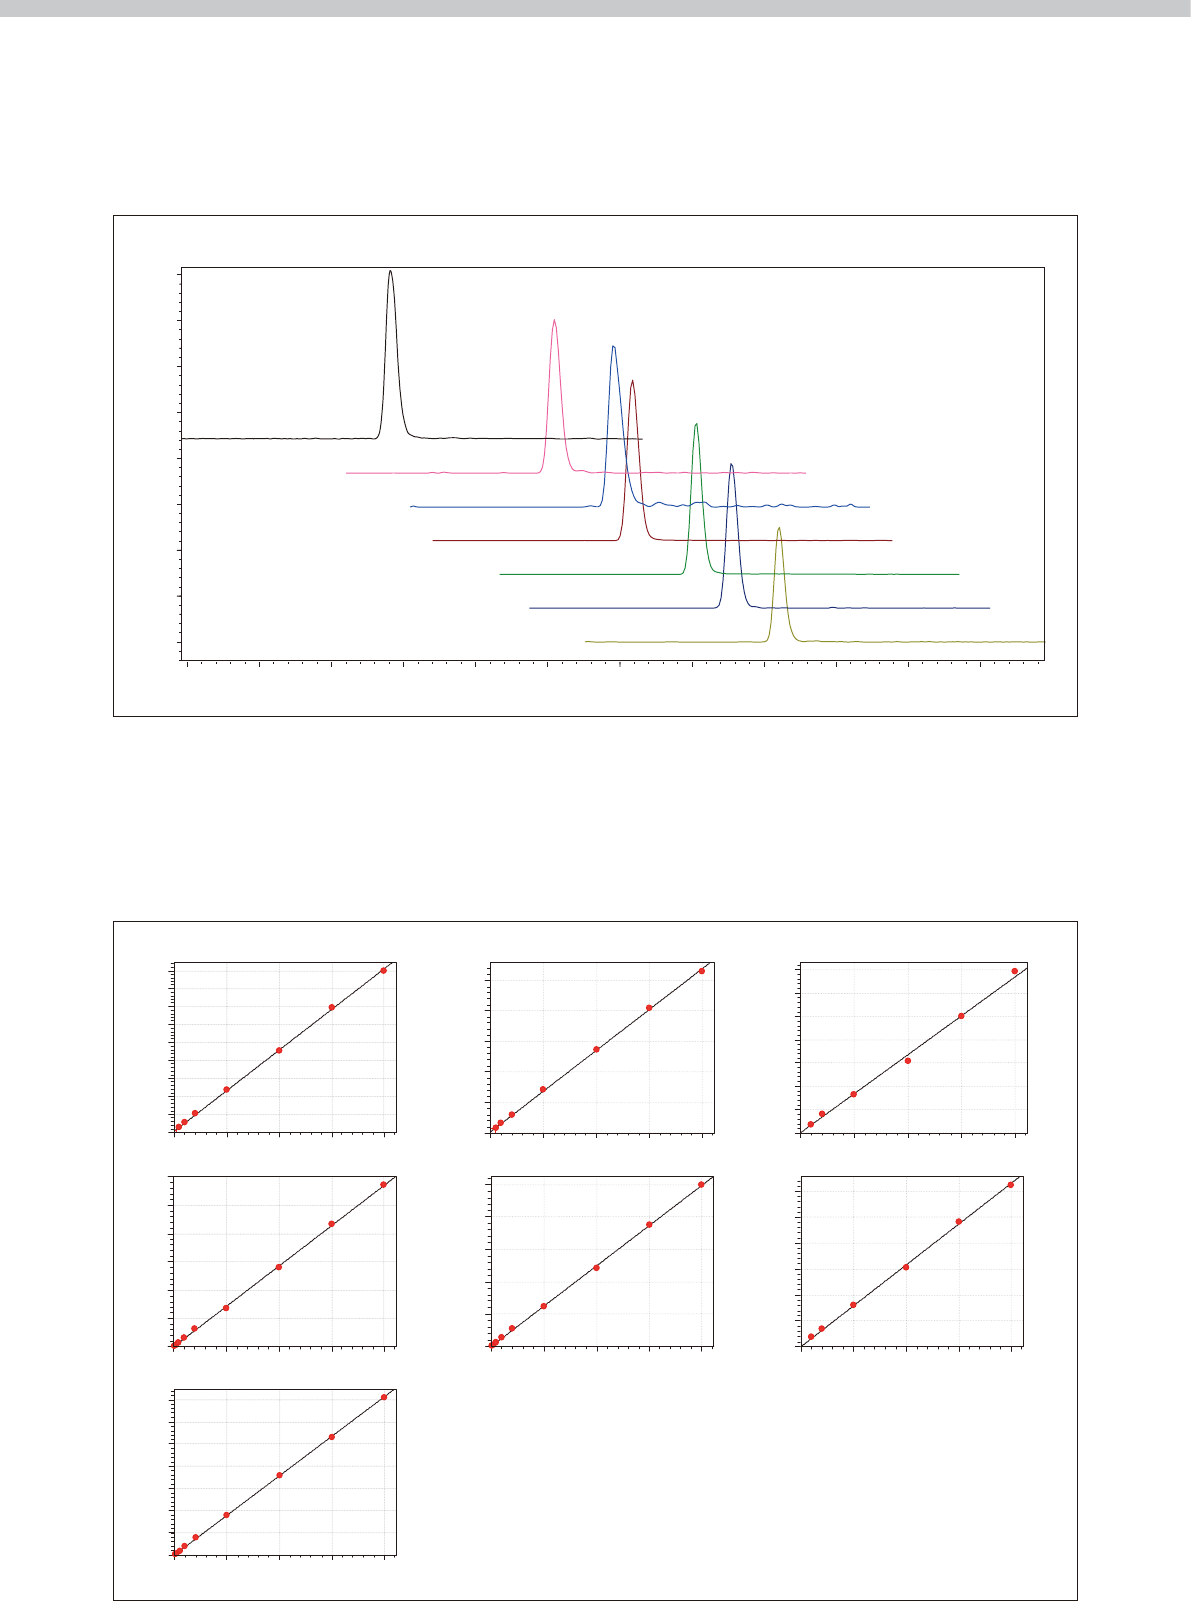
Fig. 2 shows the mass chromatogram for a control
sample consisting of seven antiepileptic drugs and drug
metabolites added to human blood serum. Because LC/
MS/MS can detect target drugs selectively based on the
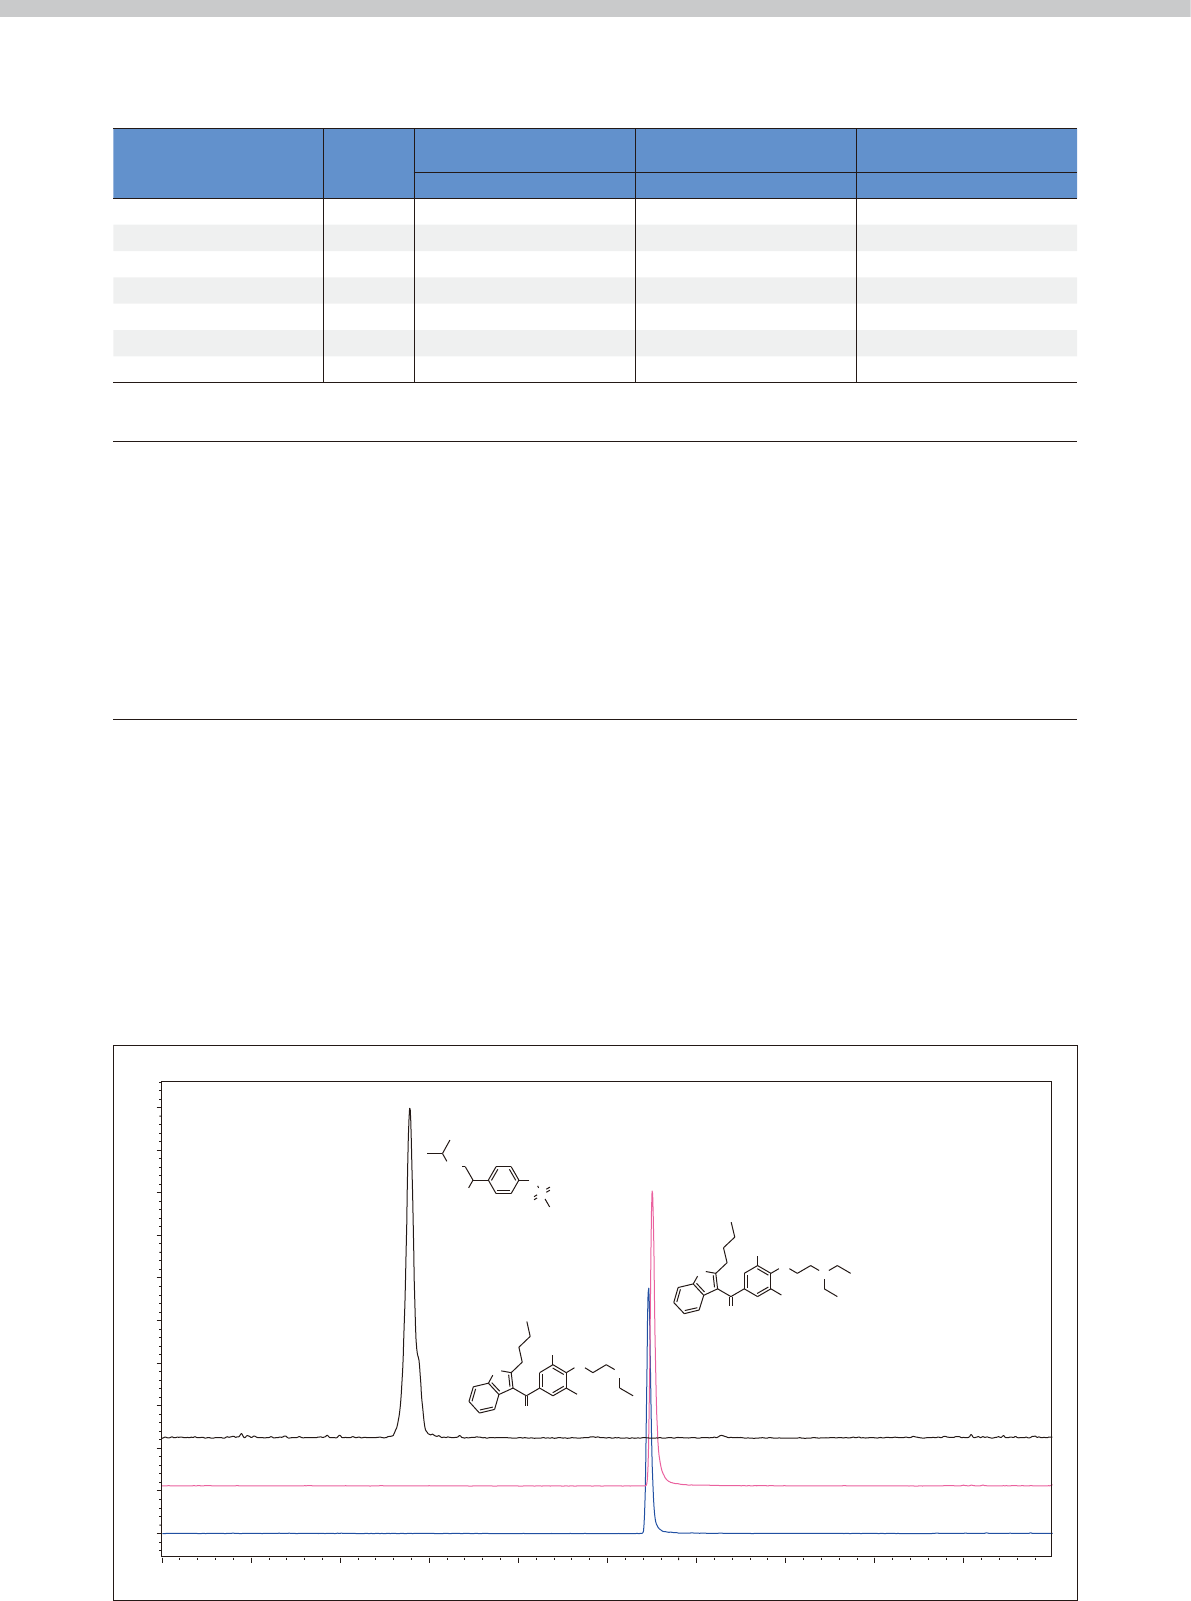
Calibration curves were prepared by continuous analysis
with fully automated sample preparation and analysis,
and used to assess accuracy and precision (repeatability).
Good linearity was obtained across the set calibration
curve range for each antiepileptic drug (Fig. 3), with
mass and structure of those drugs, the results show no
apparent interference from other constituents in the
blood serum.
accuracy within 100 % ±15 % over the entire
measurement range including the minimum limit of
quantification. Similarly, precision was measured at a
%RSD of within 15 %, showing that good repeatability
was achieved (Table 1).
Fig. 2 Mass Chromatogram of Seven Antiepileptic Drugs and Drug Metabolites in a Control Serum Sample
Fig. 3 Calibration Curves of Seven Antiepileptic Drugs and Drug Metabolites
2.00 2.50 3.00 3.50 4.00 4.50 min
0.00
0.50
1.00
1.50
2.00
(× 100,000)
Diazepam 285.15 > 153.95 (+)
Tiagabine 376.25 > 111.05 (+)
Carbamazepine 237.20 > 194.05 (+)
Topiramate 338.10 > 78.00 (-)
Carbamazepine 10-11-epoxide 253.15 > 180.05 (+)
Felbamate 239.20 > 117.00 (+)
Levetiracetam 171.15 > 126.10 (+)
Diazepam
Tiagabine
Carbamazepine
Carbamazepine 10-11-epoxide
Topiramate
Felbamate
Levetiracetam
r
2
r= 0.999
= 0.999
2
r999.0=
2
=0.999
r
2
r
2
r999.0=
2
=0.999
r
2
=0.999
Levetiracetam
Felbamate
Topiramate
Carbamazepine
-10,11-epoxide
Carbamazepine
Tiagabine
Diazepam
Concentration Concentration Concentration
Concentration
Concentration
Concentration Concentration
Area AreaArea
Area AreaArea
Area
0
250000
500000
750000
1000000
1250000
1500000
1750000
2000000
2250000
0
500000
1000000
1500000
2000000
2500000
3000000
0
100000
200000
300000
400000
500000
600000
700000
0
100000
200000
300000
400000
500000
0
1000000
2000000
3000000
4000000
5000000
0
25000
50000
75000
100000
125000
150000
175000
0
250000
500000
750000
1000000
1250000
1500000
0 250 500 750
0 250 500 75
0
0 2500 5000 7500
0 250 500 750
0 250 500 750
0 250 500 750
0 250 500 750
Application
News
No.
C123
Table 1 Results of Validation Test for Simultaneous Analysis of Antiepileptic Drugs
Table 2 Analytical Conditions for Antiepileptic Drugs
Compounds
Range
(ng/mL)
QC samples concentration
(ng/mL)
Accuracy (%) % RSD (n=6)
LLOQ Medium ULOQ LLOQ Medium ULOQ LLOQ Medium ULOQ
Levetiracetam 10 - 750
10 100 750 94.6 106.1 99.2 3.42 1.23 1.98
Felbamate 25 - 1000 25 250 1000 98.6 101.8 99.6 6.28 1.88 1.50
Topiramate 500 - 10000 500 2500 10000 102.3 97.1 100.6 6.71 3.58 2.96
Carbamazepine-10, 11-epoxide 5 - 1000 5 100 1000 92.9 107.8 99.3 7.48 3.32 1.41
Carbamazepine 10 - 1000 10 100 1000 90.6 110.3 99.1 3.79 3.42 1.19
Tiagabine 50 - 1000 50 250 1000 98.5 101.9 99.6 1.95 2.00 1.26
Diazepam 5 - 1000 5 250 1000 98.1 102.4 99.5 4.61 1.50 1.53
Column : Inertsil ODS-4 (50 mm L. × 2.1 mm I.D., 2 μm)
Mobile Phase : A 10 mmol/L Ammonium acetate - Water
: B Methanol
Flowrate : 0.4 mL/min
Time Program : B. Conc. 3 % (0 - 0.5 min) - 90 % (3.0 - 5.0 min) - 3 % (5.01 - 7.0 min)
Column Temperature : 40 °C
Injection Volume : 1 μL
Probe Voltage : 4.5 kV / - 3.5 kV (ESI-positive / negative mode)
DL Temperature : 150 °C
Block Heater Temperature : 400 °C
Nebulizing Gas Flow : 3 L/min
Drying Gas Flow : 10 L/min
MRM Transition : Levetiracetam (+) m/z 171.15 > 126.10, Felbamate (+) m/z 239.20 > 117.00,
Carbamazepine-10,11-epoxide (+) m/z 253.15 > 180.05,
Carbamazepine (+) m/z 237.20 > 194.05, Tiagabine (+) m/z 376.25 > 111.05,
Diazepam (+) m/z 285.15 > 153.95, Topiramate (-) m/z 338.10 > 78.00
n
System Validation for Antiarrhythmic Drugs Analysis
TMD is used with a wide variety of drugs, and the
physicochemical properties of these drugs differ
individually. Therefore, confirming whether a given
series of standard operations, which includes the
process steps, tools, instruments and equipment used in
an analytical workflow, are appropriate for the target
drug is important for ensuring the analytical results
obtained are valid. We introduce an example validation
of sample preparation and analysis operations using
antiarrhythmic drugs with very different physicochemical
properties, and in particular very different hydrophilic
properties.
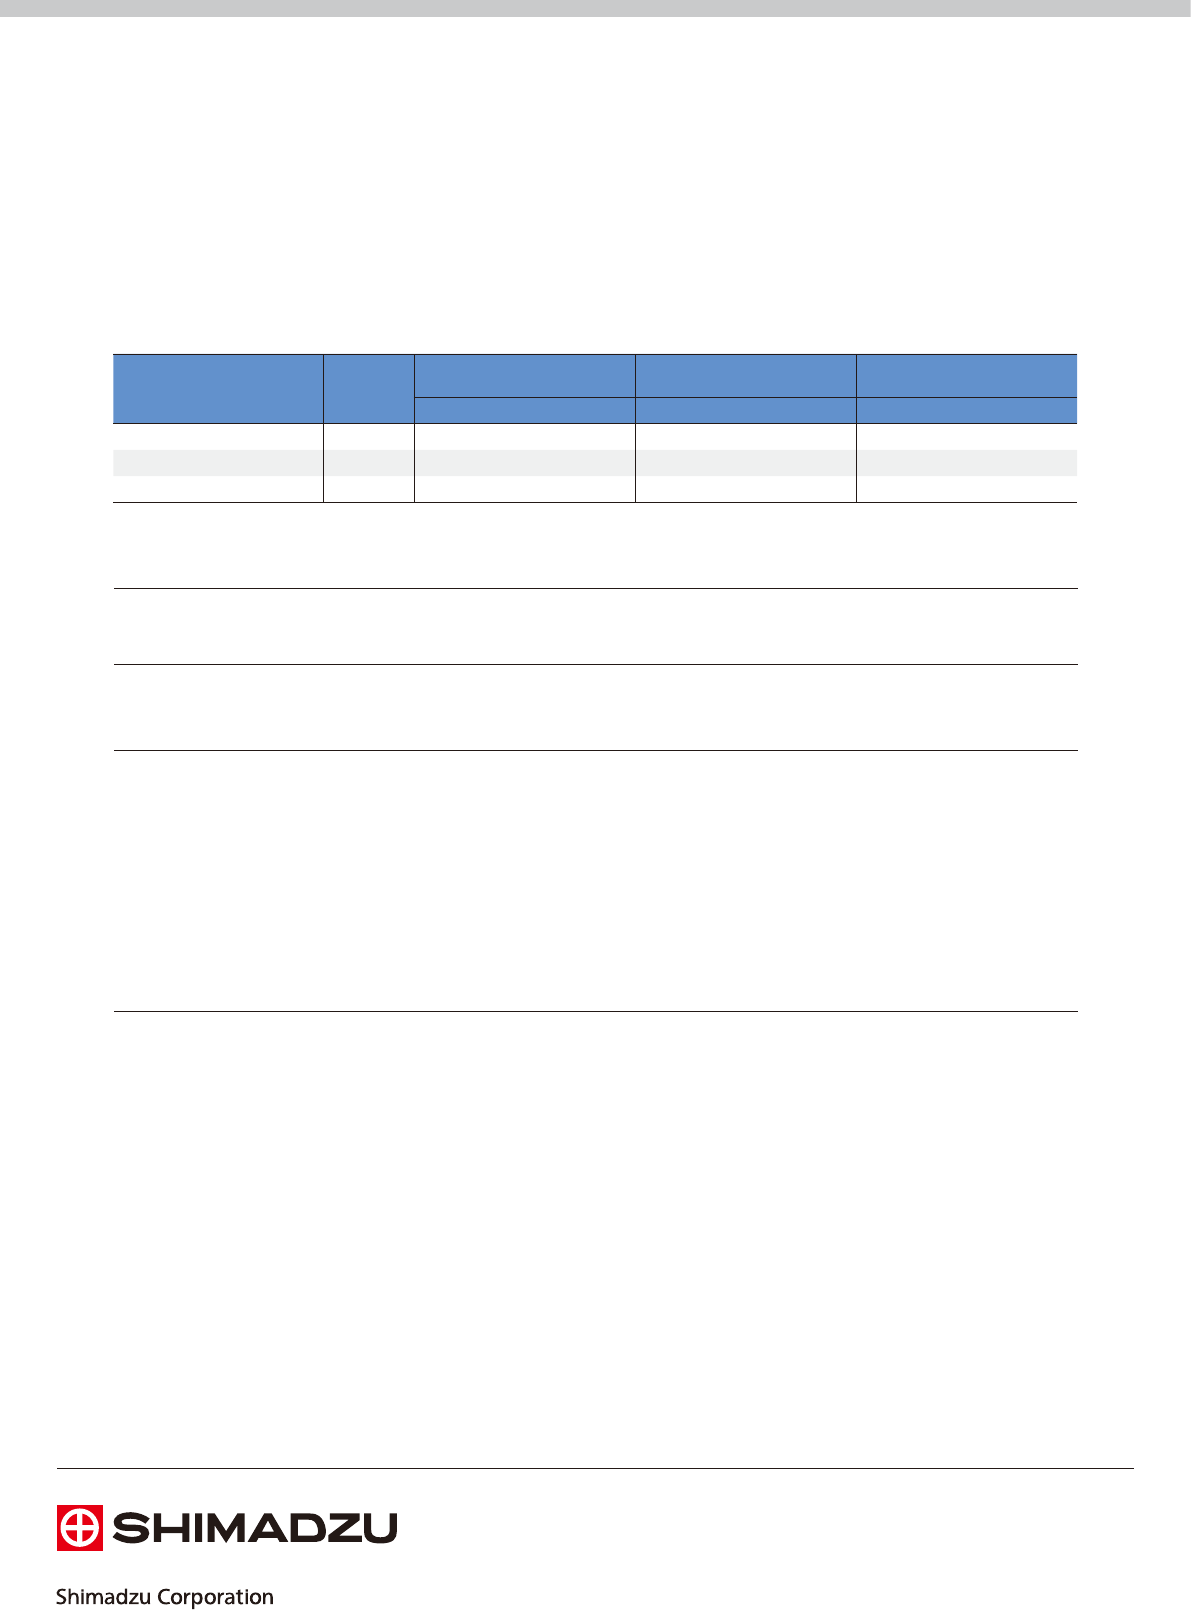
We chose the highly hydrophilic drug sotalol (partition
coefficient: log P=2.6342) and the highly hydrophobic
drug amiodarone (log P=6.9326) and its active
metabolite N-desethylamiodarone were chosen, and
performed simultaneous analysis using the fully
automated sample preparation LC/MS/MS system
(Fig. 4).
Fig. 4 Mass Chromatogram of Three Antiarrhythmic Drugs and Drug Metabolite in a Control Serum Sample
0.0 1.0 2.0 3.0 4.0 5.0 6.0 7.0 8.0 9.0 min
0.0
1.0
2.0
3.0
4.0
5.0
(× 100,000)
DEA 618.00 > 72.20 (+)
AMD 646.00 > 58.20 (+)
Sotalol 273.10 > 133.00 (+)
Sotalol
Amiodarone
N-Desethylamiodarone
S
HO
O
O
NH
NH
O
O
I
I
O
N
O
O
I
I
O
NH
Application
News
No.
For Research Use Only. Not for use in diagnostic procedures.
The content of this publication shall not be reproduced, altered or sold for any commercial purpose without the written approval of Shimadzu.
The information contained herein is provided to you "as is" without warranty of any kind including without limitation warranties as to its
accuracy or completeness. Shimadzu does not assume any responsibility or liability for any damage, whether direct or indirect, relating to the
use of this publication. This publication is based upon the information available to Shimadzu on or before the date of publication, and subject
to change without notice.
© Shimadzu Corporation, 2016
www.shimadzu.com/an/
C123
First Edition: Mar. 2016
Compounds
Range
(ng/mL)
QC samples concentration
(ng/mL)
Accuracy (%) % RSD (n=6)
LLOQ Medium High LLOQ Medium High LLOQ Medium High
Sotalol 100-5000 100 1000 2000 107.0 101.2 101.1 3.20 1.83 1.80
Amiodarone 100-5000 100 1000 2000 99.2 102.6 100.6 3.78 1.66 1.99
N-Desethylamiodarone 100-5000 100 1000 2000 101.2 103.3 100.1 4.22 1.48 3.01
n Conclusion
Calibration curves were prepared by continuous
analysis, then used to validate accuracy and precision
(repeatability). Good linearity was obtained across the
set calibration curve range for each of the highly
hydrophilic drug sotalol and the highly hydrophobic
drug amiodarone and its active metabolite
N-desethylamiodarone, with accuracy within
100 % ±15 % over the entire measurement range
Results indicate that the fully automated sample
preparation LC/MS/MS system can eliminate the risk of
error or variability introduced by manual sample
preparation that has been a problem for TDM, and also
indicate this system can implement a quick and high-
including the minimum limit of quantification. Similarly,
precision was measured at a %RSD of within 15 %,
showing that good repeatability was achieved (Table 3).
These results indicate that sample preparation and
analysis performed using the fully automated sample
preparation system is suitable for a wide range of
hydrophilic and hydrophobic drugs.
precision analytical workflow that is compatible with
drugs with a wide variety of physicochemical properties.
We anticipate the fully automated sample preparation
LC/MS/MS system will contribute to improved analytical
reliability and throughput in TDM.
Sample Volume : 50 μL
Reagent : Acetonitrile 200 μL
Shaking : 90 sec, 1900 rpm
Filtration : 150 sec
Column : Mastro C18 (100 mm L. × 2.1 mm I.D., 3 μm)
Mobile Phase : A 0.1 % Formic acid - Water
: B 0.1 % Formic acid - Methanol
Flowrate : 0.4 mL/min
Time Program :
B. Conc. 5 % (0 - 1.5 min) - 100 % (5.5 - 7.5 min) - 5 % (7.51 - 10 min)
Column Temperature : 40 °C
Injection Volume : 0.3 μL
Probe Voltage : 4.5 kV (ESI-positive mode)
DL Temperature : 250 °C
Block Heater Temperature : 400 °C
Nebulizing Gas Flow : 3 L/min
Drying Gas Flow : 15 L/min
MRM Transition : Sotalol (+) m/z 273.1 > 133.0,
Amiodarone (+) m/z 646.0 > 58.2,
N-Desethylamiodarone (+) m/z 618.0 > 72.2
Table 3 Results of Validation Test for Simultaneous Analysis of Antiarrhythmic Drugs
Table 4 Preparation Conditions for Antiarrhythmic Drugs
Table 5 Analytical Conditions for Antiarrhythmic Drugs
<Acknowledgments>
This research was performed with considerable help from Dr. Takeshi Kuwahara of the Pharmacy Department, National
Cerebral and Cardiovascular Center in Japan.
[References]
1) Guidance for Industry: Bioanalytical Method Validation (2001, US FDA)
2) Guideline on Bioanalytical Method Validation in Pharmaceutical Development (Japan's MHLW, 2013)
Notes
•Theproductsmentionedinthisarticlehavenotbeenapproved/certiedasmedicaldevicesaccordingtothePharmaceuticalandMedicalDeviceAct
in Japan.
•Theanalyticalmethodsmentionedinthisarticlecannotbeusedfordiagnosticpurposes.