13紫外可见分光光度计UV-1900i Plus (1).pdf - 第6页
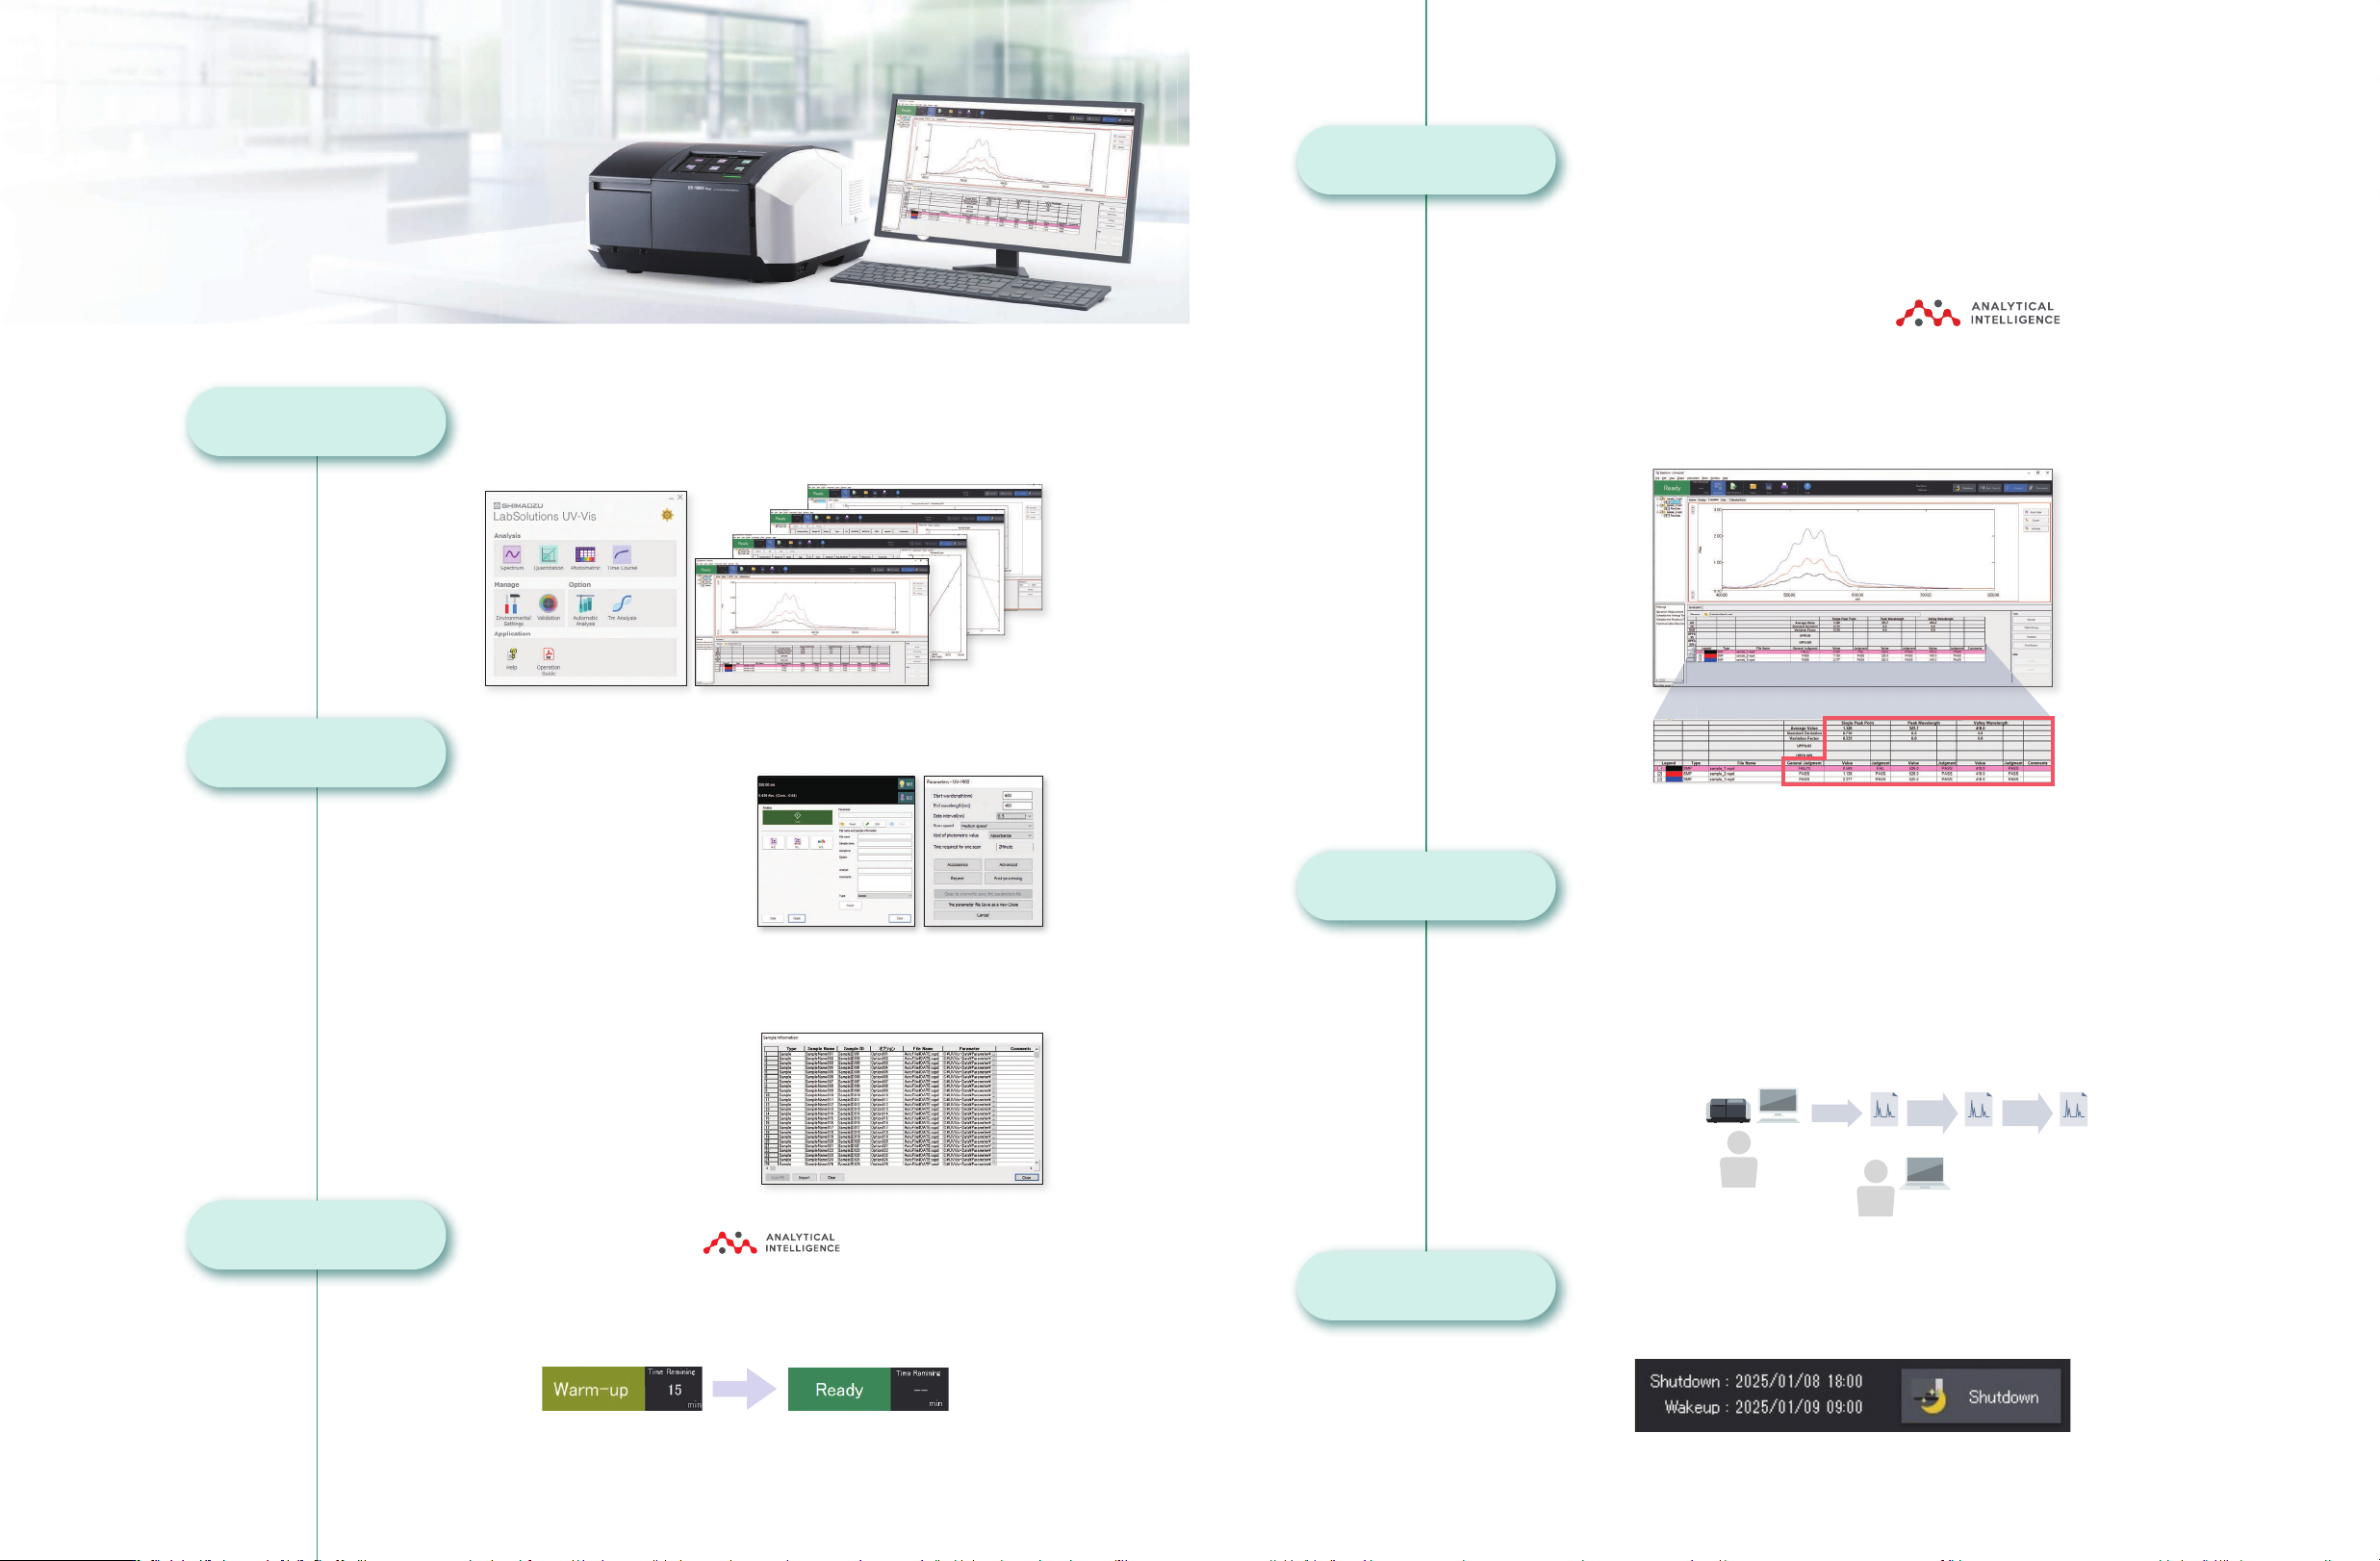
10 1 1 10 设备启动 参数设置 仪器检查 智能助手* 预热 预热完成 LabSolutions UV-Vis 软件 高效便捷的分析平台 遵循ER/ES法规实现强大的数据管理 Di f fere n t meas u r e m e nt a pplications can be started from the application launche r . Exte n sive UV validation software …
8 9
Note: One method of determining the
lowerlimit of quantitation is to use ten
times the standard deviation. This is an
actual measured value and is not
guaranteed.
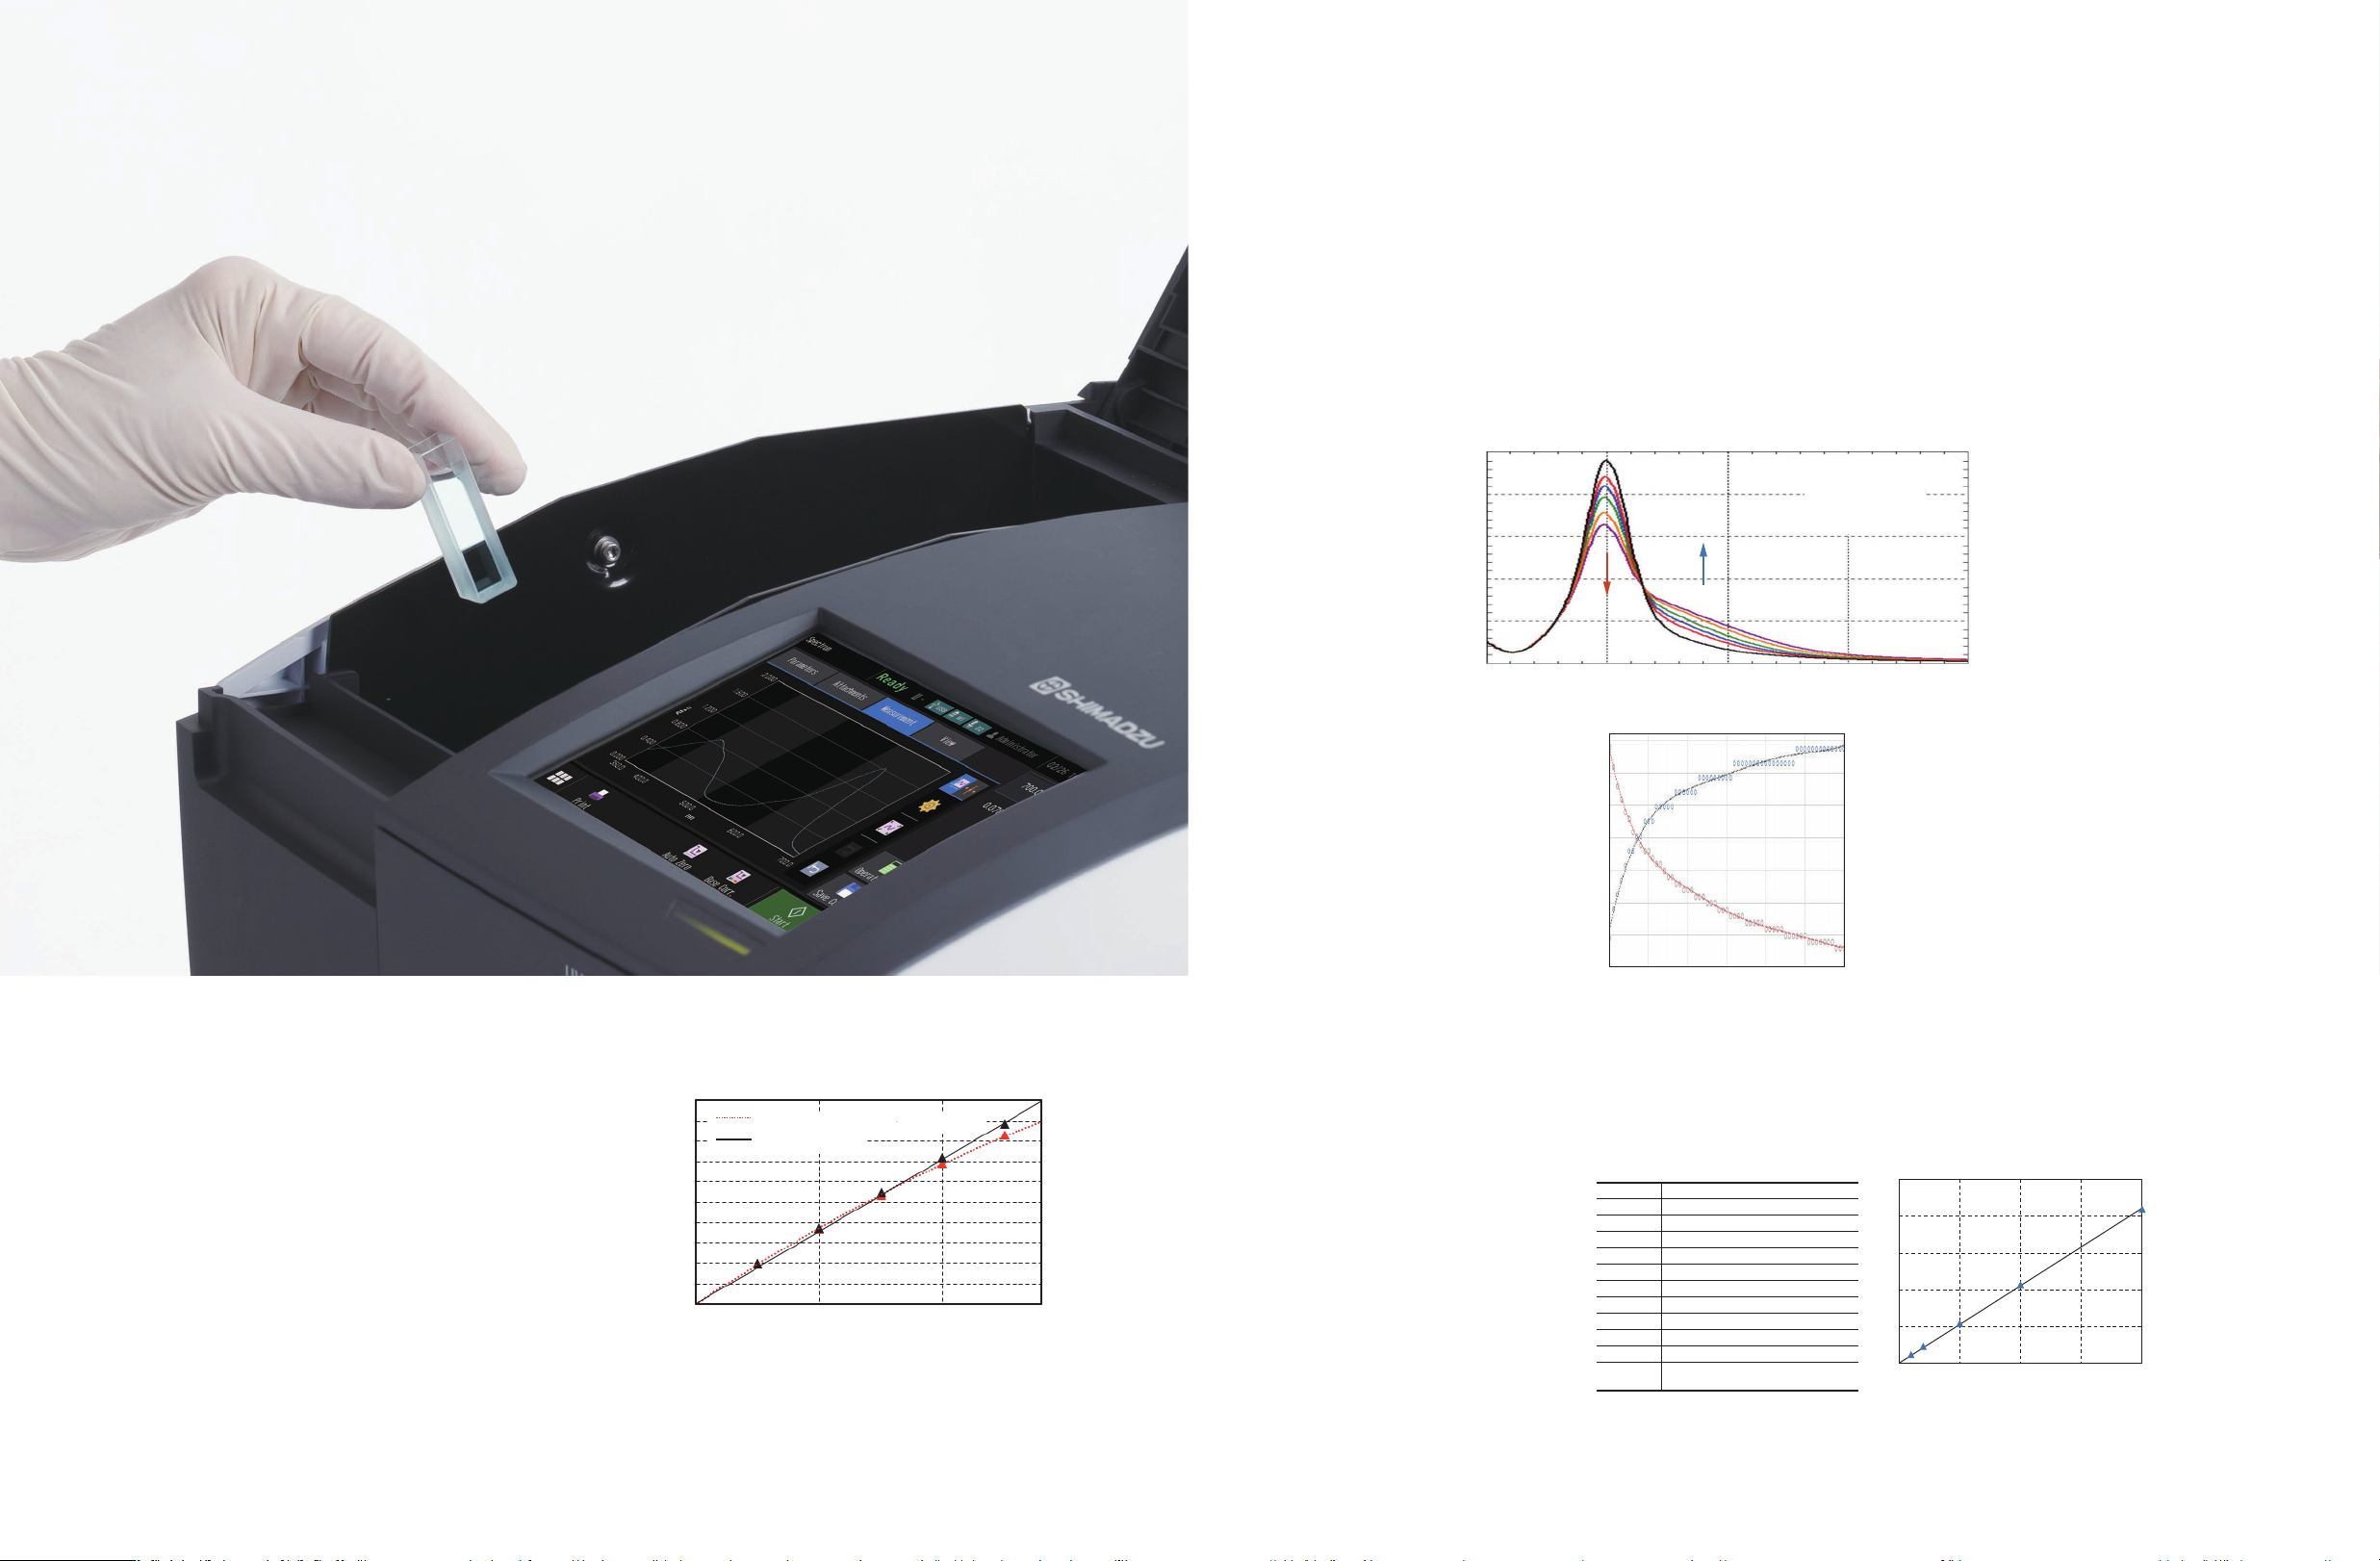
低杂散光
High Reproducibility and Repeatability Accuracy
The photometric repeatability accuracy is 0.0002 Abs max. (0.5 Abs and 1.0 Abs). As a result, variance in the
measurement results is suppressed, enabling more accurate quantitation and the detection of low-concentration
samples.
No.
1
2
3
4
5
6
7
8
9
10
Standard
Deviation σ
Absorbance of Blank Solution (273 nm)
-0.00001
0.00001
-0.00002
0.00002
0.00001
-0.00003
0.00001
-0.00004
0.00001
0.00005
0.000025
2.5
2.0
1.5
1.0
0.5
0.0
Calibration Curve
Conc. (mg/L)
Abs.
0.0 10.0 20.0 30.0 40.0
The figure on the right is a calibration
curve for caffeine, created with
absorbance at 273 nm. The calibration
curve has an Abs = 0.0528 Conc.
The lower limit of quantitation
determined from the standard
deviation is 0.0051 mg/L.
Ultra-Fast Scan
Spectra can be acquired as fast as 29,000 nm/min. Ultra-fast scanning is effective for tracking chemical reactions in a
short time. In addition to the absorbance change at specified wavelengths, spectra can be acquired in a
short time with the UV-1900i Plus. Therefore, more detailed behavior can be investigated by observing spectra
with the UV-1900i Plus.
The figures below show the analysis of the particle agglomeration process when salts are added to silver
nanoparticles. Measurements of the 300 to 700 nm region were performed in ultra-fast scan mode. In addition
to the decrease of absorbance at 400 nm and the increase of absorbance at 480 nm, the temporal changes of
spectra can be observed.
高性能满足多样化的需求
1.0
0.8
0.6
0.4
0.2
0.0
0.97
0.92
0.87
0.77
0.72
0.67
0.62
0.23
0.21
0.19
0.17
0.15
0.13
0.11
0.09
0.07
Abs.
Absorbance at 400 nm (Abs)
Absorbance at 480 nm (Abs)
nm
300.0 400.0 500.0 600.0 700.0
480 nm
400 nm
0 100 200 300
Time (sec)
Temporal Changes of Absorbance at 400 and 480 nm
Absorption Spectra of Silver Nanoparticles
400 500 600
Black: after 0 min
Red: after 0.5 min
Blue: after 1 min
Green: after 2 min
Orange: after 5 min
Purple: after 10 min
Calibration Curve
Conc. (mg/mL)
2.00
1.80
1.60
1.40
1.20
1.00
0.80
0.60
0.40
0.20
0.00
Abs.
2.001.000.00
Instrument with 1.00 % Stray Light
UV-1900 series
9
Low Stray Light
高光度重现性
编号
1
2
3
4
5
6
7
8
9
10
标准偏差σ
空白溶液吸光度(273 nm)
-0.00001
0.00001
-0.00002
0.00002
0.00001
-0.00003
0.00001
-0.00004
0.00001
0.00005
0.000025
2.5
2.0
1.5
1.0
0.5
0.0
标准曲线
浓度(mg/L)
Abs.
0.0 10.0 20.0 30.0 40.0
Linearity will be lost in the high absorbance region due
to stray light. UV-1900 series is equipped with Low Stray
Light Diffraction Gratings, achieve “best-in-class” low
stray light. Stray light is at 0.5 % max. (198 nm), making
accurate measurements possible at 1 Abs or more, even
in the ultraviolet region. In addition, high-concentration
samples can be quantified accurately.
The figure on the right is a calibration curve for acetic
acid, created with absorbance at 200 nm. The correlation
coefficient is 0.9998 and correct measured values are
obtained even with high-concentration samples.
超快速扫描
High Performance to Meet Diverse Needs
1.0
0.8
0.6
0.4
0.2
0.0
0.97
0.92
0.87
0.77
0.72
0.67
0.62
0.23
0.21
0.19
0.17
0.15
0.13
0.11
0.09
0.07
Abs.
吸光度(Abs)
吸光度 (Abs)
nm
300.0 400.0 500.0 600.0 700.0
480 nm
400 nm
0 100 200 300
Time (sec)
吸光度的动力学改变(400nm及480nm处)
银纳米粒子的吸收光谱
400 500 600
黑线: 0 min
红线: 0.5 min后
蓝线: 1 min后
绿线: 2 min后
橙线: 5 min后
紫线: 10 min后
Calibration Curve
Conc. (mg/mL)
2.00
1.80
1.60
1.40
1.20
1.00
0.80
0.60
0.40
0.20
0.00
Abs.
2.001.000.00
Instrument with 1.00 % Stray Light
UV-1900 series
8
由于杂散光影响,高吸光度区域不符合线性关
系。UV-1900 系列配备LO-RAY-LIGH衍射光栅,
实现了 “同级别” 的低杂散光。杂散光为 0.5%
(198 nm),即使在紫外区域,也能够在吸光
度为 1 及以上时进行精确测量。此外,还能对高
浓度样品进行准确的定量分析。
右图是根据乙酸在 200 nm处的吸光度绘制的校
准曲线。相关系数为 0.9998,即使是高浓度的
样品也能获得准确的测量值。
光谱的测量速度可以达到29,000nm/min。超快扫描可以在短时间内追踪化学反应过程。除了在特定波长处监测
吸光度的变化以外,UV-1900i Plus可以在短时间内获取全光谱数据。因此,可通过UV-1900i Plus测试的光谱,对
更详细的动力学行为进行研究。
下图例子显示将无机盐加入到银纳米颗粒时的粒子聚集过程分析。300-700nm的光谱采用超快模式进行扫描。除了
可以看到400nm处吸光度的降低以及480nm处吸光度的升高以外,还可测量得到整个光谱的动力学变化过程。
光度重现性为0.0002 Abs(0.5 Abs 和 1.0 Abs),如此高的光度重复性,可降低测量结果差异,同时更准确地定量
并检测低浓度样品。
右图是咖啡因的校准曲线,在
273nm处产生的吸光度。校准
曲线Abs=0.0528浓度,标准偏
差为0.0051 mg/L。
备注:测定定量下限的一种方法是使用10倍标准偏
差。这是一个真实测量值,而不是保证值。
10
11
10
设备启动
参数设置
仪器检查
智能助手*
预热 预热完成
LabSolutions UV-Vis 软件
高效便捷的分析平台
遵循ER/ES法规实现强大的数据管理
Different measurement applications can be started from the application
launcher. Extensive UV validation software programs supporting
instrument performance checks as well as optional software programs for
special analyses are also available, so various measurements can be
intuitively performed.
Startup
Setting Parameters
Instrument Check
Instrument parameter settings can
be specified via panels that are
separate from the measurement
window. The control panels
include various functionality that
is laid out for superior visibility.
Each measurement window
connects seamlessly to the
corresponding parameter settings
window.
Instrument Control Panel
Four Measurement Mode Windows
Warming up Warm-up complete
LabSolutions
™
UV-Vis Software
Enables Compliance with ER/ES Regulations and
Stronger Data Management
10
软件布局直观简洁,不同测定模式一键启动。提供功能强大的UV验证软件
轻松完成仪器性能检测,配备不同的应用程序包支持特定分析需求。因
此,各类测量操作皆可轻松上手,直观便捷。
四种测量模式窗口
仪器控制面板
预设(光谱和时间扫描)
仪器参数设置,在独立于测量窗
口的面板设定。不同控制面板对
应不同功能,布局清晰,用户使
用得心应手。每一个测量窗口与
对应的参数设置窗口无缝连接,快
速实现不同测量模式的参数设置。
当测定多种样品时,可以提前设定
参数信息。
*此功能可选择是否开启
仪器是否完成预热,用户一目了然。若未进行基线校正,系统会发出提醒
辅助用户轻松准确完成分析操作。
从测定到数据输出
数据管理
休眠
数据分析操作的改善
自动光谱评价(光谱评价功能)
在数据测试时可以同步进行数据分析和数据输出的操作。这样可以减少额外进行数据分
析和数据输出的时间,数据能实时输出为一个Excel表,或者是保存成文本格式。软件
能够自动进行测试数据的后处理,比如处理/校正光谱,执行通过/失败的测试结果的判
断(自动数据评价功能)。
通过不同评价标准的设定,可以实现对测试结果的自动光谱评估。
在报告生成窗口中,报告可以通过一个事先指定好的格式输出或者基于不同的参数、数
据和元素进行自由排版后输出。
更强的数据管理功能
除了在PC文件夹中常规的文件管理功能外,通过选配LabSolutions DB/CS UV-Vis软件,
可以实现在数据库中保存数据,以提高数据的安全性并遵循ER/ES相关法规规定。
可选软件:LabSolutions DB UV-Vis LabSolutions CS UV-Vis
数据库管理
通过数据库进行数据管理可以阻止分析数据被删除和被覆盖的操作。此外,进行数据
处理时,数据会相应标上版本号,所以无需担心原始数据会被覆盖掉。
Ver. 1 Ver. 2 Ver. 3
减少操作者的失误
解析 再解析 再解析
休眠/唤醒功能
UV-1900i Plus也可以通过软件使用休眠功能,仪器会依据LabSolutions UV-Vis的设定自动
休眠或唤醒。长时间测量结束后,仪器与软件便自动休眠。
12 13
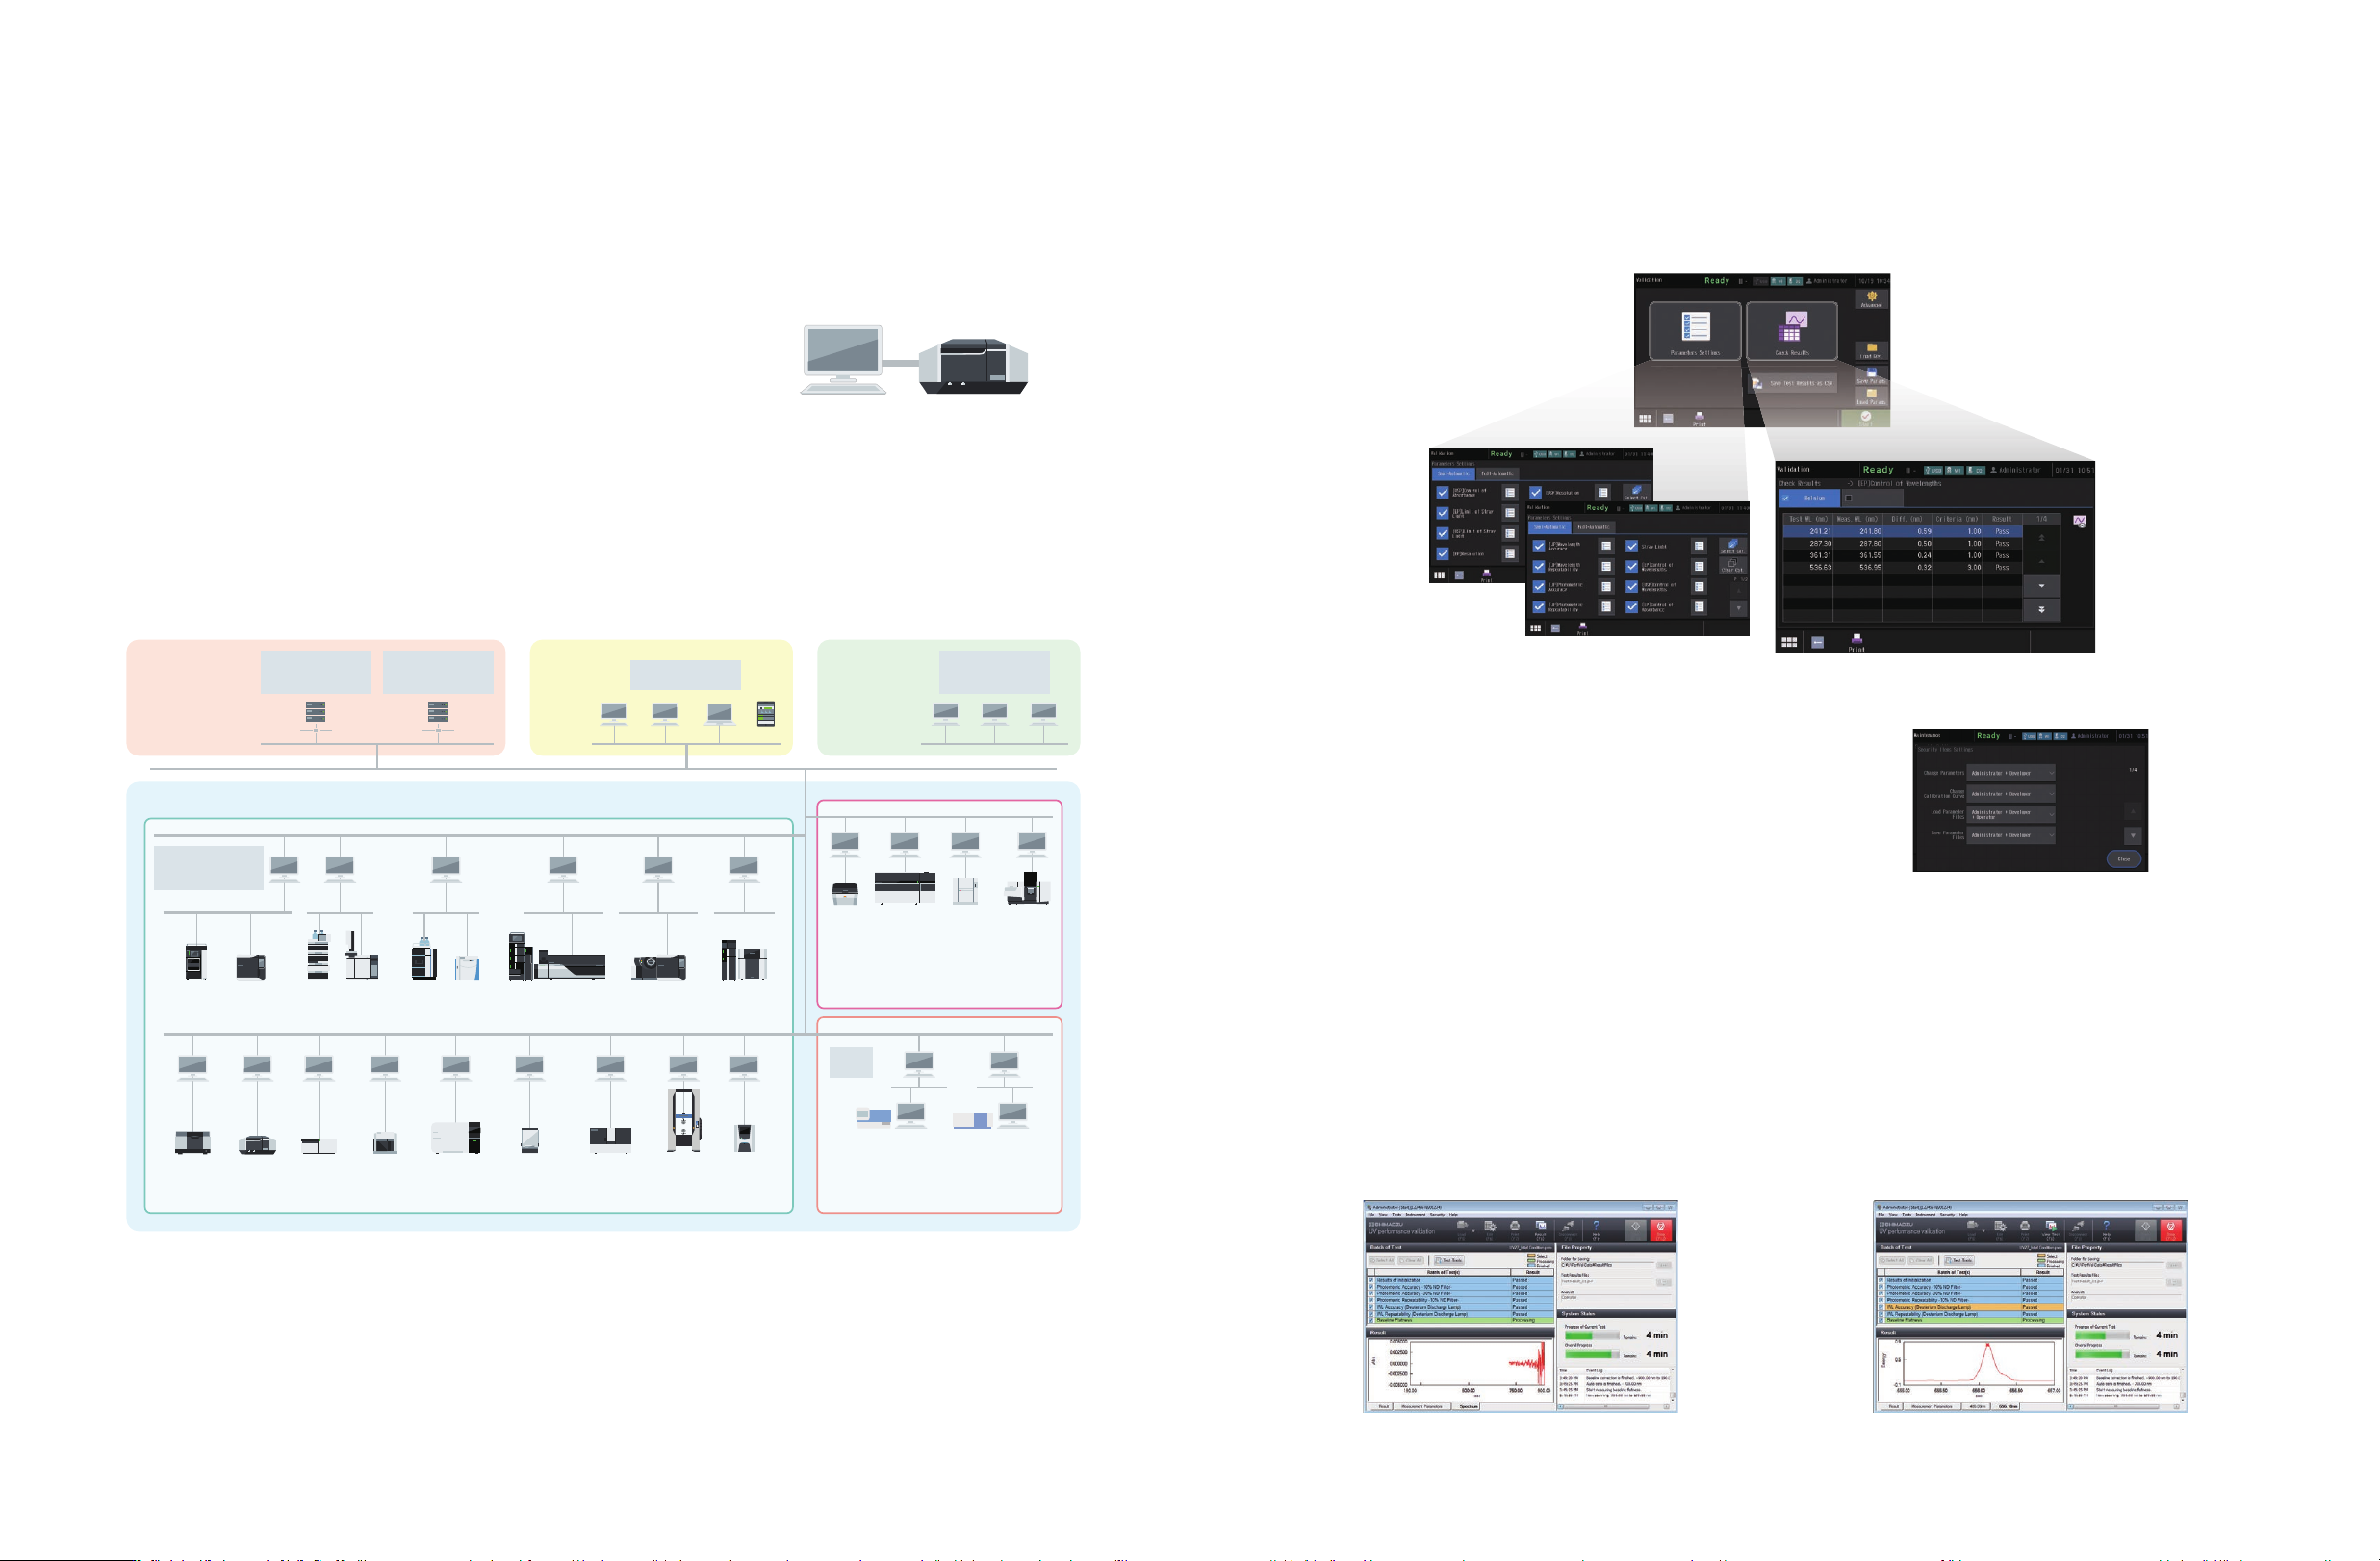
可靠的LabSolutions软件
1nm的分辨率,同类产品中的高分辨率
仪器验证功能符合JP、USP和EP要求(触控屏展示)
可与PC软件兼容的验证功能
参数设置界面
检查结果界面
主屏幕
改善安全功能
LabSolutions DB UV-Vis
LabSolutions CS UV-Vis
云数据
中心机房
*4
LabSolutions
服务器
终端
服务器
*2
办公室
客户端 PC
部门办公室
远程工作
终端客户PC
*3
分析实验室
采集控制PC
*1
LC GC
Agilent LC,
GC Thermo LC,
GC
LCMS GCMS PPSQ
™
FTIR UV RF
TA ICPMS Balance Particle Size
Analyzer
AG
TOC-L
EDX ICPE TOC-V AA
结合多数据登录授权能够整合这些
仪器数据及客户信息
结合能够整合这些仪器数据及客户
信息能够整合仪器管理
A instrument B instrument
PC
LabSolutions DB UV-Vis 软件将数据管理功能与 LabSolutions UV-Vis 完美
融合,实现安全无忧的数据管理!软件符合 ER/ES 法规要求,是使用电脑
操作客户的优先选择。推荐给无需网络连接,同时要遵循ER/ES 法规要求
的用户。
通过使用LabSolutions CS,由服务器统一管理所有数据。此方案适用于用户规模庞大、需依托数据库管理数据,并需要遵循
ER/ES法规的机构。
*1. 采集控制PC用于控制分析仪器。
*2. 终端服务器是专用于提供终端服务的服务器设备。用户可通过终端服务查看数据报告并执行电子签名操作。由于网络负载较低,该方案非常适用于远程连接场景。目前仅液相色谱仪(LC)、
气相色谱仪(GC)、液相色谱-质谱联用仪(LCMS)和气相色谱-质谱联用仪(GCMS)支持通过终端服务执行分析操作及再解析。
*3. 使用终端服务时,不需要在客户端PC上安装LabSolutions软件。
*4. 服务器可部署于多种云平台上(基础设施即服务,IaaS),如亚马逊云科技(AWS,Amazon Web Services)、Microsoft® Azure®微软云计算以及GCP™(Google Cloud Platform™)。
除了提供基本功能的LabSolutions UV-Vis外,岛津还提供LabSolutions DB UV-Vis和LabSolutions CS UV-Vis,以满足
ER/ES法规的要求。
该仪器不仅可对日本工业标准(JIS)9个项目实施检查,还可以按照日本药典(JP)、美国药典(USP)和欧洲药
典(EP)的规定实施检查。自然地,硬件也均符合各药典要求的规格。另外,可保存检查条件。检查条件一经保
存,仅需根据需求,调用这些保存条件就可轻松执行检查。同样可保存检查结果。
增加了外部控制安全功能,可以提高对法规合规性的支持。为仪器用户
提供三个权限级别设置,即“管理员”、“开发人员”和“操作员”。
除了采用Czerny-Turner结构的单色器实现了1nm分辨率之外,UV-1900i Plus还具有结构紧凑、高光通量的光学系
统。该仪器可以超水平的满足USP和EP对于波长分辨率的要求。
用户可以选择仪器性能验证指示窗口的法规,如JIS K0115法规,进行吸收光谱法的分析。其他法规也可供选择。
• 检查结果不仅可以打印出来,而且能保存成为文件,如有需要可调出此文件进行二次确认。
• 检查所设置的参数也能保存成单独的文件,可以调用出来用于周期性和日常的检查。