LCMS_010.pdf - 第8页
8 ② ③ ① ② ③ “Calib. Levels” 校准 点数: 配制的 标准溶 液浓度 个数, 如: 5 个点, 可 修改。 其 他取默 认值。 “Units” (单 位): 输 入合适 单位, 例如: mg/L。 Integration Identification Quantitative Compounds Quantitative Method: Internal Standard | Calculated By: @ A…
7
①
①②
③
②
③
①
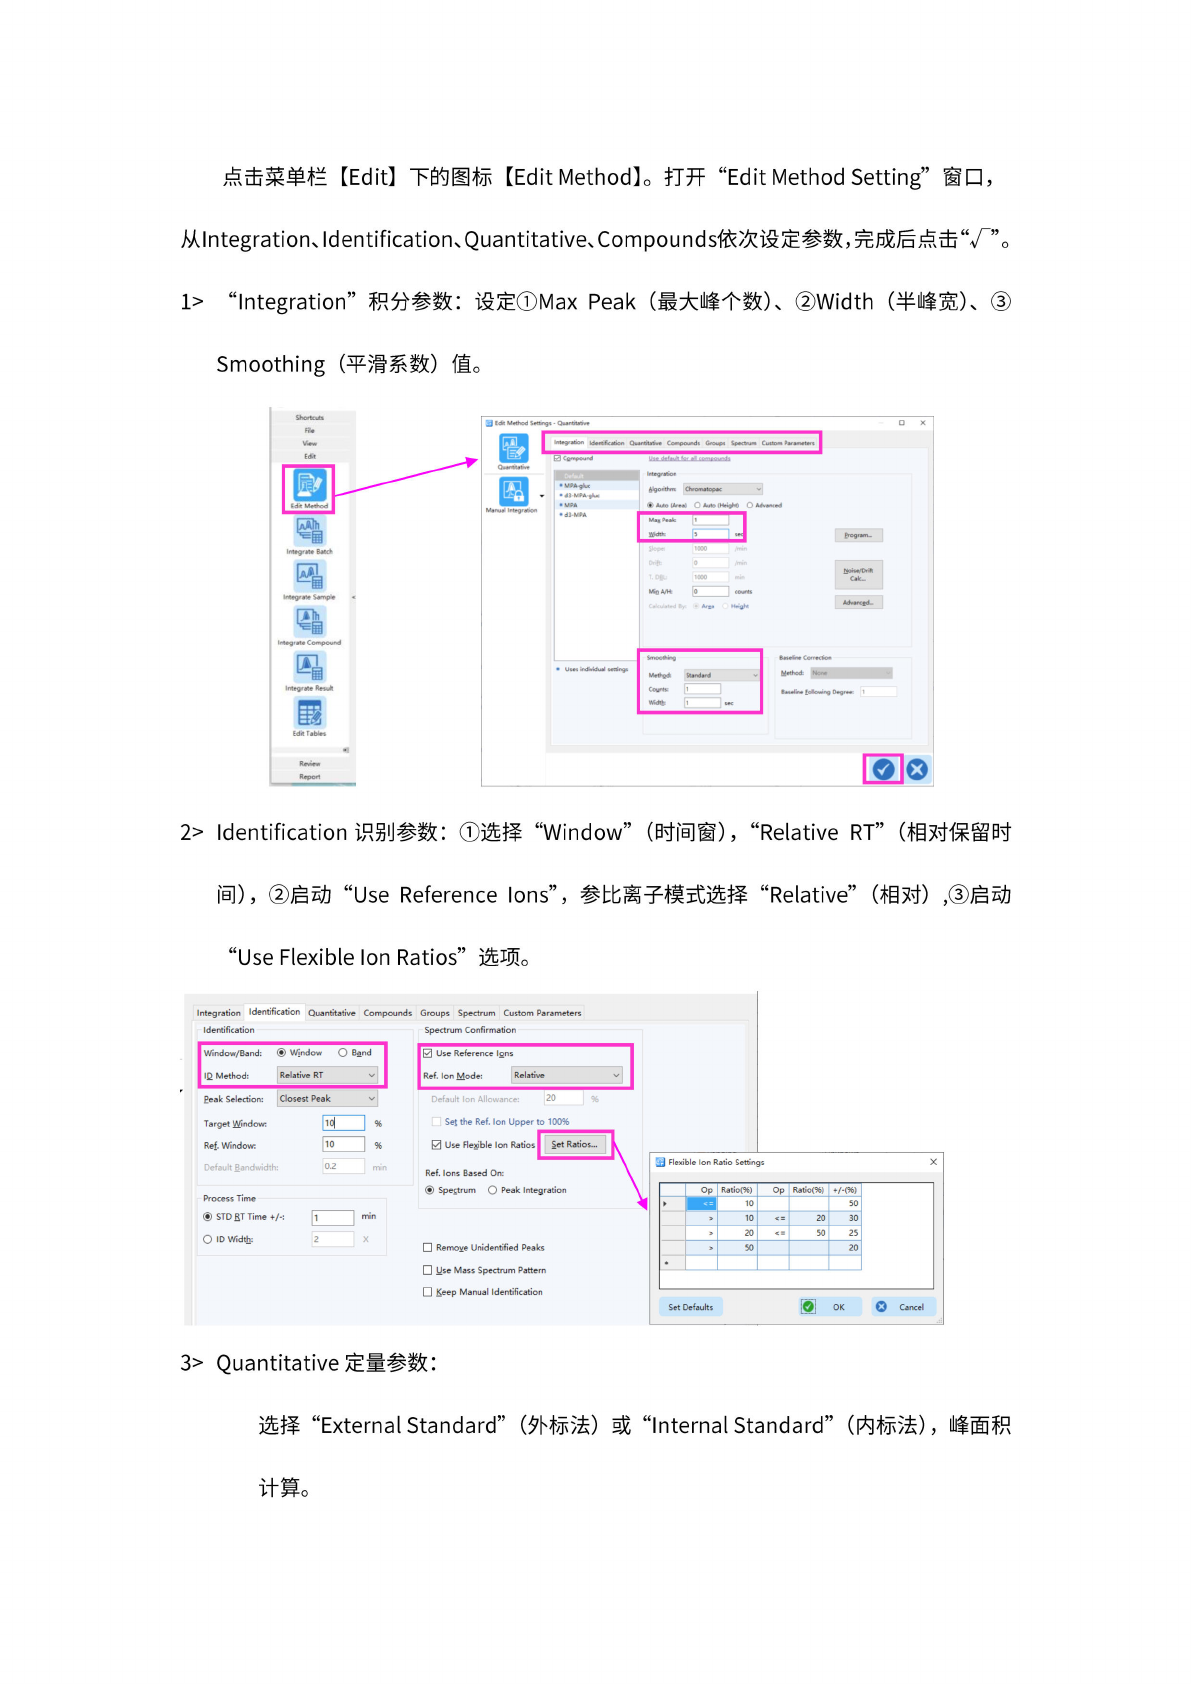
点击
菜单栏
[Edit]
下
的图标
【
Edit
Method】。
打开
"Edit
Method
Setting"
窗口,
从
Integration、
Identification、
Quantitative、
Compounds
依次设
定参数
,完成
后点击
“丁”。
1>
“Integration”
积分
参数:
设定①
Max
Peak
(最
大峰个
数)、
Width
(半峰
宽)、
Smoothing
(平滑
系数)
值。
Shortcuts
Hie
View
Integrate
Result
霰
Edit
Tabies
Review
Report
2>
Identification
识另
1
」
参数:
“Window”
(时间
窗),
“Relative
RT”
(相对
保留时
间),
“Use
Reference
Ions”,
参比
离子模
式选择
“Relative”
(相
对),
“Use
Flexible
Ion
Ratios”
选项。
Integration
Identification
Quantitative
Compounds
Groups
Spectrum
Custom
Parameters
Identification
Window/Band:
©
Window
O
Band
ID
Method:
Relative
RT
Peak
Selection:
Closest
Peak
Target
Window:
—
|
%
Ref.
Window:
10
%
Default
Bandwidth
0.2
|
n
Process
Time
您
STD
RT
Time
+/-:
O
ID
Width:
Spectrum
Confirmation
0
Use
Reference
Ions
Ref.
Ion
Mode:
Relative
20
Set
the
Ref.
Ion
Upper
to
100%
0
Use
Flexible
Ion
Ratios
I
Set
Ratios...
Ref.
Ions
Based
On:
@
Spectrum
O
Peak
Integration
Remove
Unidentified
Peaks
Use
Mass
Spectrum
Pattern
Keep
Manual
Identification
国
Flexible
Ion
Ratio
Settings
X
O
Cancel
Set
Defaults
OK
Op
Ratio(%)
Op
Ratio(%)
+/-(%)
10
50
>
10
<
=
20
30
>
20
V
=
50
25
>
50
20
3>
Quantitative
定量
参数:
选择
“External
Standard”
(外
标法)
或
“Internal
Standard”
(内标
法),
峰面积
计算。
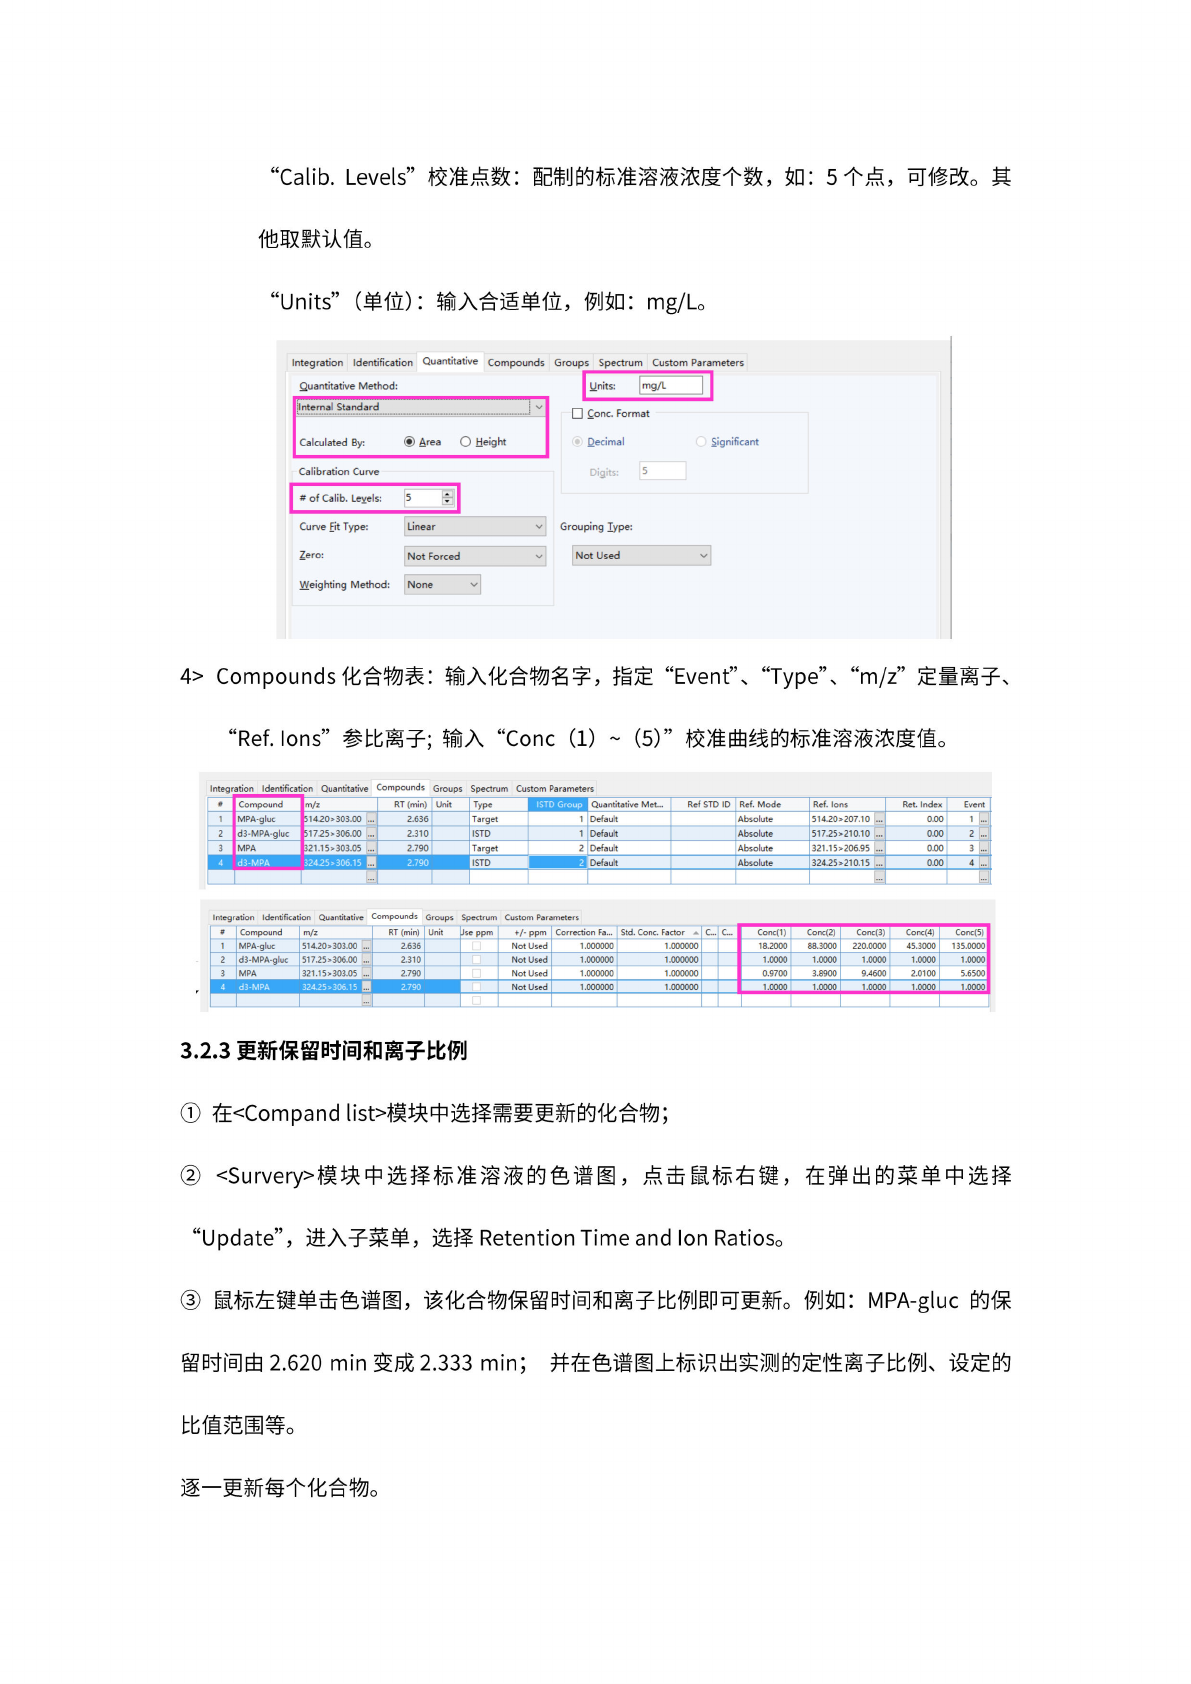
8
②
③
①
②
③
“Calib.
Levels”
校准
点数:
配制的
标准溶
液浓度
个数,
如:
5
个点,
可
修改。
其
他取默
认值。
“Units”
(单
位):
输
入合适
单位,
例如:
mg/L。
Integration
Identification
Quantitative
Compounds
Quantitative
Method:
Internal
Standard
|
Calculated
By:
@
Area
O
Height
Calibration
Curve
#
of
Calib.
Levels:
5
Weighting
Method:
None
Curve
Fit
Type:
Linear
Zero:
Not
Forced
Groups
Spectrum
Custom
Parameters
Cone.
Format
Decimal
0
Significant
Digits:
5
Grouping
Type:
Not
Used
v
4>
Compounds
化合
物表:
输入
化合物
名字,
指定
“Event"、
“Type"、
“m/z”
定量
离子、
“Ref.lons”
参比
离子;
输入
“Cone
(1)
(5)”
校
准曲线
的标准
溶液浓
度值。
Integration
Identification
Quantitative
Compounds
Groups
Spectrum
Custom
Parameters
#
Compound
m/z
RT
(min)
Unit
Type
ISTD
Group
Quantitative
Met...
Ref
STD
ID
Ref.
Mode
Ref.
Ions
Ret.
Index
Event
1
MPA-gluc
514.20>303.00
2.636
Target
1
Default
Absolute
514.20>207.10
...
0.00
1
2
d3-MPA-gluc
51
7.25
>306.00
•
••
2.310
ISTD
1
Default
Absolute
517.25>210.10
•
••
0.00
2
3
MPA
321.15>3O3.O5
•
••
2.790
Target
2
Default
Absolute
321.15>206.95
•
••
0.00
3
I
4
d3-MPA
324.25
>306.1
5
B
2.790
ISTD
2
Default
Absolute
324.25>210.15
0.00
4
...
£
…]
Integration
Identification
Quantitative
Compounds
Groups
Spectrum
Custom
Parameters
#
Compound
m/z
RT
(min)
Unit
Jse
ppm
+/-
PPm
Correction
Fa...
Std.
Cone.
Factor
c...
Q..
Cone
Conc(2) Conc(3) Conc(4) Conc(5)
1
MPA-gluc
514.20>
303.00
•••
2.636
Not
Used
1.000000 1.000000
18.2000
88.3000
220.0000
45.3000
135.0000
2
d3-MPA-gluc
51
7.25
>306.00
•
••
2.310
Not
Used
1.000000 1.000000
1.0000 1.0000
1.0000 1.0000 1.0000
3
MPA
321.1
5
>303.05
2.790
Not
Used
1.000000 1.000000
0.9700
3.8900
9.4600
2.0100
5.6500
I
4
d3-MPA
324.25
>306.1
5
•
••
2.790
Not
Used
1.000000 1.000000
1.0000 1.0000 1.0000 1.0000 1.0000
•
••
3.2.3
更新
保留时
间和离
子比例
在
yCompand
lista
模块
中选择
需要更
新的化
合物;
vsurvery>
模
块中选
择标准
溶液的
色谱图
,点
击鼠标
右键,
在弹出
的菜单
中选择
“Update”,
进入子
菜单,
选择
Retention
Time
and
Ion
Ratios。
鼠
标左键
单击色
谱图,
该化合
物保留
时间和
离子比
例即可
更新。
例如:
MPA-gluc
的保
留
时间由
2.620
min
变成
2.333
min;
并
在色谱
图上标
识出实
测的定
性离子
比例、
设定的
比值范
围等。
逐
一更新
每个化
合物。
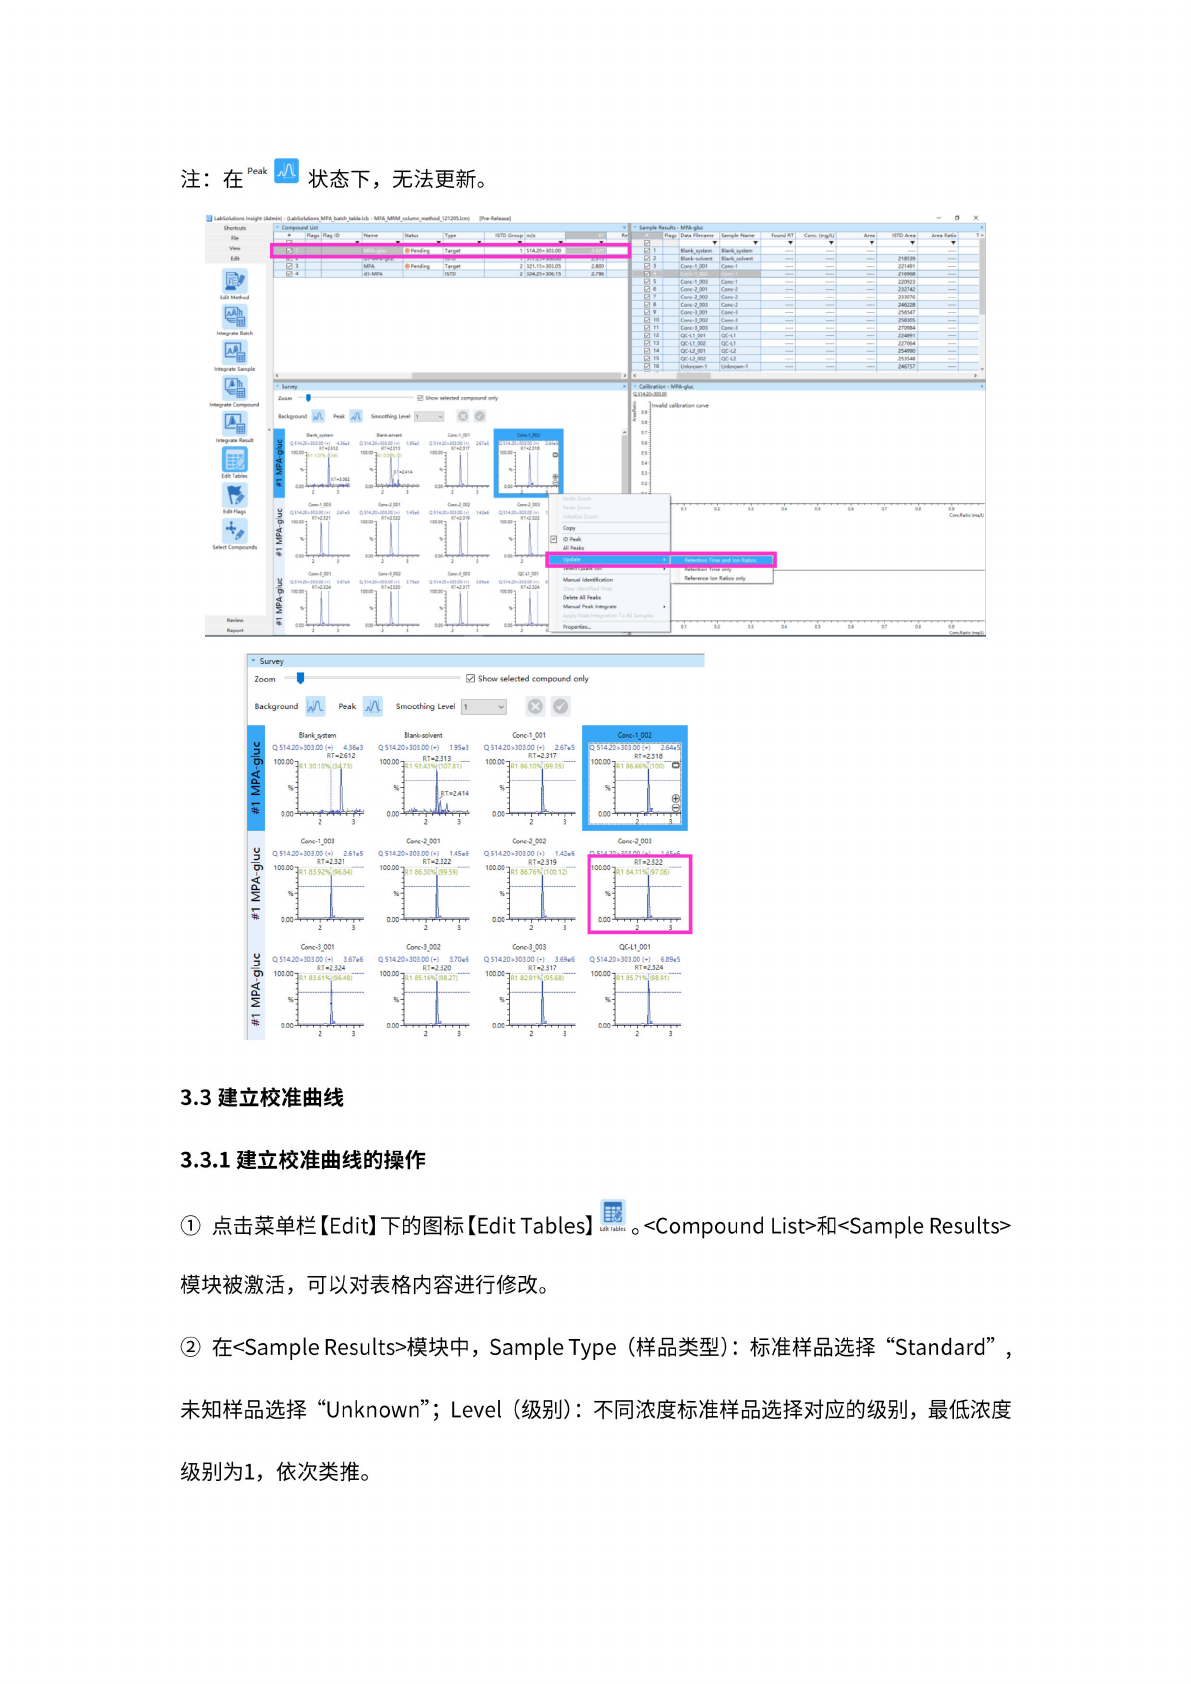
9
①
②
①
③
①
色谱图显示:
1.实测的定性离子比例;
2. 实测值与设定值的匹配度;
3. 设定的定性离子比值范围。
注:
在
状
态下,
无法
更新。
220921
212742
23JO76
2*6228
2X547
25825
27OW4
224W1
«70M
2M990
25n
4«
246757
Conc・1JX»
Conc-2"001
Conc2003
Cone
•仙
1
Conc-3.0W
CofttiJXB
QC-lljp]
qc-iCoo?
QCUJXH
QCU^pOZ
Unknown
1
Peak
»
UbSohAont
ImieM
(Adminl
(UbSolu6on*_MPA_bMch_Ubl»Jcb
MPA_MRM_column_mMhod_l
2120SJcm)
[Pr.
Shortcut*
'
Convok'd
5
%
•
Hags
尸“
ID
7ame
Statue
Type
l$TO
Group
I
•
S
・m*
RetUts
“PA
叱
Data
Rename
hxrxi
RT
Corc<m^tJ
Are*
iSTDArea
E
0
1
Bl«nk
system
0
2
Bl«nk-$ok*«t
***•
21»»
0
团
3
Cone-
1.001
Ce-1
221491
If
——
216968
Aze*
Ratio
Ji
Survey
Zoom
0
Show
selected
compound
only
Background
j\J\.
Peak
Smoothing
Level
1
v
Blank_system
Blank-solvent
Q
51420>303.00
(*)
4.36e3
Conc-1
003
Conc-2
001
Q51420>303.00(+)
2.61
e5
Q
51420>303.00
(+)
1.42e6
Q
51420>303.00
(♦)
1.45e6
RT=2.322
3A5
AA
,八
Conc-3_00[
Q51420>303.00(+)
3.67e6
Conc-3_002
Q
51420>303.00
(♦)
3.70e6
Conc-3_003
Q
51420>303.00
(+)
3.69e6
QC-L1_001
Q51420>303.00(+)
6.89e5
3.3
建立校
准曲线
3.3.1
建立校
准曲线
的操作
点击
菜单栏
【
Edit】
下
的图标
【
Edit
Tables】
o
<Compound
List>ffi<Sample
Results〉
戢
Edit
lobles
模块被
激活,
可以对
表格内
容进行
修改。
在
uSample
Resultsa
模
块中,
Sample
Type
(样
品类
型):
标准样
品选择
“Standard”
,
未知样
品选择
“Unknown”;
Level
(级
别):
不
同浓度
标准样
品选择
对应的
级别,
最
低浓度
Sample
•
Survey
Zoom
Compound
H3
to:
比
厂
k;
一
.
.
Ed*
m
Edit
FUgt
spy
Select
Compound)
QC-l\QC1
Mentifkgor
rXQC
S142Q*»IDOI>
回
ID3t
All
Peeks
3St42C>3Q]OC
:
•-•
}S14JD»)03fi0l>l
•
in
3“
QS14JO>SMOO(M
mziiq
351420>>0300(M
V-2JV
QS1420»M300i>l
*33”
4X>»500h)
vnam
1
比比
Cmc'OM
420>S0Stt<«)
RT«212J
•
C^libcation
•
MPApluc
a
Ai
4MMsm
Co*c・S.QCU
喝
RT=2.322
%
3
0.CO
»■
I
2
^^-^0^00^-00-
un
v
/dw
L#
o
n_6adw
l#
m
v
vd
*
级别为
l,
依次
类推。