Anritsu机器学习应用于PCB外观检测.pdf - 第6页
Anritsu T echnical Review No.28 September 2020 Application of M achine Learni ng to Printed Ci rcuit Board Ex ternal Inspecti on (6) Figure 7 Normal Board Distribution Figure 8 shows a comparison of the normality for the…
Anritsu Technical Review No.28 September 2020 Application of Machine Learning to Printed Circuit Board External Inspection
(5)
(3) Discrimination Procedure
We used a convolutional neural network with excellent
image-recognition performance as the machine-learning
discriminator. A convolutional neural network is configured
from a pile of levels, such as convolution layers and pooling
layers with various special functions to form a number of
deep levels. The convolutional neural netwok used in this
study had 10 levels composed of convoluted layers with co-
efficients of 3 × 3 and 3 × 1 (height × width).
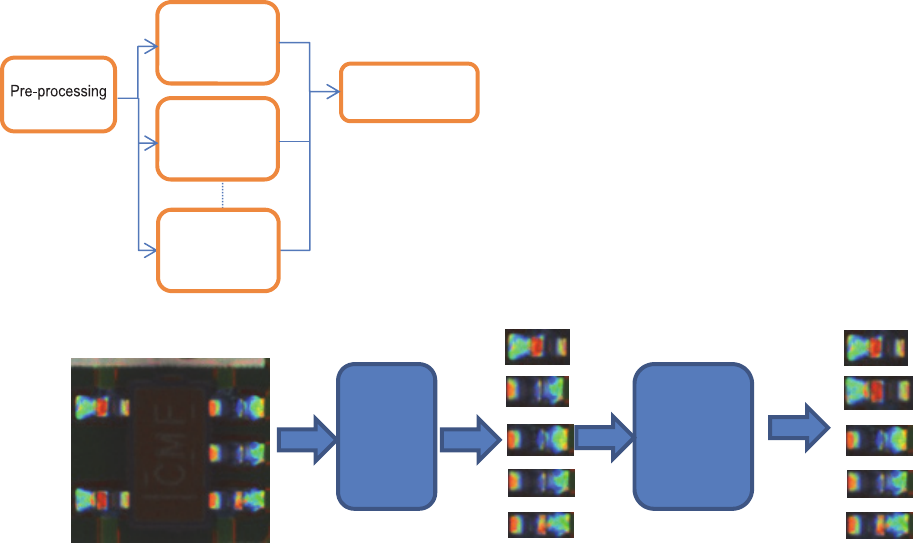
Figure 5 illustrates the discrimination procedure. First,
pre-processing loads the image to be inspected and identi-
fies the solder locations. The solder locations identified by
the discriminator are output as numeric discrimination re-
sults in the range of 0.0 to 1.0 indicating the normality dis-
tribution of the solder locations, with a value of 1.0 being
maximum normality. The normality threshold value deter-
mines whether the solder joint condition is pass or fail.
As shown in Figure 6, this inspection uses multiple dis-
criminators and evaluation is performed using the model
average, which averages the output of each discriminator.
Better performance can be expected
1), 2)
with suppressed
randomness, etc., by changing the learning parameter de-
fault values and combining multiple discriminators than
when using a single discriminator.
Figure 6 Model Averaging
6 Evaluating Results of PC Board External In-
spection using Machine Learning
6.1 Detection Performance
The performance of the algorithm proposed in this article
was evaluated using the model averaging technique applied
to 560 inspection images of pre-specified parts (60 pass
parts and 500 fail parts). The images used for evaluation
were not used for learning.
The results are shown in Table 1; eight learning models
were provided. As shown in Table 1, model averaging was
performed without making a specific evaluation to suppress
randomness in the detection performance for each learning
model.
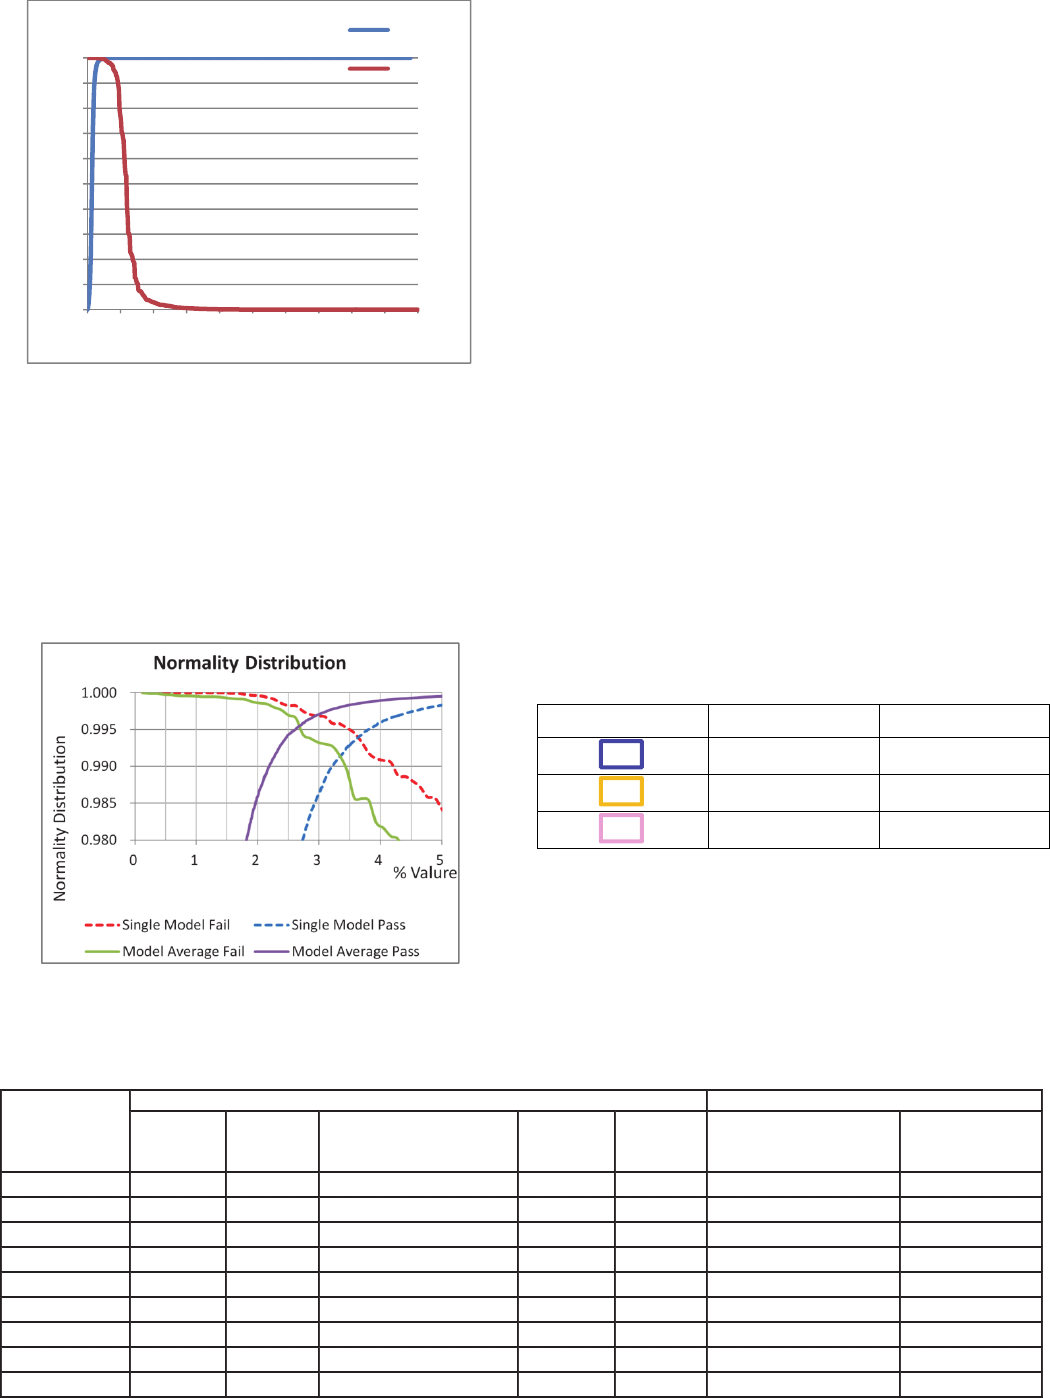
Figure 7 shows the cumulative distribution confirming
the normality distribution. The red line is the cumulative
distribution of normality for fail parts (493 locations) and
the blue line is the cumulative distribution of normality for
pass parts (65,168 locations). The fail parts cumulative dis-
tribution origin is 1.0, but is best if distributed in the lower
half with the origin at less than 0.5. In addition, the pass
parts cumulative distribution is the distribution with 0.0 as
the origin, but is best if distributed in the upper half with
the origin at more than 0.5. Since the cumulative distribu-
tions for the pass and fail locations intersect, evaluation
mistakes occur when evaluating using a threshold.
Machine
Learning
Discriminator 1
Machine
Learning
Discriminator 2
Model Average
Machine
Learning
Discriminator N
Machine
Learning
Discriminator
Inspection
Image
(Input Image)
Extraction of Slder
Joints at 5 Locations
Discrimination
Processing for Each
Location
Normality of Each
Joint
Pre-
processing
0.2
0.3
0.8
0.9
1.0
Figure 5 Discrimination Procedure using Machine Learning
49
Anritsu Technical Review No.28 September 2020 Application of Machine Learning to Printed Circuit Board External Inspection
(6)
Figure 7 Normal Board Distribution
Figure 8 shows a comparison of the normality for the
model average and single model results. The value for pass
locations increases by using the model average compared to
not using it, and the normality improves because the value
for fail locations decreases. However, evaluation mistakes
occur when using the evaluation threshold due to the dis-
tribution intersection.
Figure 8 Comparison of Model Average and Single Model
Normal Board Distribution
6.2 Distribution of Board Image Evaluation Mis-
takes
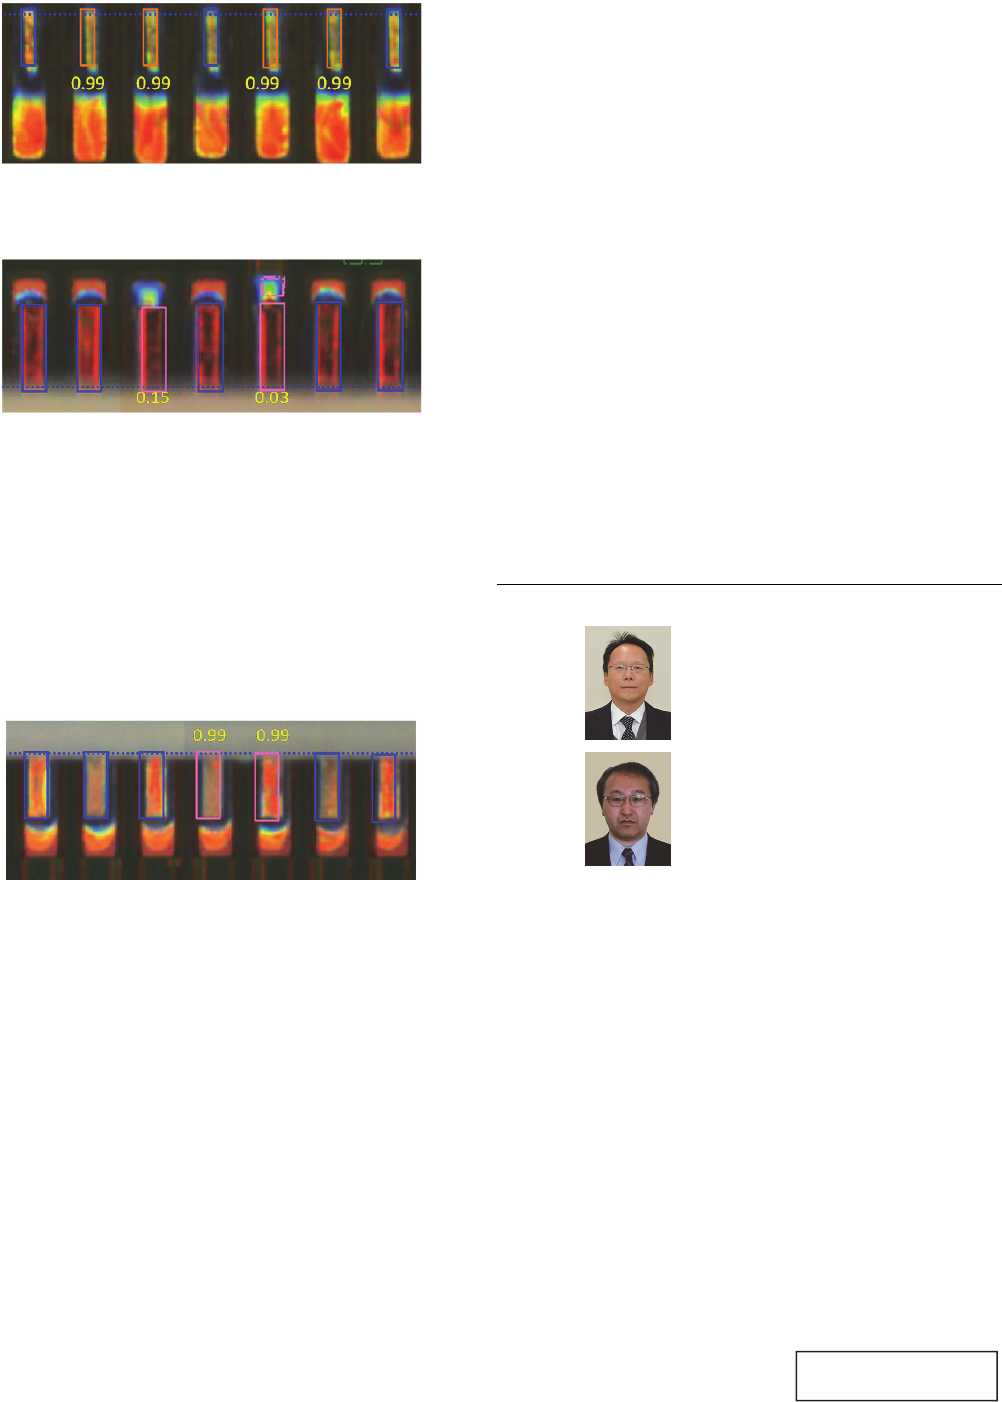
To confirm the mis-detection phenomenon, actual images
were checked. Figures 9 to 11 show examples of fail results
using machine learning. For AOI-evaluated fault locations,
on-site visual inspections were performed by a specialist
and the results were compared with the machine-learning
results. In these figures, locations evaluated as pass by AOI
are enclosed in a blue frame, while those evaluated by AOI
as fail are enclosed in an orange frame; locations evaluated
as fail by both AOI and visual inspection are enclosed in a
pink frame. The numerical values in Figures 10 and 11 in-
dicate the normality output by machine learning. The or-
ange-frame locations in Figure 10 were evaluated as fail by
AOI but pass by visual inspection. We clearly see the high
numeric value of the results assigned by machine learning
to these orange locations. Additionally, the pink frames in
Figure 11 which were evaluated as fail locations by both
AOI and visual inspection, were assigned low numeric val-
ues by machine learning. The machine-learning normality
output is extremely close to the results of visual evaluation
by a specialist.
Frame Color AOI Evaluation Visual Evaluation
Pass ―
Fail Pass
Fail Fail
Figure 9 Classification Method
0
0.1
0.2
0.3
0.4
0.5
0.6
0.7
0.8
0.9
1
0%
10%
20%
30%
40%
50%
60%
70%
80%
90%
100%
Normality Distribution
%
Normality Distribution
見過ぎ(10)
実不良(11)
Pass
Fail
Table 1 Detection Performance
Training Model
500 Images (Failure) 60 Images (Pass)
Failure Pass
Number of
Miss-Fail Detection
Detection
Ratio
Miss-
Detection
Number of
Fail-Detection at Excess
Watching
Reduction Ratio
of Fail Detection
1 545 495 50 0.91 28 0 0.00
2 545 504 41 0.92 25 0 0.00
3 545 478 67 0.88 11 0 0.00
4 545 497 48 0.91 17 3 0.04
5 545 496 49 0.91 20 0 0.00
6 545 495 50 0.91 10 4 0.06
7 545 489 56 0.90 21 0 0.00
8 545 501 44 0.92 26 3 0.04
Model Average 545 495 50 0.91 12 0 0.00
50
Anritsu Technical Review No.28 September 2020 Application of Machine Learning to Printed Circuit Board External Inspection
(7)
Figure 10 Example of Correct Answer
(Fail Detection at Excess Watching)
Figure 11 Example of Correct Answer (Fail Detection)
Figure 12 shows examples of images where the ma-
chine-learning evaluation results was incorrect (fail location
evaluated by machine learning as pass). In these cases, fail
locations (in pink frame) were assigned a high normality
value by machine learning. It seems it is difficult to detect
some fails just from the image since the image color distri-
bution is not unlike a pass location. Additional information
from an inspector seems to enable better evaluation.
Figure 12 Example of Mis-detection (Missed Fail Location)
When applying the machine-learning method, only the
normality parameter requires adjustment, so we may ex-
pect a reduction in on-site adjustment procedures. However,
it was not possible to reduce evaluation mistakes (excess
watching) to zero. It seems necessary to tune the learning
model by analyzing differences in the output distribution of
each layer of the convolutional neural network using cor-
rect- and incorrect-evaluation images to analyze the learn-
ing process model.
7 Conclusions
This article introduces automation of PC board external
inspection using machine learning. Tests focused on several
out of many part types and specifications to detect solder
joint fail locations. Future work on analysis of mis-detected
images is ongoing in our work to fine-tune learning models.
References
1) T. Hastie, R. Tibshirani, J. Friedman, The Elements of Statis-
tical Learning, Springer (2015), Japanese translation by
Sugiyama.
2) C. Bishop, Pattern Recognition and Machine Learning,
Springer (2015)
3) T. Okaya, Deep Learning Trends in Image Recognition, Artifi-
cial Intelligence,Vol. 31, No. 2, pp. 169-179 (2016) (In Japa-
nese)
4) T. Okaya, Deep Learning, Robotics Society of Japan, Vol. 33, No.
2, pp. 92-96 (2015)
5) Japan Welding Engineering Society, Microsoldering Working
Group, Standards Microsoldering Technology, Third Edition,
Nikkan Kogyo Shimbun (2012) (in Japanese)
Authors
Ken Shioiri
A
dvanced Technology Development
Center
Technical Headquates
Shoji Hamao
Tohoku Anritsu Corp.
Publicly available
51