00198481-01_Technical_Training_E_by_DEK_EN.pdf - 第104页
11 Benchmark Test 104 Technical Training E by DEK 12/2017 SPC Data Alignment Error Depending on how the printer has been set-up for SPC output (pre or post or both), the camera will capture each fiducial in turn. This …
11 Benchmark Test
Technical Training E by DEK 12/2017 103
11 Benchmark Test
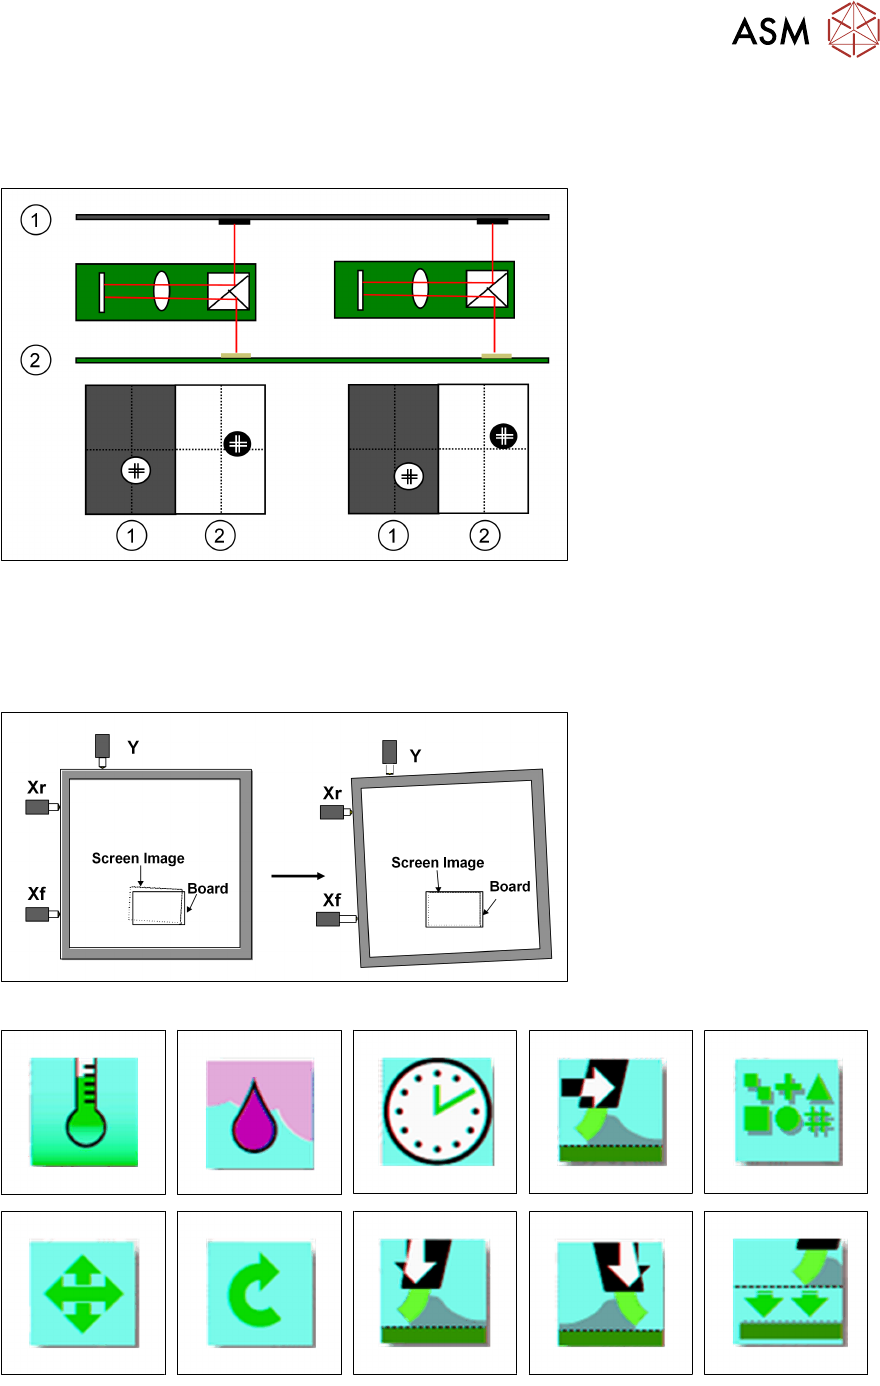
Alignment Theory
Screen Alignment
The camera captures each of the fiducials (screen and board) and sends the data to the processor.
The processor uses this data as well as the calibration data to calculate the amount of stencil
movement required to align the stencil to the board. The processor then tells the actuators how
much to move for this alignment.
Parameters Measured
●
Edit outputs in product file
●
Edit limits in product file
11 Benchmark Test
104 Technical Training E by DEK 12/2017
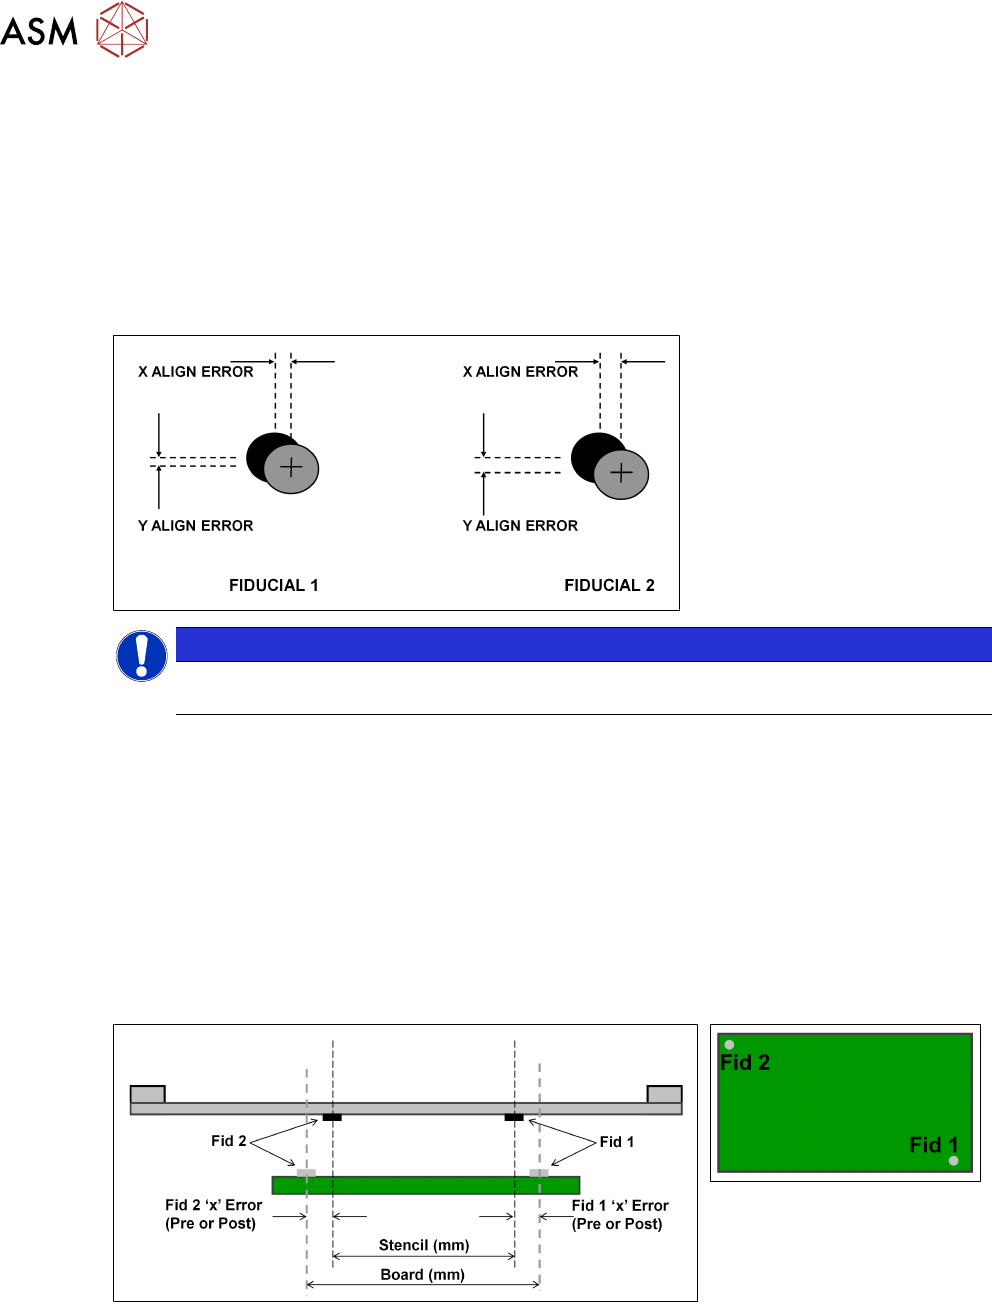
SPC Data Alignment Error
Depending on how the printer has been set-up for SPC output (pre or post or both), the camera will
capture each fiducial in turn. This positional data is sent to the computer for it to calculate the X, Y
and theta alignment error outputs for SPC analysis.
This data is captured just before the print stroke but after the alignment process if "pre" is selected
or after the print stroke if ‘post’ is selected. This data is captured on both occasions if "both" is
selected.
The computer then calculates the alignment error for X, Y and theta and sends it out as SPC
information.
NOTICE
This information for SPC is output just before the print stroke but after the alignment pro-
cess, and/ or just after the print stroke.
Board Stretch
Board stretch is calculated by taking the point of location of stencil fiducials and calculating the dis-
tance between them. Then the point of location of board fiducials and calculating the distance
between them. The difference between these is board stretch. It will be positive if stencil fiducials
are further apart than board fiducials.
Pre and post fiducial X and Y errors are calculated as shown in above diagram by finding positional
difference between each stencil and board fiducial. This can be done either before or after print, but
must be done after alignment. This information is used to calculate X, Y and theta alignment data.
This can be illustrated by running several prints with SPC outputs (alignment weighting set to 50%)
then changing the alignment weighting to 100% or 0% and observing the change. If set to 100%,
fiducial 1 error´s will move closer to zero and if set to 0% fiducial 2 errors will move closer to zero.
Stencil (mm) – Board (mm)
= Board Stretch

11 Benchmark Test
Technical Training E by DEK 12/2017 105
SPC Data Cycle Time L-R or R-L
Cycle time 1
(Left to Right/Right to Left) is time from board being received from Upline to same board being re-
leased to Downline.
●
Board Received by Machine
= Cycle Time starts
●
Board Exits Machine
= Cycle Time stops
SPC Data Cycle Time R-R or L-L
Cycle time 2
(Left to Left/Right to Right) is time from board arriving at board stop to board on next cycle arriving
at board stop.
1. Cycle 1
2. Board Stop
3. Cycle 2
●
Board Received at Board Stop (1)
= Cycle Time 1 starts
●
Board Received at Board Stop (2)
= Cycle Time 1 stops and Cycle Time 2
starts
Squeegee Pressure
DEK printers utilise a pressure monitoring and feedback system, which ensures that the pressure
applied to the squeegees is the same as that which is programmed. However, if different length
squeegees are fitted or the material hardness changes it may take one or two prints for the pres-
sure to re-stabilize.
Benchmark test using QC-CALC