High-speed-solder-ball-shear-and-pull-tests.pdf - 第3页
length. Figure 3 plots the m easured IMC thickness against time, yielding the expected linear fit when plotted against the square root of the aging tim e. The experimental data foll ows classical diffusion theory (Fic k’…
hot-air convective reflow oven. The Pb-free soldering profile
had a 150 ±2
o
C pre-heat, with a peak temperature of 260
o
C.
Thermal aging to accelerate IMC growth was conducted at
125
o
C in an oven for several time durations (100, 300 and
500 hours). After thermal aging, some PBGA specimens with
solder balls were molded, cross-sectioned and etched
(2%HCl+98%methanol). They were inspected and analyzed
by scanning electron microscopy (SEM). The compositions of
IMC phases grown during reflow and thermal aging were
evaluated.
Similar BGA samples were assembled on test boards and
dropped using a dual-rail guided device. Since the packages
used in the present study were relatively large, the
specifications of the test boards (142x142 mm, 8 layer Cu,
2.35 mm thick) were different from those given in JESD22-
B111 [9]. Some board level test samples were also subjected
to thermal aging, as above. All samples were equipped with
daisy chains and subjected to real time data acquisition
monitoring.
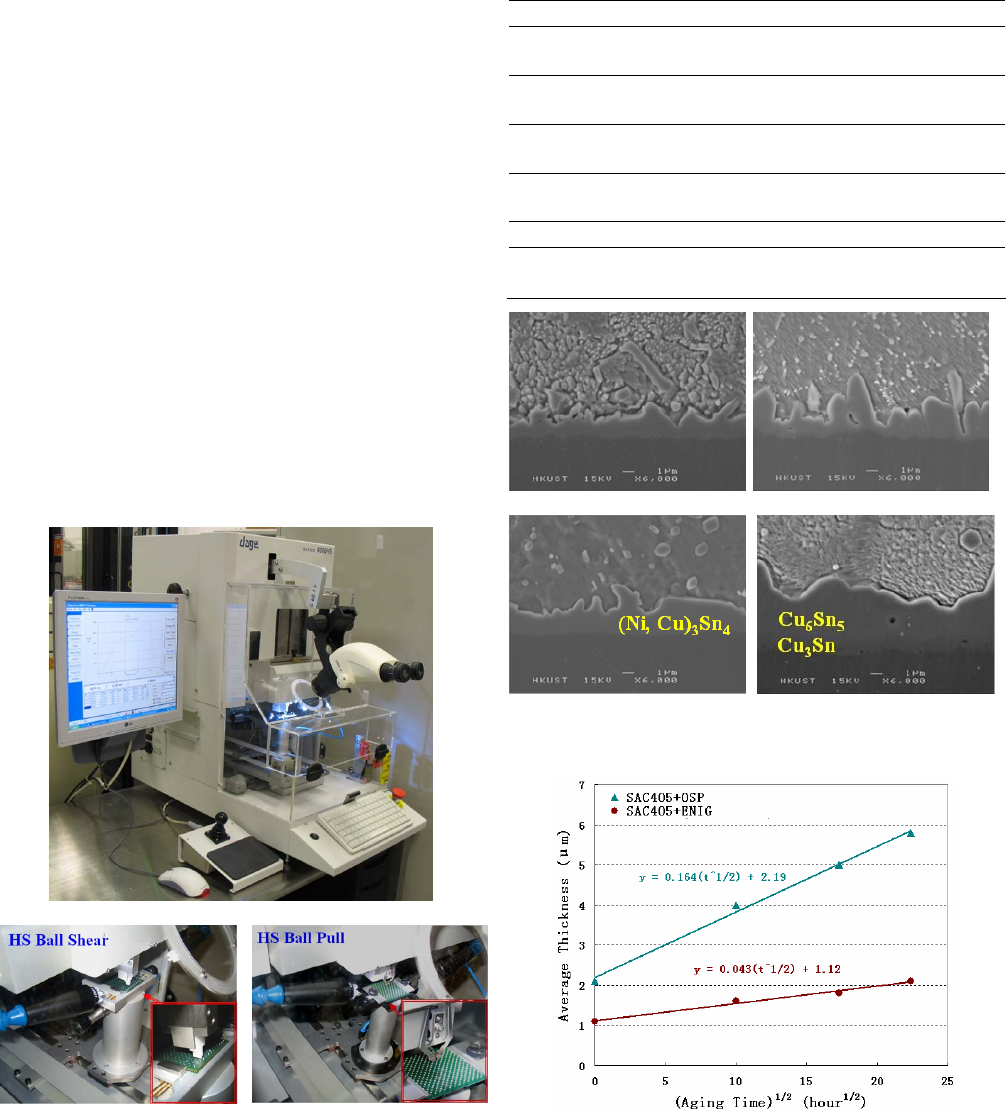
The ball shear and pull tests were performed with different
speeds on the lead-free solder balls after thermal aging using
a DAGE 4000HS bond tester (Figure 1). Each set of ball
shear or pull test data consisted of a series of 20 individual
measurements.
(a) DAGE 4000HS Bond tester
(b) Ball shear system (c) Ball pull system
Figure 1. DAGE 4000HS Bond tester system
A summary of various sample and test parameters is listed
in Table 1. High-speed video capture (2,000–20,000 frames/s)
was conducted for selected solder ball shear/pull samples.
Various kinetic effects of the test hardware and sample
fixturing were observed. Test speeds above approximately
100 mm/s proved the most uniform during solder joint
fracture.
Table 1. Description of mechanical tests for solder balls
Test Method HS Shear Test HS Pull Test
Loading
Rates
10, 100, 500, 1000
and 3000 mm/s
5, 50, 100, 250, and
500 mm/s
Shear
Height
50 µm
-
Clamping
Force
-
2.2 bar
Solder
Composition
Sn4.0%Ag0.5%Cu Sn4.0%Ag0.5%Cu
Pad Finish ENIG and OSP ENIG and OSP
Sample
Status
As-reflowed
(two times reflow)
As-reflowed
(two times reflow)
(a) ENIG, 0 hour (b) OSP, 0 hour
(c) ENIG, 500 hours (d) OSP, 500 hours
Figure 2. IMC growth and morphology changes subject to
thermal aging at 125
o
C (ENIG and OSP)
Figure 3. Correlation between IMC thickness and aging time
3. Results and Discussion
3.1 Intermetallic Growth
Representative photos of the intermetallic structures and
thickness for BGA samples (unattached to a circuit board) are
shown in Figure 2. Given the highly non-uniform topography
of the IMC layer, the average thickness was determined by
dividing the cross-sectional area of the IMC by its base
1505 2007 Electronic Components and Technology Conference
length. Figure 3 plots the measured IMC thickness against
time, yielding the expected linear fit when plotted against the
square root of the aging time. The experimental data follows
classical diffusion theory (Fick’s law), which specifies a
linear relationship between the thickness of IMC layer and the
square root of time. Figure 3 also shows that the IMC growth
rates in solders on OSP surface finish are higher than those on
ENIG. This demonstrates that the Ni layer in ENIG serves as
a good barrier to inhibit growth of Cu-Sn IMC [8].
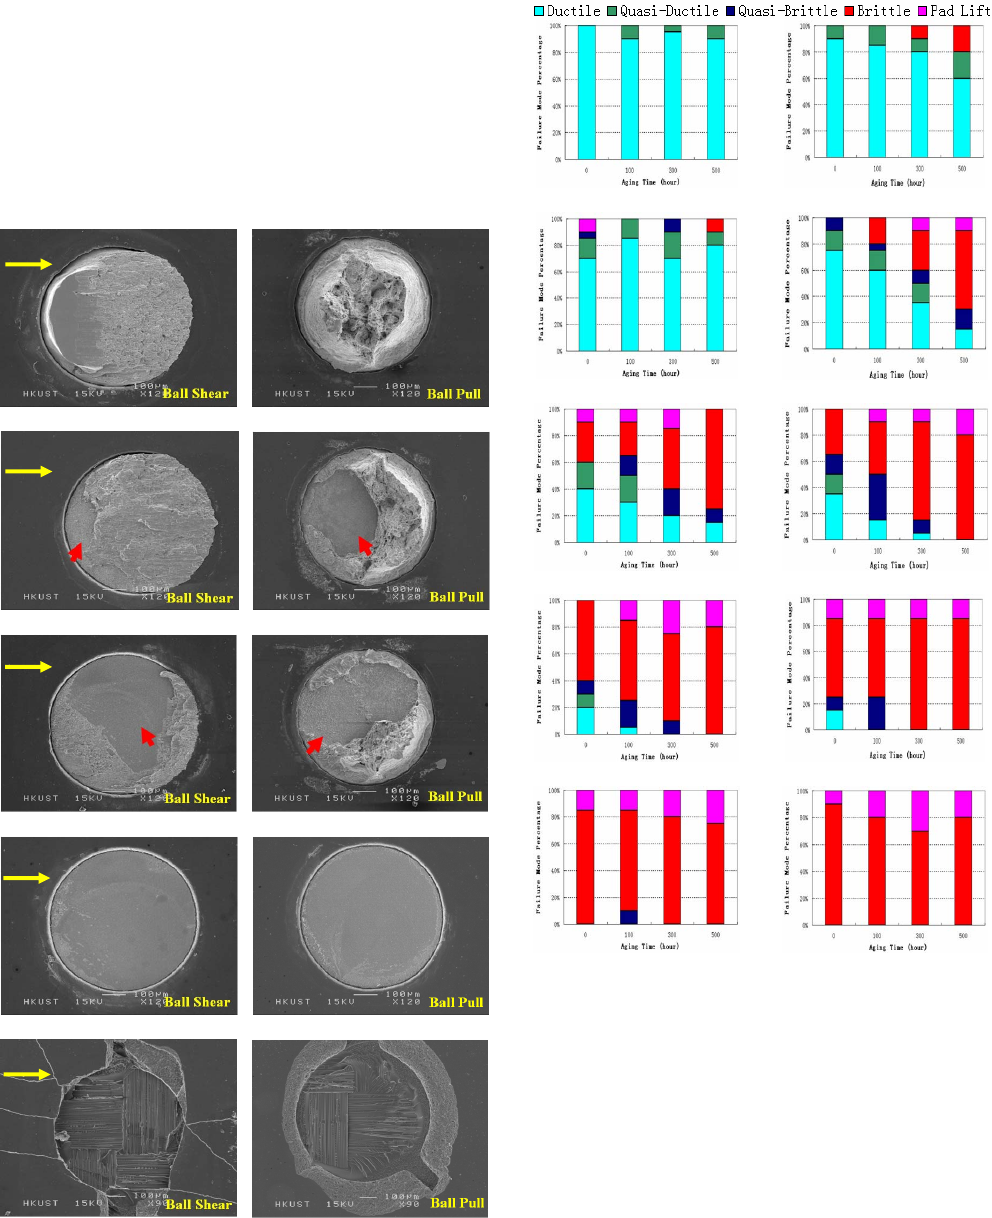
(a) Ductile mode (100% area with solder left)
(b) Quasi-ductile mode (<50% area with exposed pad)
(c) Quasi-brittle mode (>50% area without solder)
(d) Brittle mode (almost no solder left)
(e) Pad lift with brittle
Figure 4. High-speed ball shear and pull failure modes
(a) 10 mm/s (ENIG) (b) 10 mm/s (OSP)
(c) 100 mm/s (ENIG) (d) 100 mm/s (OSP)
(e) 500 mm/s (ENIG) (f) 500 mm/s (OSP)
(g) 1000 mm/s (ENIG) (h) 1000 mm/s (OSP)
(i) 3000 mm/s (ENIG) (j) 3000 mm/s (OSP)
Figure 5. Failure mode distribution in ball shear of
specimens with ENIG and OSP pad finishes
3.2 Solder Ball Shear/Pull Failure Modes
In this investigation, the solder ball shear and pull test
samples were evaluated both quantitatively (force and fracture
energy) and qualitatively (failure mode). In order to enhance
discrimination of the qualitative failure mode assessments,
mixed ductile/brittle modes were divided into two
classifications: quasi-ductile (<50% of the surface pad
remains exposed) and quasi-brittle (>50% of the surface pad
remains exposed). Representative photographs of the 5 failure
modes (ductile, quasi-ductile, quasi-brittle, brittle and pad lift)
are shown in Figure 4.
Shear Direction
Shear Direction
Shear Direction
Shear Direction
Shear Direction
1506 2007 Electronic Components and Technology Conference
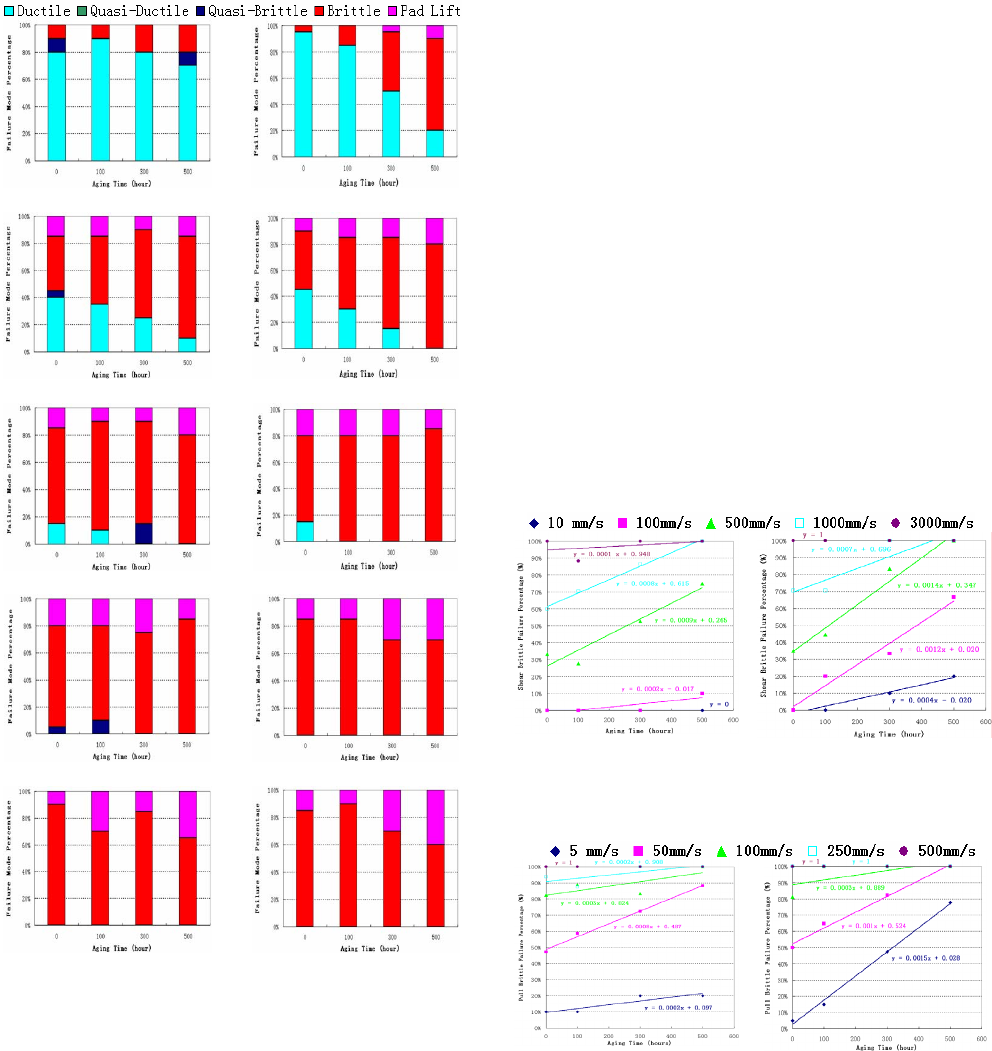
(a) 5 mm/s (ENIG) (b) 5 mm/s (OSP)
(c) 50 mm/s (ENIG) (d) 50 mm/s (OSP)
(e) 100 mm/s (ENIG) (f) 100 mm/s (OSP)
(g) 250 mm/s (ENIG) (h) 250 mm/s (OSP)
(i) 500 mm/s (ENIG) (j) 500 mm/s (OSP)
Figure 6. Failure mode distribution in ball pull of specimens
with ENIG and OSP pad finishes
Graphical summaries of the solder ball shear and pull
failure mode results are shown in Figures 5 and 6,
respectively. Similar to results of previous studies, a clear
transition occurred between the ductile mode typical of low
shear/pull speeds, and a brittle mode at higher test speeds [1,
2, 8]. Although the failure mode responses are remarkably
similar between the shear and pull testing, the transition from
ductile to brittle occurred at lower speeds in solder ball pull
testing.
Figures 5 and 6 also demonstrate that the samples with an
OSP finish showed an increased incidence of brittle failure
with increased themal exposure. By contrast, the samples with
ENIG plating yielded only a slight increase in brittle fracture
frequency even at the highest test speeds. The different brittle
fracture response between ENIG and OSP may not be
surprising given the comparative IMC growth rates shown in
Figure 3.
Figures 7 and 8 plot the failure mode data in another
format, showing the percentage of brittle failure mode for
each test speed against aging time, excluding the non-solder
related failure mode (pad lift). This transformation allows the
rate of brittle fracture incidence as a function of time and
aging temperature to be described by simple linear curve
fitting. The curve fitting follows the relationship, y = ax + b,
where y is the brittle failure percentage of ball shear and pull
test after aging, x equals aging time, and a represents the
change in brittle mode percentage with aging, and b is the
brittle failure percentage for the zero time sample. It should
be noted that the different slopes are a measure of the
sensitivity of the test system for detecting changes in brittle
fracture with time or test speed. Observe that the line with the
highest slope in each graph represents the optimal test speed
for each sample to detect changes in brittle fracture rate with
time.
(a) Ball shear (ENIG) (b) Ball shear (OSP)
Figure 7. Brittle failure percentage of ball shear tests at
various testing speeds and aging time
(a) Ball pull (ENIG) (b) Ball pull (OSP)
Figure 8. Brittle failure percentage of ball pull test at
various testing speeds and aging time
Figure 9 transforms the linear curve fitting of Figures 7 & 8
into simplified brittle fracture rate response curves versus
solder ball shear and pull test speeds. These graphs provide a
technique to quantitatively define the optimal test speed
(transition point) at which a solder joint fracture is most prone
to shift from ductile to brittle failure mode. Additionally,
Figure 9 can be used to define a recommended test speed for
evaluating brittle solder joint fractures.
1507 2007 Electronic Components and Technology Conference