High-speed-solder-ball-shear-and-pull-tests.pdf - 第5页
(a) Ball shear (ENIG) (b) Ball shear (OSP) (c) Ball pull (ENIG) (d) Ball pull (OSP) Figure 9. The sen sitivity of transition level to brittle mode in ball shear and pull tests at d ifferent testing speeds (a) Shear force…
(a) 5 mm/s (ENIG) (b) 5 mm/s (OSP)
(c) 50 mm/s (ENIG) (d) 50 mm/s (OSP)
(e) 100 mm/s (ENIG) (f) 100 mm/s (OSP)
(g) 250 mm/s (ENIG) (h) 250 mm/s (OSP)
(i) 500 mm/s (ENIG) (j) 500 mm/s (OSP)
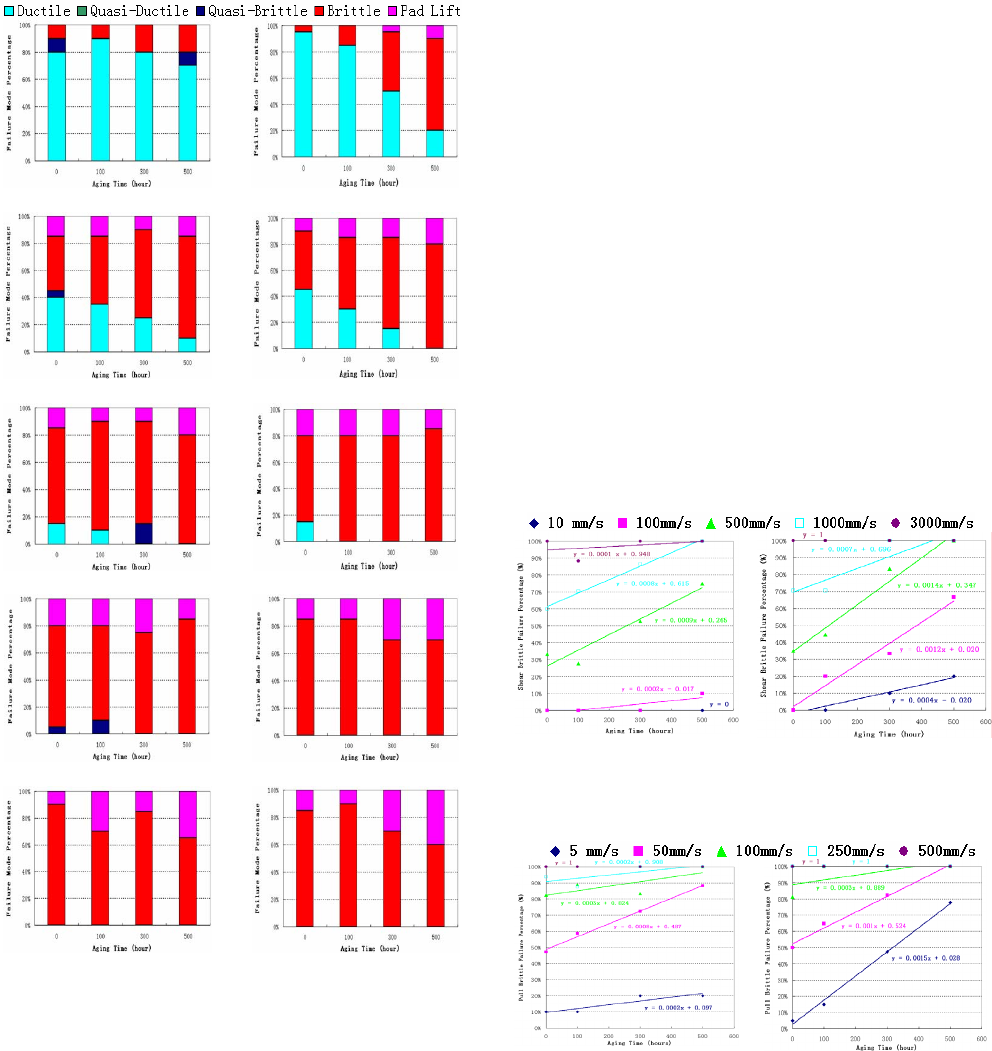
Figure 6. Failure mode distribution in ball pull of specimens
with ENIG and OSP pad finishes
Graphical summaries of the solder ball shear and pull
failure mode results are shown in Figures 5 and 6,
respectively. Similar to results of previous studies, a clear
transition occurred between the ductile mode typical of low
shear/pull speeds, and a brittle mode at higher test speeds [1,
2, 8]. Although the failure mode responses are remarkably
similar between the shear and pull testing, the transition from
ductile to brittle occurred at lower speeds in solder ball pull
testing.
Figures 5 and 6 also demonstrate that the samples with an
OSP finish showed an increased incidence of brittle failure
with increased themal exposure. By contrast, the samples with
ENIG plating yielded only a slight increase in brittle fracture
frequency even at the highest test speeds. The different brittle
fracture response between ENIG and OSP may not be
surprising given the comparative IMC growth rates shown in
Figure 3.
Figures 7 and 8 plot the failure mode data in another
format, showing the percentage of brittle failure mode for
each test speed against aging time, excluding the non-solder
related failure mode (pad lift). This transformation allows the
rate of brittle fracture incidence as a function of time and
aging temperature to be described by simple linear curve
fitting. The curve fitting follows the relationship, y = ax + b,
where y is the brittle failure percentage of ball shear and pull
test after aging, x equals aging time, and a represents the
change in brittle mode percentage with aging, and b is the
brittle failure percentage for the zero time sample. It should
be noted that the different slopes are a measure of the
sensitivity of the test system for detecting changes in brittle
fracture with time or test speed. Observe that the line with the
highest slope in each graph represents the optimal test speed
for each sample to detect changes in brittle fracture rate with
time.
(a) Ball shear (ENIG) (b) Ball shear (OSP)
Figure 7. Brittle failure percentage of ball shear tests at
various testing speeds and aging time
(a) Ball pull (ENIG) (b) Ball pull (OSP)
Figure 8. Brittle failure percentage of ball pull test at
various testing speeds and aging time
Figure 9 transforms the linear curve fitting of Figures 7 & 8
into simplified brittle fracture rate response curves versus
solder ball shear and pull test speeds. These graphs provide a
technique to quantitatively define the optimal test speed
(transition point) at which a solder joint fracture is most prone
to shift from ductile to brittle failure mode. Additionally,
Figure 9 can be used to define a recommended test speed for
evaluating brittle solder joint fractures.
1507 2007 Electronic Components and Technology Conference
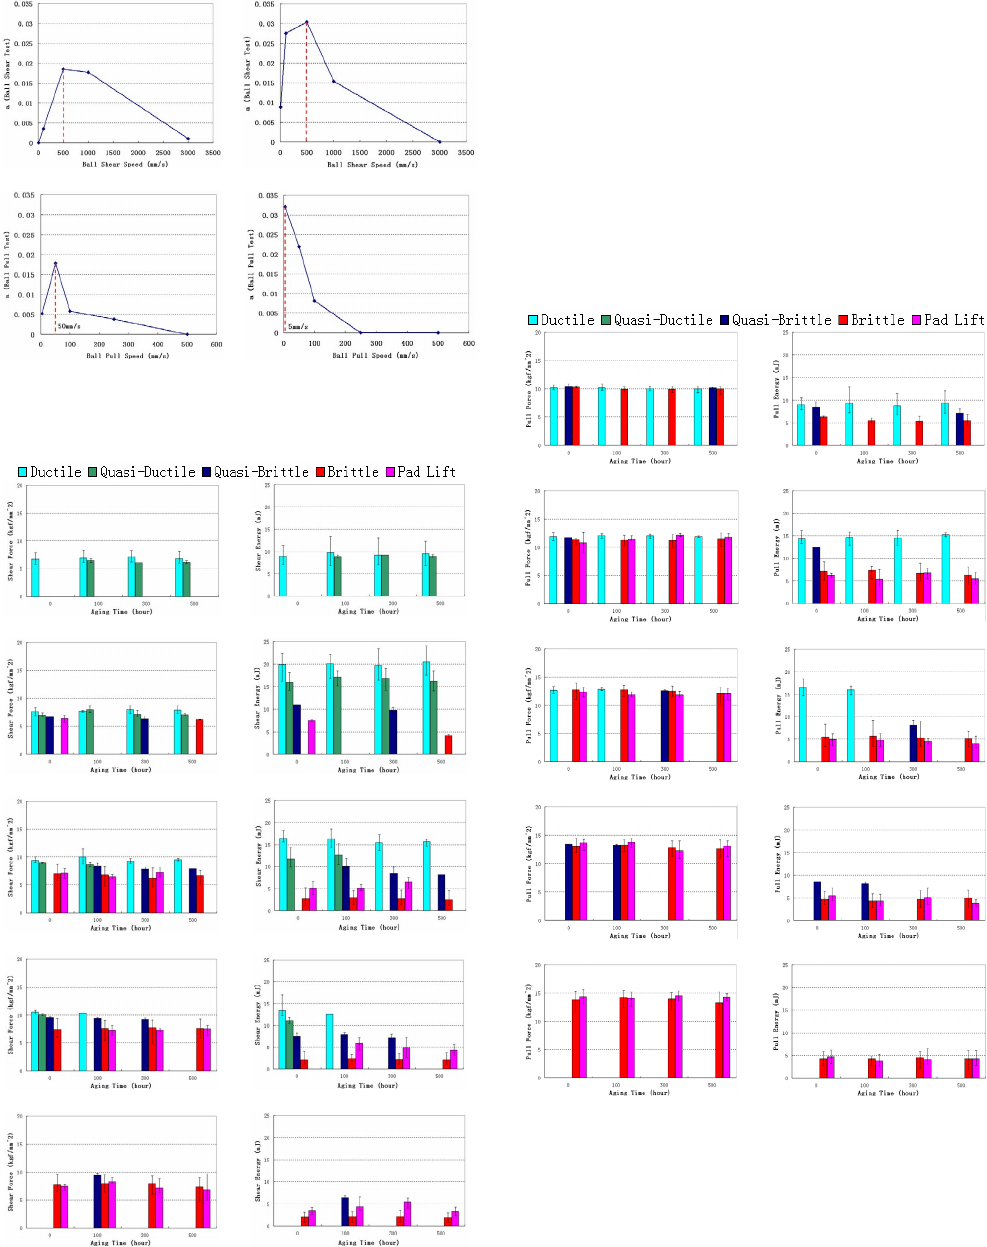
(a) Ball shear (ENIG) (b) Ball shear (OSP)
(c) Ball pull (ENIG) (d) Ball pull (OSP)
Figure 9. The sensitivity of transition level to brittle mode
in ball shear and pull tests at different testing speeds
(a) Shear force (10 mm/s) (b) Shear Energy (10 mm/s)
(c) Shear force (100 mm/s) (d) Shear Energy (100 mm/s)
(e) Shear force (500 mm/s) (f) Shear Energy (500 mm/s)
(g) Shear force (1000 mm/s) (h) Shear Energy (1000 mm/s)
(i) Shear force (3000 mm/s) (j) Shear Energy (3000 mm/s)
Figure 10. Ball shear strength and energy of different failure
modes as a function of aging time and test speed
(SAC405 + ENIG)
3.3 Solder Ball Shear/Pull Fracture Force & Energy
Although all of the previous figures relate to qualitative
observations of failure mode, electronics companies would
clearly prefer a quantitative assessment method which is
independent of subjective operator classification, and is
highly repeatable. The introduction of fracture energy as an
alternative measure of solder joint strength (beyond the
conventional force metric) at high shear/pull speeds
represents a major shift in the test equipment industry. A
companion paper in this conference proceedings provides
additional discussion on the fracture energy assessment metric
(see Figures 7 and 8 in [10]).
(a) Pull force (5 mm/s) (b) Pull Energy (5 mm/s)
(c) Pull force (50 mm/s) (d) Pull Energy (50 mm/s)
(e) Pull force (100 mm/s) (f) Pull Energy (100 mm/s)
(g) Pull force (250 mm/s) (h) Pull Energy (250 mm/s)
(i) Pull force (500 mm/s) (j) Pull Energy (500 mm/s)
Figure 11. Ball pull strength and energy of different failure
modes as a function of aging time and test speed
(SAC405 + ENIG)
Figures 10 and 11 provide a graphical summary of the
fracture force and energy data (shear/pull) of SAC405 +
ENIG, while Figures 12 and 13 display the same parameters
for the samples with OSP pad finish. The degree of
correlation between fracture energy and failure mode is
obviously much better than using the traditional measure of
1508 2007 Electronic Components and Technology Conference
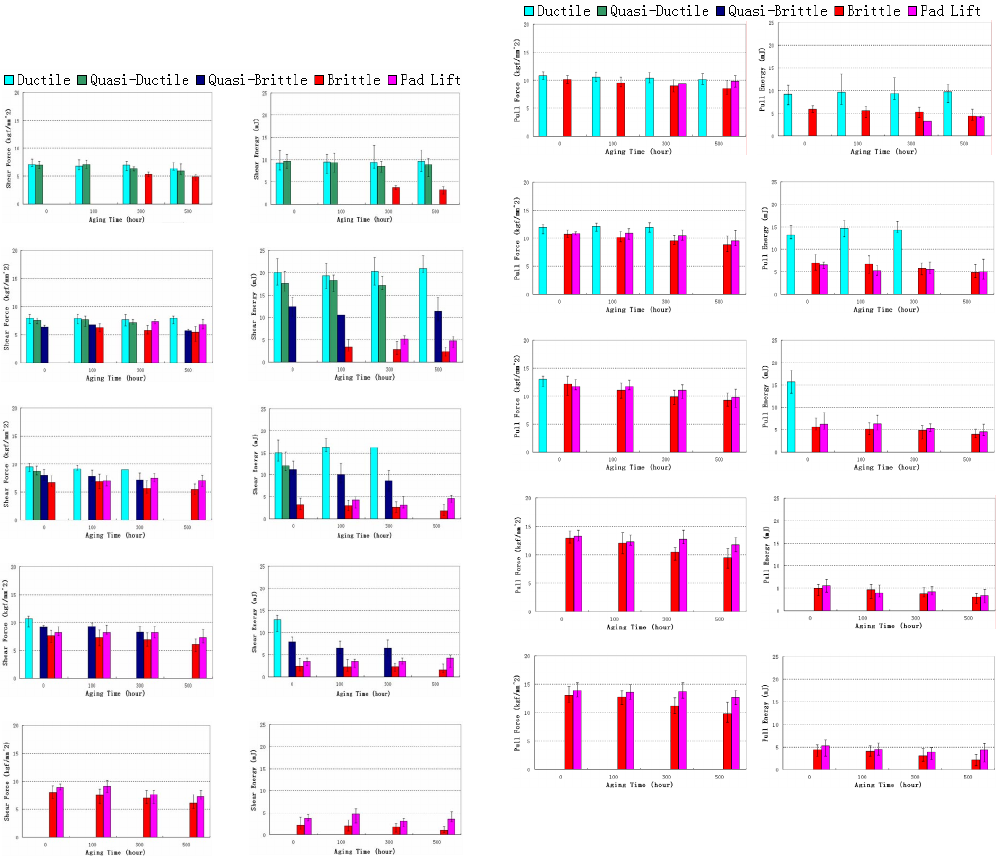
force, confirming early observations using high-speed shear
testing [2, 5, 16]. For example, the difference of force data at
various failure modes is not significant. In contrast, it can be
found that the fracture energies of various failure modes are
obviously different, both on the specimens with ENIG and
OSP pad finishes as shown in Figures 11 and 13 for ball pull
tests. Specifically, compare histograms (e) and (f) of Figure
11; forces (e) are virtually uniform for all the aging times,
even though failure modes have shifted from ductile to brittle
and pad lift, but there is a distinct shift from high energy
values for ductile failures to lower energies for brittle and pad
lift modes as shown in (f). A similar argument applies to
histograms (c) and (d) in Figure 13. Corresponding examples
can be seen for the shear tests in Figures 10 and 12.
(a) Shear force (10 mm/s) (b) Shear Energy (10 mm/s)
(c) Shear force (100 mm/s) (d) Shear Energy (100 mm/s)
(e) Shear force (500 mm/s) (f) Shear Energy (500 mm/s)
(g) Shear force (1000 mm/s) (h) Shear Energy (1000 mm/s)
(i) Shear force (3000 mm/s) (j) Shear Energy (3000 mm/s)
Figure 12. Ball shear strength and energy for different
failure modes as a function of aging time and test speed
(SAC405 + OSP)
3.4 Board Level Drop Testing
As highlighted in the introduction, the primary objective of
this research was to investigate the feasibility of using high-
speed solder ball shear and pull tests as alternative methods to
board level drop testing for evaluating solder joint integrity
under dynamic loading. In order to provide a basis for
comparison to the shear and pull testing of the components, a
series of drop tests were conducted using board assemblies of
identical package lots evaluated by the DAGE 4000HS.
Moreover, these assemblies were aged at 125
o
C (0 to 500
hours). It is important to acknowledge, however, that the IMC
composition and morphology for the solder joints are not
identical between the component and assembly aging studies,
due to the rapid dissolution of Cu on the OSP circuit board
during package attachment.
(a) Pull force (5 mm/s) (b) Pull Energy (5 mm/s)
(c) Pull force (50 mm/s) (d) Pull Energy (50 mm/s)
(e) Pull force (100 mm/s) (f) Pull Energy (100 mm/s)
(g) Pull force (250 mm/s) (h) Pull Energy (250 mm/s)
(i) Pull force (500 mm/s) (j) Pull Energy (500 mm/s)
Figure 13. Ball pull strength and energy of different failure
modes as a function of aging time and test speed (SAC405
+ OSP)
Only a small subset of the total test results are represented
in this paper. Indeed, some of the other test samples failed
much earlier in drop testing than the 316 BGA packages
(primarily due to their much larger size and mass), and a drop
test condition was selected to insure that failures did not occur
as soon as the first cycle. Following preliminary studies, a
JEDEC JESD22-B110A service condition A; 500G, 1.0 ms
1509 2007 Electronic Components and Technology Conference