High-speed-solder-ball-shear-and-pull-tests.pdf - 第9页
Cu 6 Sn 5 IMC and Cu layers. The brittle failu re of the OSP specimens after thermal ag i ng occurred between the Cu 6 Sn 5 and Cu 3 Sn IMC phases. From the com parison of Figures 15 t o 17 (cross-section) and 18 to 20 (…
package substrate surface finish showed a more rapid
degradation with thermal aging than those with an ENIG
finish [12-16].
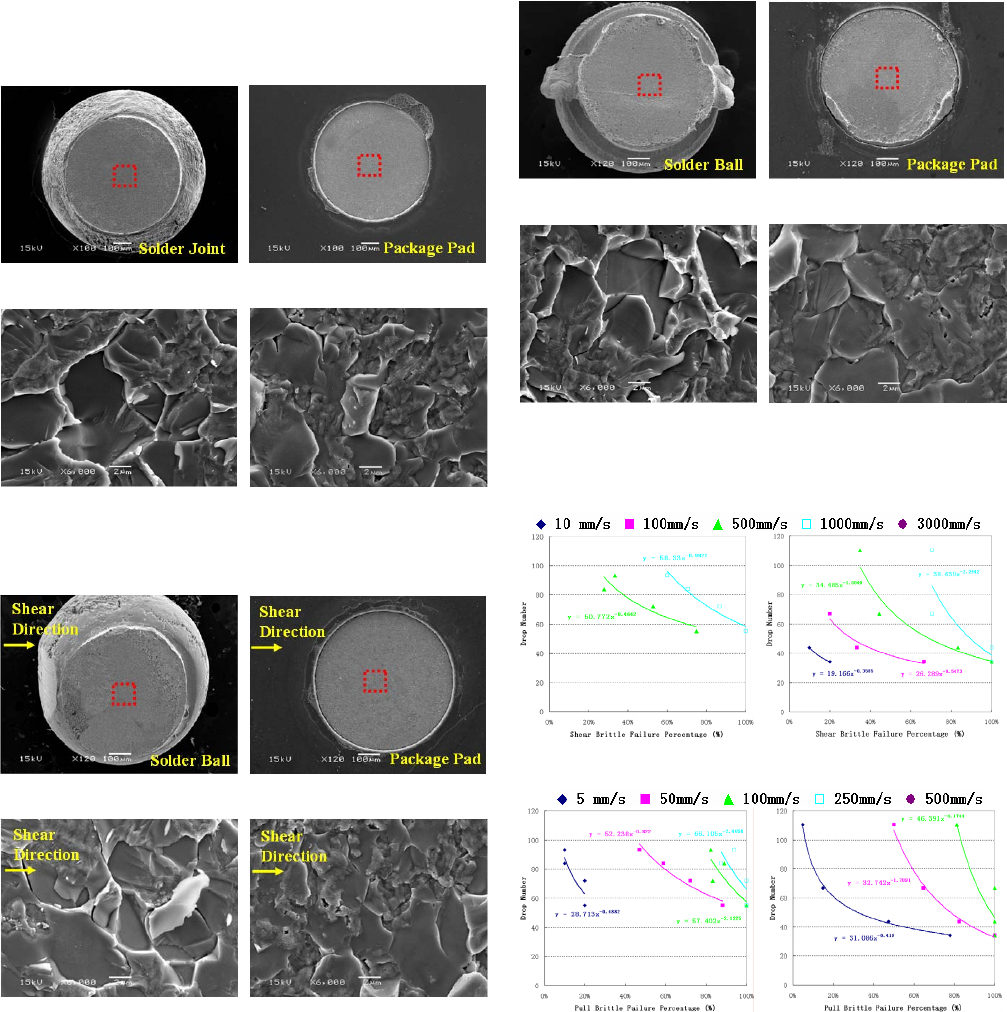
(a) Brittle fracture surface of
solder joint
(b) Brittle fracture surface of
the matching pad of (a)
(c) Close-up view at location
indicated by rectangle in (a)
(d) Close-up view at location
indicated by rectangle in (b)
Figure 18. Brittle fracture surface after drop test
(SAC405 + OSP, 500 hours aging)
(a) Brittle fracture surface of
sheared ball
(b) Brittle fracture surface of
the matching pad of (a)
(c) Close-up view at location
indicated by rectangle in (a)
(d) Close-up view at location
indicated by rectangle in (b)
Figure 19. Brittle fracture surface after high-speed ball
shear test (SAC405 + OSP, 500 hours aging, 500 mm/s)
3.5 Correlations between BLDT and High Speed Ball
Shear/Pull Tests
Previous evaluations of high-speed solder ball shear and
pull testing have observed brittle fractures that appeared
similar to the brittle fracture mode observed in BLDT
assemblies, but little definitive cross-sectional evidence has
been provided. Partly this has been due to the difficulty of
such studies, both in terms of retrieval of individual sheared
or pulled balls and matching them to their corresponding pad,
and the subsequent cross-sectional work.
(a) Brittle fracture surface of
pulled ball
(b) Brittle fracture surface of
the matching pad of (a)
(c) Close-up view at location
indicated by rectangle in (a)
(d) Close-up view at location
indicated by rectangle in (b)
Figure 20. Brittle fracture surface after high-speed ball pull
test (SAC405 + OSP, 500 hours aging, 50 mm/s)
(a) Ball shear (ENIG) (b) Ball shear (OSP)
(c) Ball pull (ENIG) (d) Ball pull (OSP)
Figure 21. Correlation of drops-to-failure and brittle failure
percentage of ball shear and pull tests at different test
speeds.
Notes: (i) All failures in drop test are brittle fractures.
(ii) The curves disappear if the brittle failure percentage
(ball shear and pull) at different aging time rises to 100%,
e.g. 3000 mm/s for ball shear and 500 mm/s for ball pull.
In this paper, painstaking effort has resulted in the
definitive images shown in Figures 15 to 20. From the failure
analysis of drop test specimens as shown in Figures 15 and
16, the brittle failure on the ENIG was induced between the
IMC and the Ni layers. For the OSP specimens without aging
(with two times reflow), the brittle failure was found between
1511 2007 Electronic Components and Technology Conference
Cu
6
Sn
5
IMC and Cu layers. The brittle failure of the OSP
specimens after thermal aging occurred between the Cu
6
Sn
5
and Cu
3
Sn IMC phases.
From the comparison of Figures 15 to 17 (cross-section)
and 18 to 20 (fracture surface), it is clear that brittle fracture
interfaces from drop testing show a striking similarity with
those from high-speed ball shear and pull tests. These figures
provide clear evidence of a close resemblance between the
brittle fracture modes of BLDT and high-speed solder ball
shear and pull.
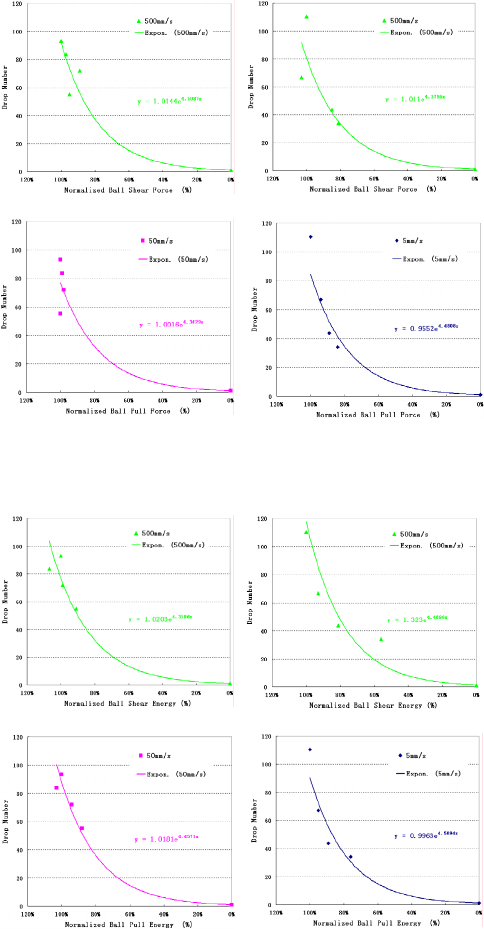
(a) Ball shear (ENIG) (b) Ball shear (OSP)
(c) Ball pull (ENIG) (d) Ball pull (OSP)
Figure 22. Correlation of drops-to-failure and normalized
ball shear and pull force with the optimal testing speed
(a) Ball shear (ENIG) (b) Ball shear (OSP)
(c) Ball pull (ENIG) (d) Ball pull (OSP)
Figure 23. Correlation of drops-to-failure and normalized
ball shear and pull energy with the optimal testing speed
Due to their complexity and requisite length of explanation,
it is not possible in this brief paper to elaborate on the various
mathematical correlations relating the solder ball shear/pull
and drop test results. Nonetheless, an innovative approach is
graphically summarized in Figures 21-23. Figure 21 relates
the brittle fracture percentages from shear and pull solder ball
testing to the drops-to-failure for the specific packages and
drop test conditions used in this study. Briefly, this plot is
achieved by plotting the drops-to-failure number for each
time point against the equivalent data from shear or pull
testing, followed by power law curve fitting. It should be
noted that each curve in Figure 21 corresponds to one solder
ball shear or pull test speed. These curves can be employed to
estimate the “drops-to-failure” number from the brittle
fracture percentage obtained in either the ball shear or pull
test with a specific test speed. For demonstration purpose, the
5 mm/s ball pull test curve in Figure 21(d) is used as an
example. If 60% of brittle fracture percentage is observed
during this kind of test, then people can draw a vertical line at
60% on the horizontal axis and going upwards. When the
vertical line hits the designated curve, people can turn left and
find its corresponding vertical coordinate (or just plug 60%
into the fitting function), which is 39. This value is the
estimated “drops-to-failure” number for the same type of
specimens subject to the mechanical drop test with the
conditions used in the present study. In other words, the
curves in Figure 21 may provide people with certain
“prediction” capability to estimate the drop test results from
the high-speed ball shear or pull test data.
Figure 22 details the exponential relationship between
normalized solder ball shear/pull force and drops-to-failure
for the brittle failure mode data points only. The shear and
pull data come from the optimal speeds for each time point.
Figure 23 shows similar graphical summaries for the solder
ball shear/pull energy. These graphs highlight that a moderate
shift in brittle fracture rate, fracture energy or force for high-
speed solder ball shear/pull testing can have a significant
impact on the predicted drop testing lifetime. It is suggested
that a manufacturer might establish solder ball shear/pull
failure mode, fracture energy or force acceptance criteria for a
particular product based upon a similar analysis.
Future papers will further evaluate the various relationships
between drops-to-failure, failure mode, force and fracture
energy, drawing upon the much larger database generated in
the full study (only a subset of the results are included in the
Figures 21-23 correlations due to limitations on paper length).
4. Conclusions
1) Solder ball shear and ball pull tests produced a high
incidence of brittle fracture with increasing test speed,
independent of pad finish or aging time.
2) The IMC on packages with an OSP pad grew faster than
on devices with ENIG plating, and samples with OSP
pads generated more brittle solder joint failures in ball
shear/pull tests after thermal aging.
3) Solder ball pull testing (compared with shear) generated a
higher percentage of brittle failures at all test speeds.
4) Compared to the specimens with ENIG pad finish, the
ball shear/pull strength and fracture energy of specimens
with OSP decreased more rapidly with aging time. This
phenomenon most likely relates to the thicker Cu-Sn
1512 2007 Electronic Components and Technology Conference
phase IMC formed in OSP specimens compared to those
with ENIG.
5) Thermal aging showed a significant effect on board level
drop reliability in this study for both ENIG and OSP
package substrate pad finishes. SAC + ENIG exhibits
longer drop impact life after thermal aging than that of
SAC + OSP. From SEM inspection, all drop test failures
were brittle fracture at an IMC interface, regardless of
pad finish or aging time.
6) From the failure analysis of drop test specimens, the
brittle failure on the ENIG was induced between the IMC
and the Ni layers. For the OSP specimens without aging
(with two times reflow), the brittle failure was found
between Cu
6
Sn
5
IMC and Cu layers. The brittle failure of
the OSP specimens after thermal aging occurred between
the Cu
6
Sn
5
and Cu
3
Sn IMC phases.
7) Detailed comparison of brittle fracture interfaces from
drop testing with those from high-speed shear ball shear
and pull tests showed a striking similarity. Therefore,
based on these microstructural observations, high-speed
ball shear and pull tests can be used as an indicator of
board level drop test performance.
8) Power law relationships can be obtained at different
shear/pull testing speeds using the combined results of
drops-to-failure and brittle failure percentages of ball
shear/pull tests with thermal aging time. Using this
correlation, drop impact lifetime can be estimated
according to the brittle failure percentages obtained in the
high-speed ball shear and pull tests.
References
1. A. T. Valota, A. Losavio, et al “ High Speed Pull Test
Characterization of BGA Solder Joints,” Proc. 7th
International Conference on Thermal, Mechanical and
Multiphysics Simulation and Experiments in Micro-
Electronics and Micro-Systems, 2006. EuroSime 2006.
Milano, Italy, April 2006.
2. C. L. Yeh, Y. S. Lai, “Insights into Correlation Between
Board-level Drop Reliability and Package-level Ball
Impact Test,” Proc. 56th Electronic Components &
Technology Conference, San Diego, CA, June 2006, pp.
455-461.
3. K. Newman, “BGA Brittle Fracture—Alternative Solder
joint Integrity Test Methods,” Proc. 55th Electronic
Components & Technology Conference, Orlando, FL,
June 2005, pp. 1194-1200.
4. JEDEC Standard JESD22-B117A, “Solder Ball Shear,”
October 2006.
5. Julian Yan Hon Chia, et al., “The mechanics of the solder
ball shear test and the effect of shear rate,” Materials
Science and Engineering A 417 2006, pp. 259–274.
6. X. Huang, S. W. R. Lee, C. C. Yan and S. Hui,
“Characterization and Analysis on the Solder Ball Shear
Testing Conditions,” Proc. 51st Electronic Components
& Technology Conference, Orlando, FL, June 2001, pp.
1065-1071.
7. Raiser, G., et al., “Solder Joint Reliability Improvement
Using the Cold Ball Pull Metrology,” Proc InterPACK
'05: Intl Electronic Packaging Technical Conf and
Exhibition, San Francisco, CA, July 17-22, 2005.
8. F. B. Song and S. W. R. Lee, “Investigation of IMC
Thickness Effect on the Lead-free Solder Ball
Attachment Strength-Comparison between Ball Shear
Test and Cold Bump Pull Test Results,” Proc. 56th
Electronic Components & Technology Conference, San
Diego, CA, June 2006, pp. 1196 - 1203.
9. JEDEC Standard JESD22-B111, “Board Level Drop Test
Method of Components for Handheld Electronic
Products,” July 2003.
10. F. B. Song, S. W. R. Lee, K. Newman, B. Sykes and S.
Clark, “Brittle Failure Mechanism of SnAgCu and SnPb
Solder Balls during High Speed Ball Shear and Cold Ball
Pull Test,” Proc. 57th Electronic Components &
Technology Conference, Reno, NV, June 2007.
11. JEDEC Standard JESD22-B110A, “Subassembly
Mechanical Shock,” November 2004.
12. C. Brizer, et al “Drop Test Reliability Improvement of
Lead-free Fine Pitch BGA Using Different Solder Ball
Composition,” Proc. 55th Electronic Components &
Technology Conference, Orlando, FL, June 2005, pp.
1194-1200.
13. Yueli, “High Temperature Aging Affects on Lead Free
CSPs - Drop Test Reliability,” IPC/ JEDEC conf.,
August 2006, Santa Clara, CA.
14. T. C. Chiu, et al “Effect of Thermal Aging on Board
Level Drop Reliability for Pb-free BGA Packages,” Proc.
54th Electronic Components & Technology Conference,
Las Vegas, NV, June 2004, pp. 1256-1262.
15. L. Xu and J. H. L. Pang, “Effect of Imtermetallic and
Kirkendall Voids Growth on Board Level Drop
Reliability for SnAgCu Lead-free BGA Solder Joint,”
Proc. 56th Electronic Components & Technology
Conference, San Diego, CA, June 2006, pp. 275-282.
16. E. H. Wong, et al, “Drop Impact: Fundamentals and
Impact Characterization of Solder Joints,” Proc. 55
th
Electr. Comp. Technol. Conf., Lake Buena Vista, FL,
2005, pp. 1202-1209.
1513 2007 Electronic Components and Technology Conference