High-speed-solder-ball-shear-and-pull-tests.pdf - 第7页
half-sine pulse, was selected for all dro p testing in this evaluation [11]. Choos ing this drop condition was necessarily a comprom ise; too severe and rel ative assessment of vari ous constructions and aging exposures …
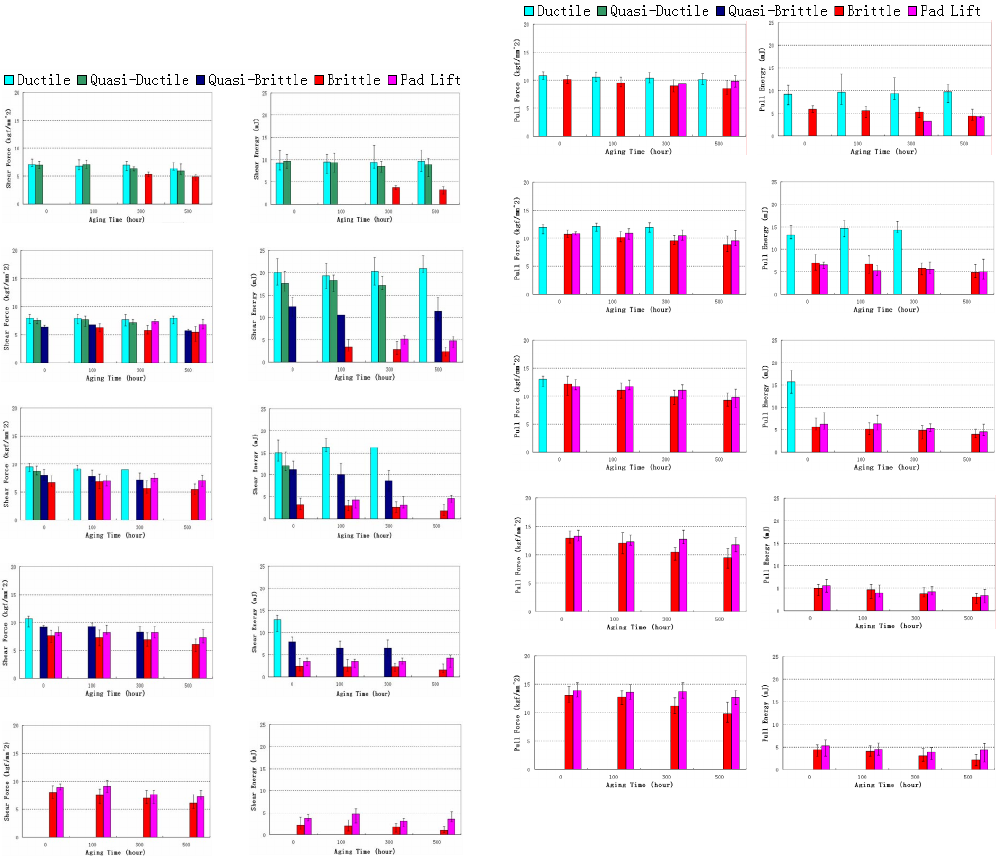
force, confirming early observations using high-speed shear
testing [2, 5, 16]. For example, the difference of force data at
various failure modes is not significant. In contrast, it can be
found that the fracture energies of various failure modes are
obviously different, both on the specimens with ENIG and
OSP pad finishes as shown in Figures 11 and 13 for ball pull
tests. Specifically, compare histograms (e) and (f) of Figure
11; forces (e) are virtually uniform for all the aging times,
even though failure modes have shifted from ductile to brittle
and pad lift, but there is a distinct shift from high energy
values for ductile failures to lower energies for brittle and pad
lift modes as shown in (f). A similar argument applies to
histograms (c) and (d) in Figure 13. Corresponding examples
can be seen for the shear tests in Figures 10 and 12.
(a) Shear force (10 mm/s) (b) Shear Energy (10 mm/s)
(c) Shear force (100 mm/s) (d) Shear Energy (100 mm/s)
(e) Shear force (500 mm/s) (f) Shear Energy (500 mm/s)
(g) Shear force (1000 mm/s) (h) Shear Energy (1000 mm/s)
(i) Shear force (3000 mm/s) (j) Shear Energy (3000 mm/s)
Figure 12. Ball shear strength and energy for different
failure modes as a function of aging time and test speed
(SAC405 + OSP)
3.4 Board Level Drop Testing
As highlighted in the introduction, the primary objective of
this research was to investigate the feasibility of using high-
speed solder ball shear and pull tests as alternative methods to
board level drop testing for evaluating solder joint integrity
under dynamic loading. In order to provide a basis for
comparison to the shear and pull testing of the components, a
series of drop tests were conducted using board assemblies of
identical package lots evaluated by the DAGE 4000HS.
Moreover, these assemblies were aged at 125
o
C (0 to 500
hours). It is important to acknowledge, however, that the IMC
composition and morphology for the solder joints are not
identical between the component and assembly aging studies,
due to the rapid dissolution of Cu on the OSP circuit board
during package attachment.
(a) Pull force (5 mm/s) (b) Pull Energy (5 mm/s)
(c) Pull force (50 mm/s) (d) Pull Energy (50 mm/s)
(e) Pull force (100 mm/s) (f) Pull Energy (100 mm/s)
(g) Pull force (250 mm/s) (h) Pull Energy (250 mm/s)
(i) Pull force (500 mm/s) (j) Pull Energy (500 mm/s)
Figure 13. Ball pull strength and energy of different failure
modes as a function of aging time and test speed (SAC405
+ OSP)
Only a small subset of the total test results are represented
in this paper. Indeed, some of the other test samples failed
much earlier in drop testing than the 316 BGA packages
(primarily due to their much larger size and mass), and a drop
test condition was selected to insure that failures did not occur
as soon as the first cycle. Following preliminary studies, a
JEDEC JESD22-B110A service condition A; 500G, 1.0 ms
1509 2007 Electronic Components and Technology Conference
half-sine pulse, was selected for all drop testing in this
evaluation [11]. Choosing this drop condition was necessarily
a compromise; too severe and relative assessment of various
constructions and aging exposures would be difficult, and too
gentle could introduce potentially significant solder joint
cyclic fatigue effects.
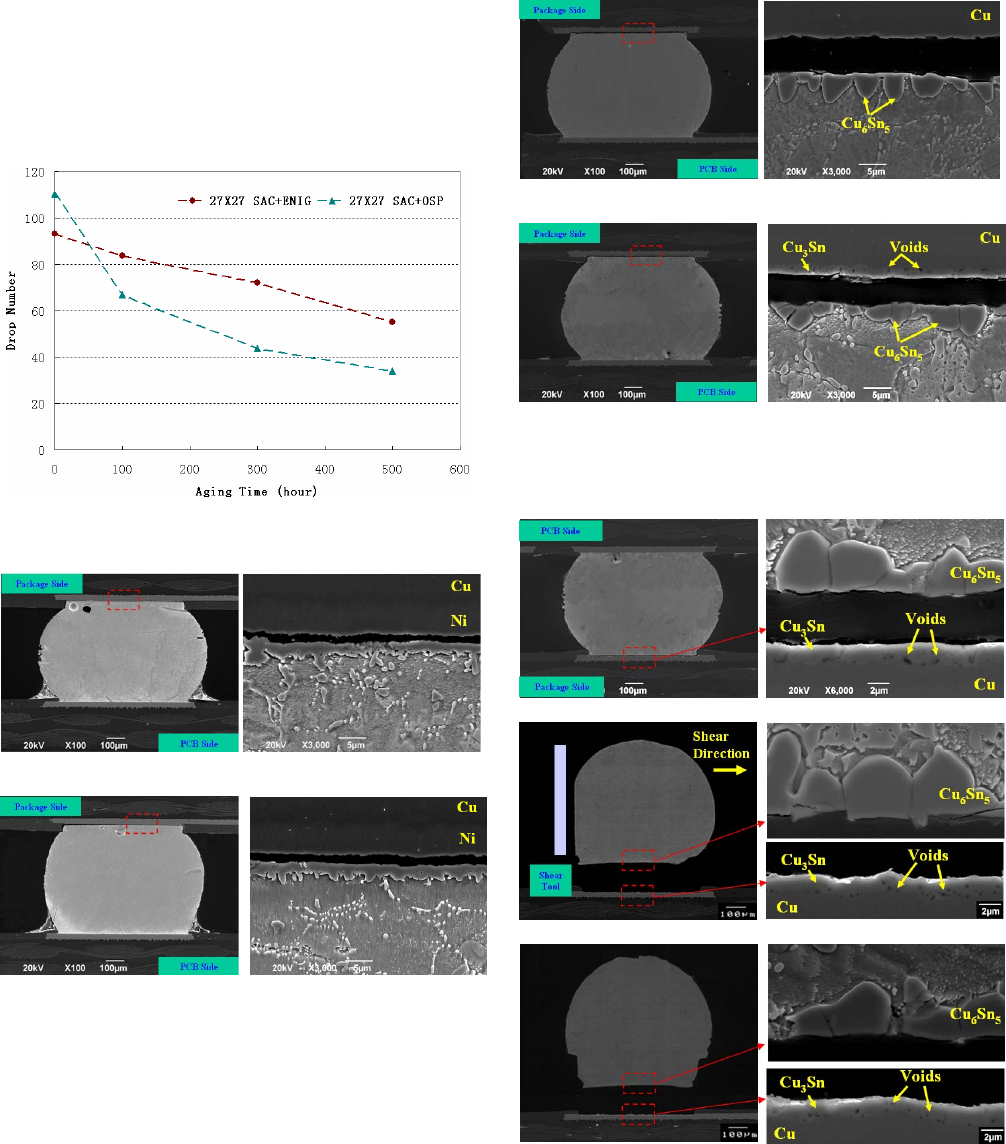
Figure 14. Board level drop lifetime with thermal aging of
SAC405 on different pad finishes
(a) 0 hour aging (b) Close-up view at location
indicated by rectangle in (a)
(c) 500 hours aging (d) Close-up view at location
indicated by rectangle in (c)
Figure 15. IMC interfacial fracture during drop test with
and without 500 hours aging (SAC405 + ENIG)
BLDT test boards were fabricated with both non-solder-
mask-defined (NSMD) and solder-mask-defined (SMD) pad
geometries. In both cases, the solder-wetted pad diameter was
0.684 mm. Although NSMD is more typical of actual
production circuit boards, SMD has the advantage for this
correlation study that the BLDT fracture locations are more
likely to occur at the package side; this is significant because
solder ball shear/pull testing can only evaluate the package
side fractures as the component is unattached to a PCB. This
paper only reports results for the SMD board configuration.
(a) 0 hour aging (b) Close-up view at location
indicated by rectangle in (a)
(c) 500 hours aging (d) Close-up view at location
indicated by rectangle in (c)
Figure 16. IMC interfacial fracture during drop test with
and without 500 hours aging (SAC405 + OSP)
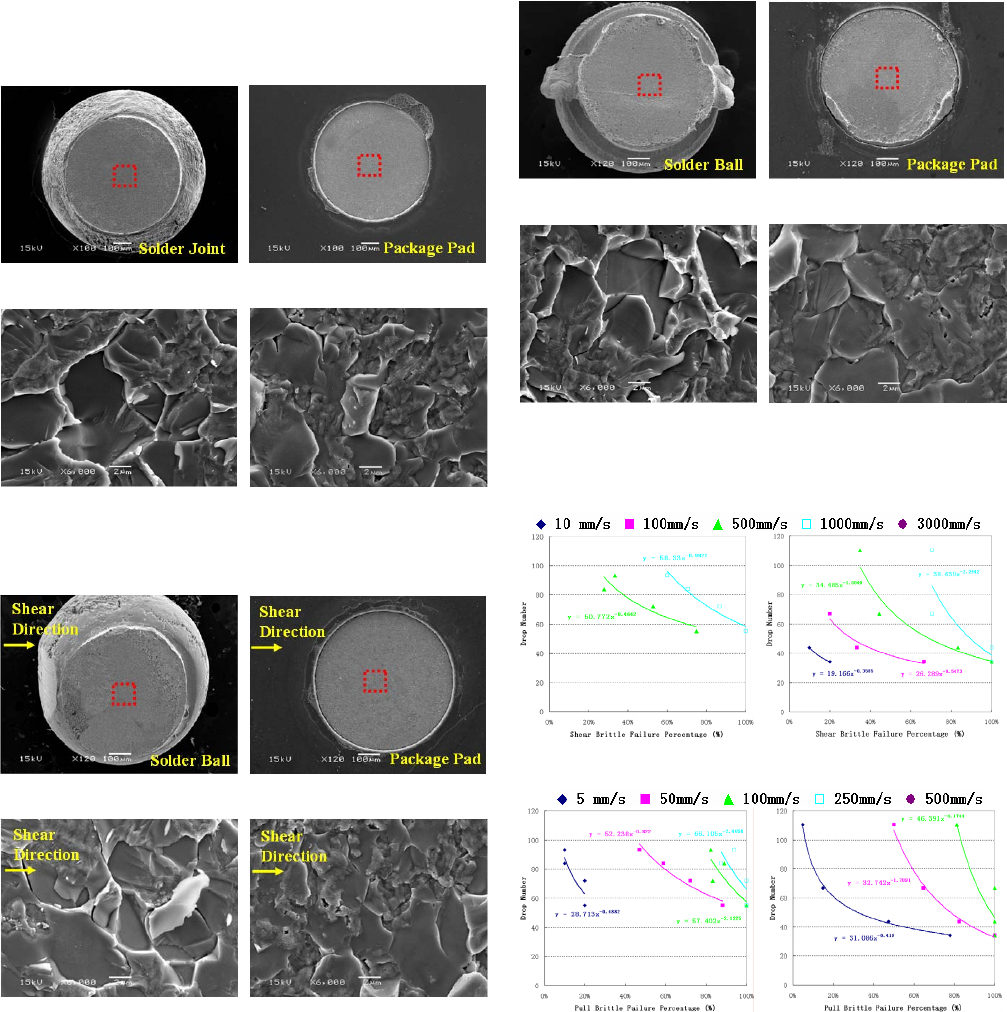
(a) IMC failure during drop test
(b) IMC fracture failure during HS ball shear (500 mm/s)
(b) IMC fracture failure during HS ball pull (50mm/s)
Figure 17. Cross-sectional comparison of failure fracture
during drop test, HS ball shear/pull tests (OSP, 500 hours)
An extremely abbreviated summary of the drop testing
results is shown in Figure 14, identifying the mean value (8
assemblies per data point) of the drops-to-failure for the test
board assemblies. Repeating observations recorded in earlier
work, the drop fracture strength of devices with an OSP
1510 2007 Electronic Components and Technology Conference
package substrate surface finish showed a more rapid
degradation with thermal aging than those with an ENIG
finish [12-16].
(a) Brittle fracture surface of
solder joint
(b) Brittle fracture surface of
the matching pad of (a)
(c) Close-up view at location
indicated by rectangle in (a)
(d) Close-up view at location
indicated by rectangle in (b)
Figure 18. Brittle fracture surface after drop test
(SAC405 + OSP, 500 hours aging)
(a) Brittle fracture surface of
sheared ball
(b) Brittle fracture surface of
the matching pad of (a)
(c) Close-up view at location
indicated by rectangle in (a)
(d) Close-up view at location
indicated by rectangle in (b)
Figure 19. Brittle fracture surface after high-speed ball
shear test (SAC405 + OSP, 500 hours aging, 500 mm/s)
3.5 Correlations between BLDT and High Speed Ball
Shear/Pull Tests
Previous evaluations of high-speed solder ball shear and
pull testing have observed brittle fractures that appeared
similar to the brittle fracture mode observed in BLDT
assemblies, but little definitive cross-sectional evidence has
been provided. Partly this has been due to the difficulty of
such studies, both in terms of retrieval of individual sheared
or pulled balls and matching them to their corresponding pad,
and the subsequent cross-sectional work.
(a) Brittle fracture surface of
pulled ball
(b) Brittle fracture surface of
the matching pad of (a)
(c) Close-up view at location
indicated by rectangle in (a)
(d) Close-up view at location
indicated by rectangle in (b)
Figure 20. Brittle fracture surface after high-speed ball pull
test (SAC405 + OSP, 500 hours aging, 50 mm/s)
(a) Ball shear (ENIG) (b) Ball shear (OSP)
(c) Ball pull (ENIG) (d) Ball pull (OSP)
Figure 21. Correlation of drops-to-failure and brittle failure
percentage of ball shear and pull tests at different test
speeds.
Notes: (i) All failures in drop test are brittle fractures.
(ii) The curves disappear if the brittle failure percentage
(ball shear and pull) at different aging time rises to 100%,
e.g. 3000 mm/s for ball shear and 500 mm/s for ball pull.
In this paper, painstaking effort has resulted in the
definitive images shown in Figures 15 to 20. From the failure
analysis of drop test specimens as shown in Figures 15 and
16, the brittle failure on the ENIG was induced between the
IMC and the Ni layers. For the OSP specimens without aging
(with two times reflow), the brittle failure was found between
1511 2007 Electronic Components and Technology Conference