4OM-1011-002.pdf - 第64页
0305-001 Tg0860-PM-MM TO T AL P .E.C. RECOGNITION ERRORS Shown is the total number of errors detected by the P .E.C. recognition function. The number of errors detected by the global P .E.C. recog- nition function and th…
0305-001 Tg0860-PM-MM
Third Page
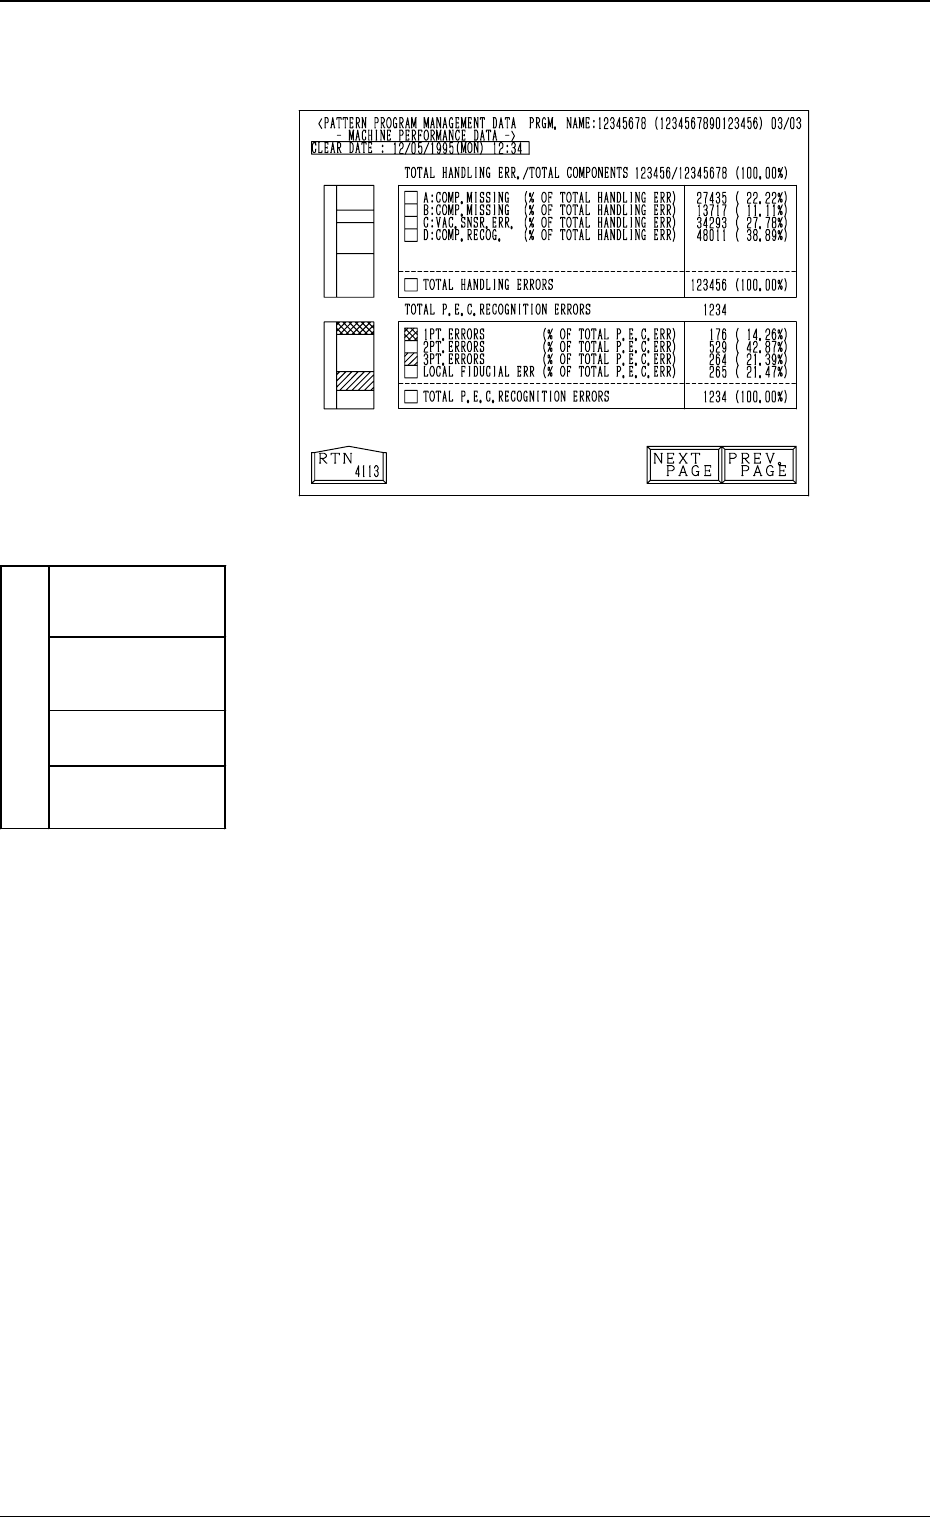
TOTAL HANDLING ERR./TOTAL COMPONENTS
Shown are the total number of pick-up errors, the total num-
ber of components to be picked up, and the percentage of
picked components per total number of pick-up errors.
COMP. MISSING (% OF TOTAL HANDLING ERR)
Shown are the number of component missing errors
detected by the vacuum sensor and the percentage of
component missing errors per total number of pick-
up errors.
COMP. MISSING (% OF TOTAL HANDLING ERR)
Shown are the number of component missing errors
detected in the recognition process and the percent-
age of component missing errors per total number of
pick-up errors.
VAC. SNSR. ERR. (% OF TOTAL HANDLING ERR)
Shown are the number of component pick-up errors
detected by the vacuum sensor (errors not detected
through the component recognition) and the percent-
age of the component pick-up errors per total number
of pick-up errors.
COMP. RECOG. (% OF TOTAL HANDLING ERR)
Shown are the number of errors detected in the rec-
ognition process and the percentage of errors per to-
tal number of pick-up errors.
Each parameter allocated to the
total handling error area is classi-
fied by colors and charted by col-
umns.
Data is updated every 5 seconds.
COMP. MISSING
(Sensor) (Sky Blue)
COMP. MISSING
(Recognition)
(Yellow)
VAC. SNSR. ERR.
(Green)
TOTAL HANDLING ERR.
(Magenta)
COMP. RECOG.
(Dark Gray)
3.1 PATTERN PROGRAM MANAGEMENT DATA Display
Fig. 4C13
3-12
Fig. 4C14
0305-001 Tg0860-PM-MM
TOTAL P.E.C. RECOGNITION ERRORS
Shown is the total number of errors detected by the P.E.C.
recognition function.
The number of errors detected by the global P.E.C. recog-
nition function and the number of errors detected by the
B.B.R. recognition function are added and displayed.
1PT. ERRORS (% OF TOTAL P.E.C. ERR)
Shown are the total number of errors detected on the
first fiducial mark and the percentage of the detected
errors per total number of all errors detected by the
P.E.C. recognition function.
2PT. ERRORS (% OF TOTAL P.E.C. ERR)
Shown are the total number of errors detected on the
second fiducial mark and the percentage of the de-
tected errors per total number of all errors detected
by the P.E.C. recognition function.
3PT. ERRORS (% OF TOTAL P.E.C. ERR)
Shown are the total number of errors detected on the
third fiducial mark and the percentage of the detected
errors per total number of all errors detected by the
P.E.C. recognition function.
LOCAL FIDUCIAL ERR (% OF TOTAL P.E.C. ERR)
Shown are the total number of recognition errors in
each individual components and the percentage of the
detected errors per total number of all errors detected
by the P.E.C. recognition function.
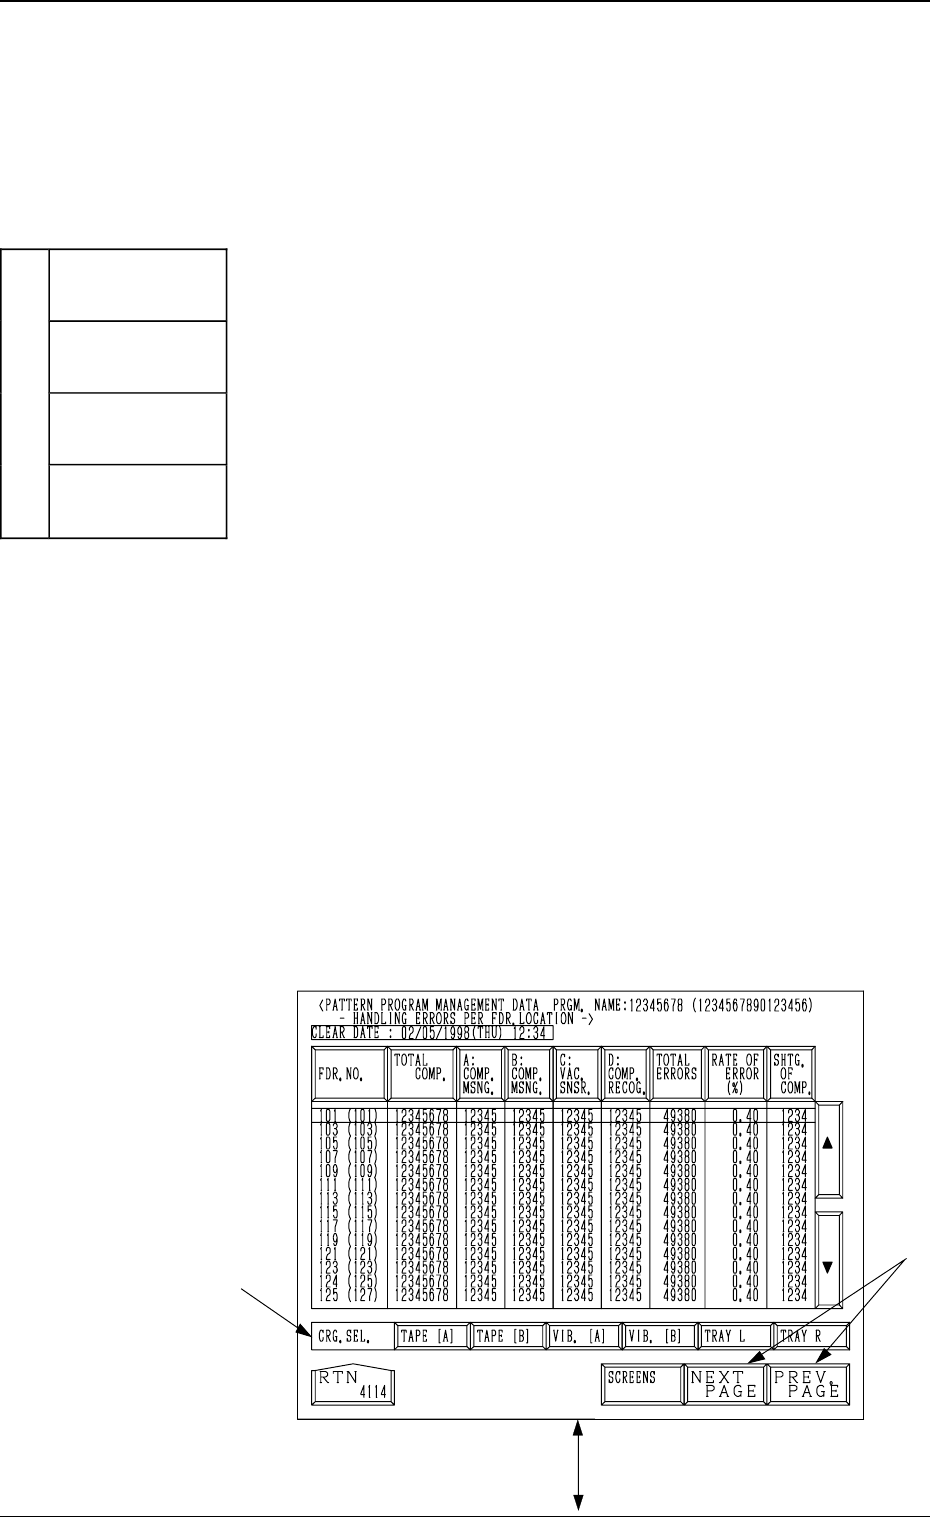
(3) Handling Errors Per Feeder Location
When the pattern program to be checked is selected by
pressing the corresponding “NAMES (XX/XX)” key and
the [HANDLING ERR. PER FDR. LCTN.] key is pressed,
the following display appears on the screen.
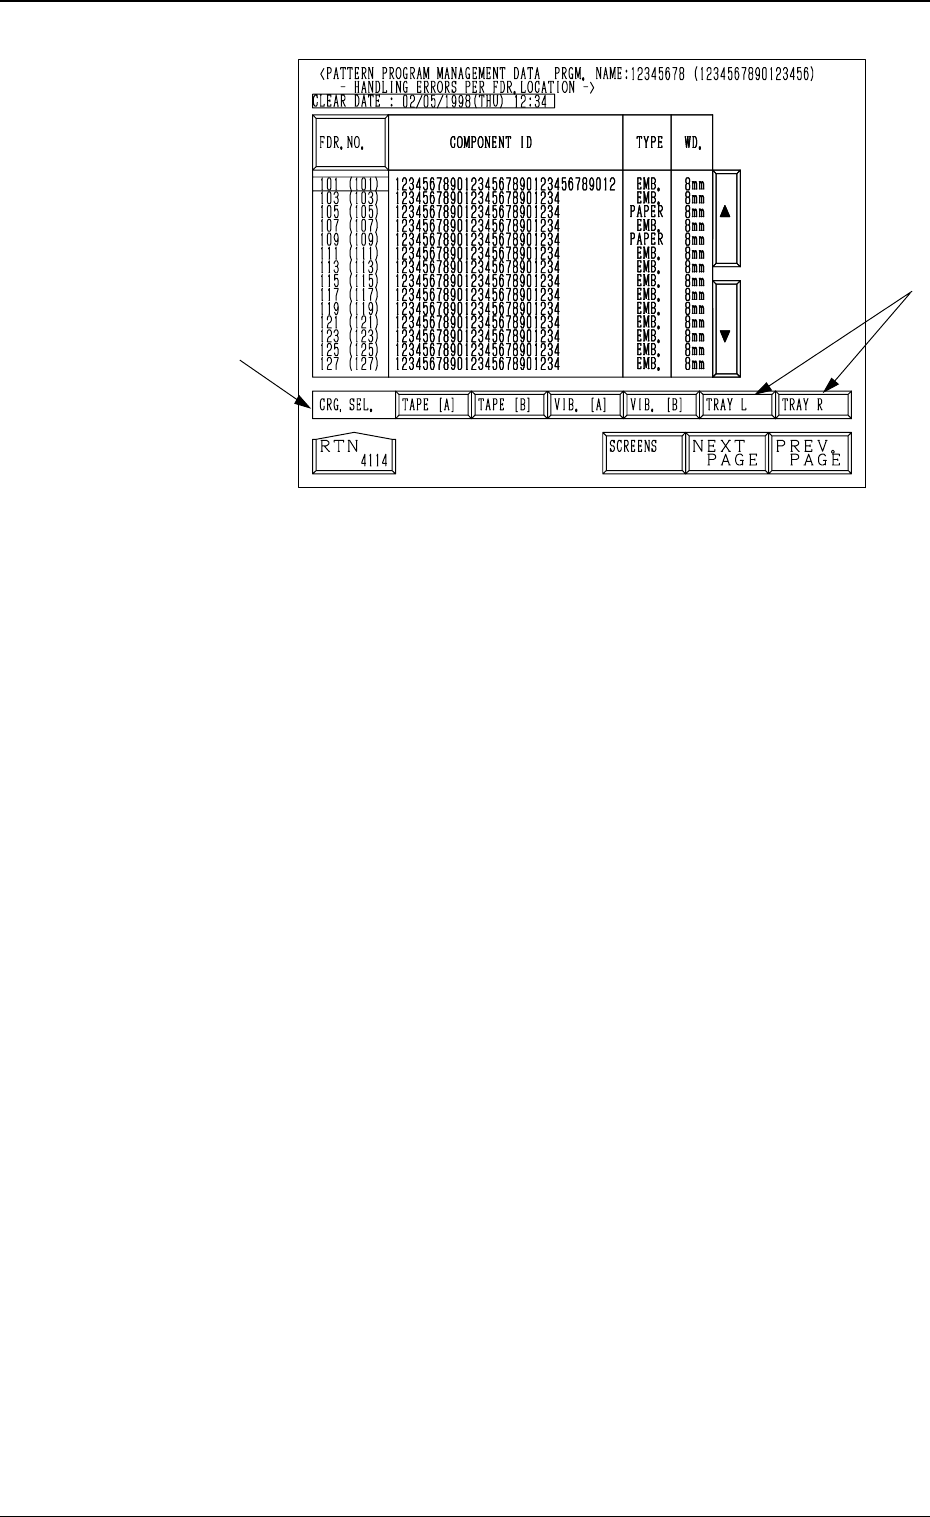
Every time the [SCREENS] key is pressed, another dis-
play appears on the screen.
Note: The -marked items are optional.
Fig. 4C16
*A
[SCREENS] Key
3.1 PATTERN PROGRAM MANAGEMENT DATA Display
3-13
Each parameter allocated to the
total P.E.C. recognition error area
is classified by colors and charted
by columns.
(Data is updated every 5 seconds.)
1PT. ERRORS
(Blue)
2PT. ERRORS
(Light Green)
3PT. ERRORS
(Blue)
TOTAL P.E.C. RECOGNITION
ERRORS (Light Red)
LOCAL
FIDUCIAL ERR
(Light Gray)
Fig. 4C15
0305-001 Tg0860-PM-MM
•
When one of the data keys is pressed, the feeder No. with
the biggest parameter under the selected data key is dis-
played in the first line and feeder Nos. having the subse-
quent (second, third, fourth, ...) biggest parameters follow.
Parameters are displayed in order of error counts, making
it easy to analyze and improve production rate.
When the [FDR. NO.] key is pressed, the parameters are
re-arranged in the default order (ascending order of feeder
Nos.).
•
When one of the carriage selection keys ([TAPE (A)],
[TAPE (B)], [TRAY L] (Option), and [TRAY R] (Option)
keys) is pressed, the parameters related to the selected feeder
carriage are displayed.
[FDR. NO.] Key
Shown under this key are the feeder Nos.
The numbers in ( ) indicate the actual feeder Nos. where
the offset data is added.
[TOTAL COMP.] Key
Shown is the total number of components (the number of
pick-up operations) picked at each feeder.
[A: COMP. MSNG.] Key
Shown is the total number of missing components detected
by the vacuum sensor for each lane (feeder slot No.).
[B: COMP. MSNG.] Key
Shown is the total number of missing components detected
in the recognition processing for each individual feeders.
[C: VAC. SNSR.] Key
Shown is the total number of component pick-up errors de-
tected by the vacuum sensor (errors not detected through
the component recognition) for each individual feeders.
[D: COMP. RECOG.] Key
Shown is the total number of recognition errors detected in
the recognition processing for each individual feeders.
[TOTAL ERRORS] Key
Shown is the total number of errors detected by the above-
described functions ([A: COMP. MSNG.] through [D:
COMP. RECOG.] Keys).
Fig. 4C17
*A
3.1 PATTERN PROGRAM MANAGEMENT DATA Display
3-14