VI User Manual.pdf - 第196页
Tools library 7 - 34 Vision 2007 4.10 User Manual Re v 01 Joint: Histogram parameters Activatio n of solder j oint test ( G ): activate or deactivate the joint test. End of lead realign ( H ): activate or deactivate hist…
Tools library
Vision 2007 4.10 User Manual Rev 01 7 - 33
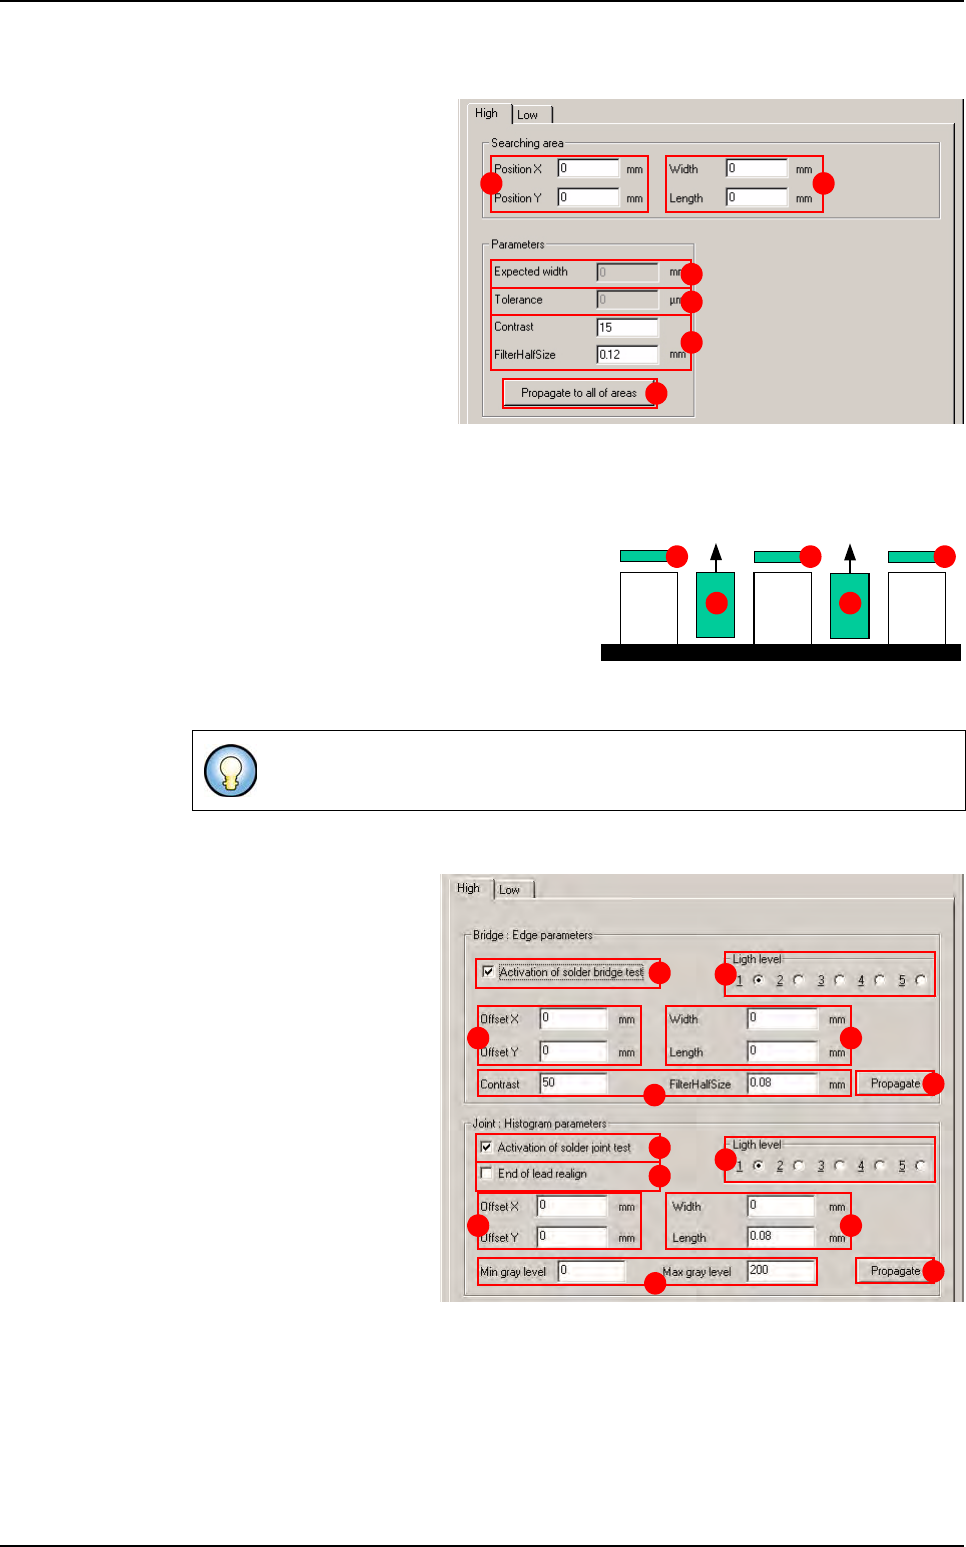
Searching area
Position X & Y (A): offset for
all edges.
Width & length
(
B
): edges size.
Parameters
Expected width (C): lead
width.
Tolerance (D) on the ex-
pected width.
Contrast & Half size filter
(E): edge parameters used.
Propagate to all of areas
(F) button: propagation to
the other tab.
7.7.5.4 Solder joint and bridge detection
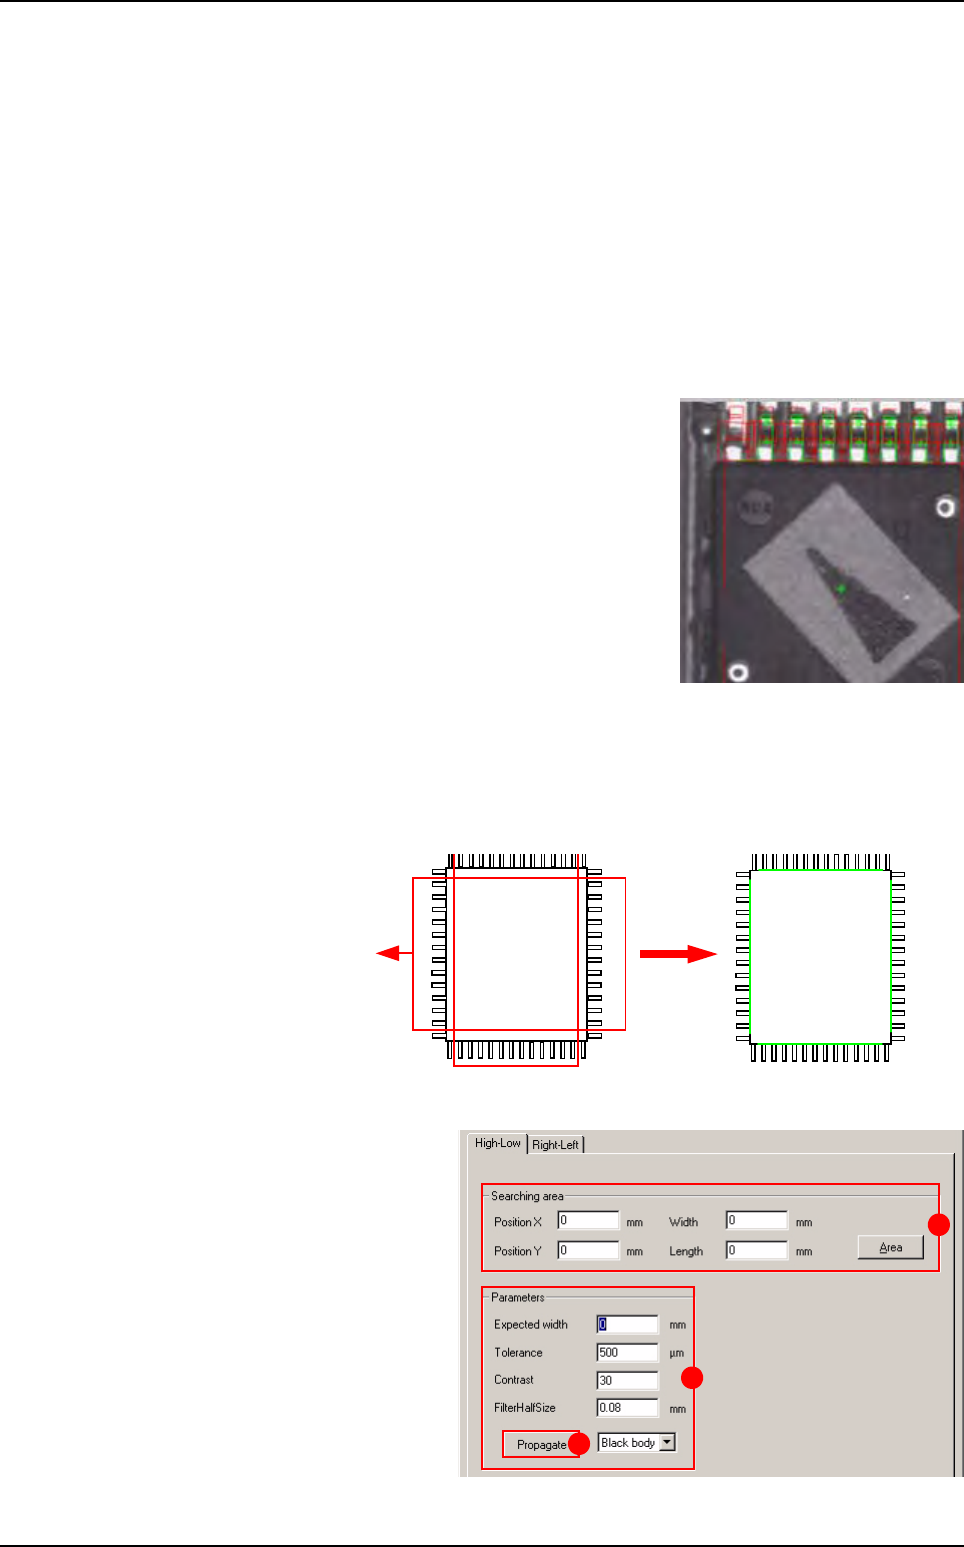
With Solder joint and bridge detection, a
histogram (A) is automatically positioned at
the end of each lead for the weld joints and an
edge (B) between each lead for solder bridge
detection.
With this window, you can adjust the parameters of the histograms and the edges which
check the joints and solder bridges.
Bridge: Edge parameters
Activation of solder
bridge test (A): activate or
deactivate the bridge test.
Light level (B): light level
for the bridge detection.
Offset X & Y (C): offset for
all edges.
Width & Length (D): edg-
es size.
Contrast & Half size filter
(E): edge parameters
used.
Propagate (F) button:
propagate the edge pa-
rameters to the other sides
of the component.
Declare 2 sides of the model.
A B
C
D
E
F
A A A
BB
C D
E
B
A
F
J K
L
I
G
M
H
SO or QFP model
Tools library
7 - 34 Vision 2007 4.10 User Manual Rev 01
Joint: Histogram parameters
Activation of solder joint test (G): activate or deactivate the joint test.
End of lead realign (H): activate or deactivate histogram positioning with regard to the
end of lead detection results.
Light level ( I ): light level for the solder joint detection.
Offset X & Y (J): offset for all histograms.
Width & Length (K): histogram size.
Min & Max gray level (L): histogram parameters used.
Propagate (F) button: propagate the histogram parameters to the other sides of the com-
ponent.
Welding fault, the histogram is shown in red.
7.7.6 QFP
The QFP tool returns the (X, Y, θ) position of the component with the joint faults and welding
bridge faults.
7.7.6.1 Body detection
Body detection is
performed by a
double transition
edge in both direc-
tions (X and Y).
This window appears when
you click on the Body detec-
tion button. In the Body de-
tection window, Searching
area (A) and Parameters
(B) are the same that for SO
(see § 6.7.5.1 Body detec-
tion).
Propagate to all of areas
(C) button: propagation to
the other tab.
Pos X2Pos X1
Pos Y1
Pos Y2
Transition: white
Î
black and black
Î
white
B
A
C
SO or QFP model
Tools library
Vision 2007 4.10 User Manual Rev 01 7 - 35
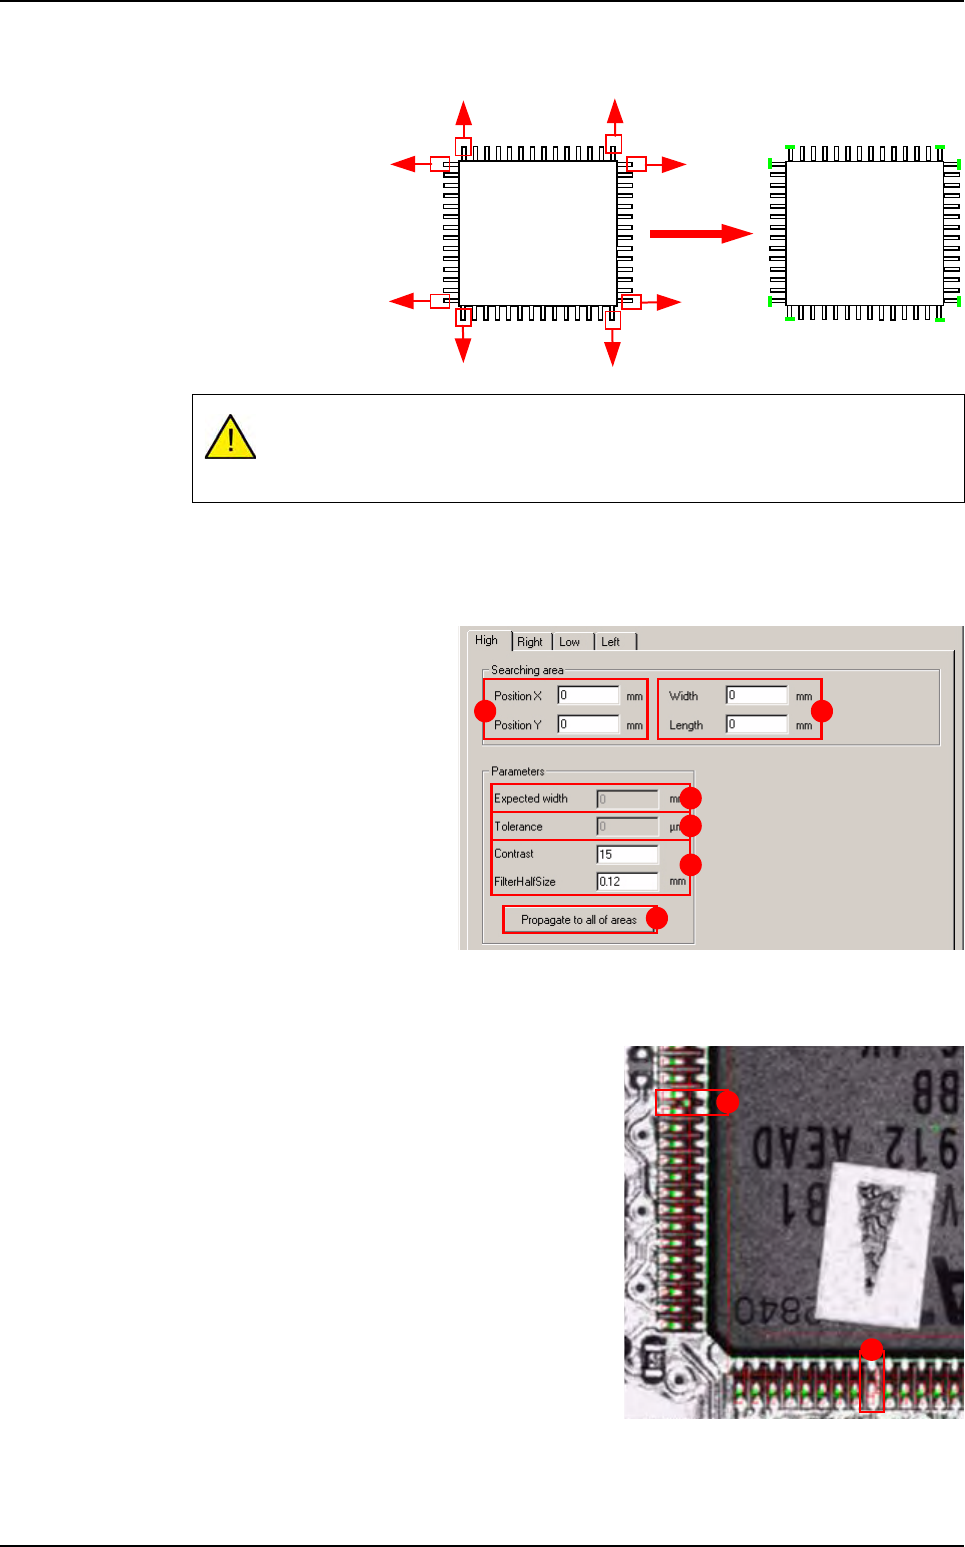
7.7.6.2 Accurate detection of the component position
This position is cal-
culated from the
edges that are posi-
tioned at either end
of the component
lead.
The next window appears when you click on the Accurate detection of component po-
sition button.
Searching area
Position X & Y (A): position
offset of the double transition
edge.
Width & Length
(
B
): edge size.
Parameters
Expected width
(
C
) of the com-
ponent body.
Tolerance
(
D
) on the expect-
ed width.
Contrast & Filter Half Size
(E): edge parameters used.
Propagate to all of areas (F) button: propagation to the other tabs.
7.7.6.3 Solder joint and bridge detection
This treatment is performed in the same way as
for the SO tool, except that the edges and histo-
grams are positioned on the 4 sides of the com-
ponent.
Solder bridge (A).
Faulty weld joint (B).
This diagram only shows 8 edges positioned, but the tool positions one for each
lead. With the position of each lead end, the exact position (X, Y,
θ) of the com-
ponent can be calculated.
Score
by contrast
A B
C
D
E
F
A
B
SO or QFP model