mi14061267.pdf - 第13页
Micromachines 2023 , 14 , 1267 13 of 17 Micromachines 20 23 , 14 , x FOR PEER REVIEW 22 of 28 Corresponding to the a b ov e si mul a t i on a n al y s is, the experimental parameter s ar e se t as fo llow s : v o lt age …
Micromachines 2023, 14, 1267 12 of 17
can be reached; that is, the device proposed in this work has both high efficiency and high
precision.
4. Experiment Test
In the above section, the basic mechanism of micro-droplet injection is explained
through ANSYS two-phase, two-way fluid–structure coupling analysis, and the influence
of various parameters on the device
0
s injection performance is analyzed. In this section, an
experimental system will be set up to shoot micro-droplet injection videos with industrial
cameras to further verify the feasibility of the proposed device.
In order to verify the feasibility of the proposed device, the experimental system is
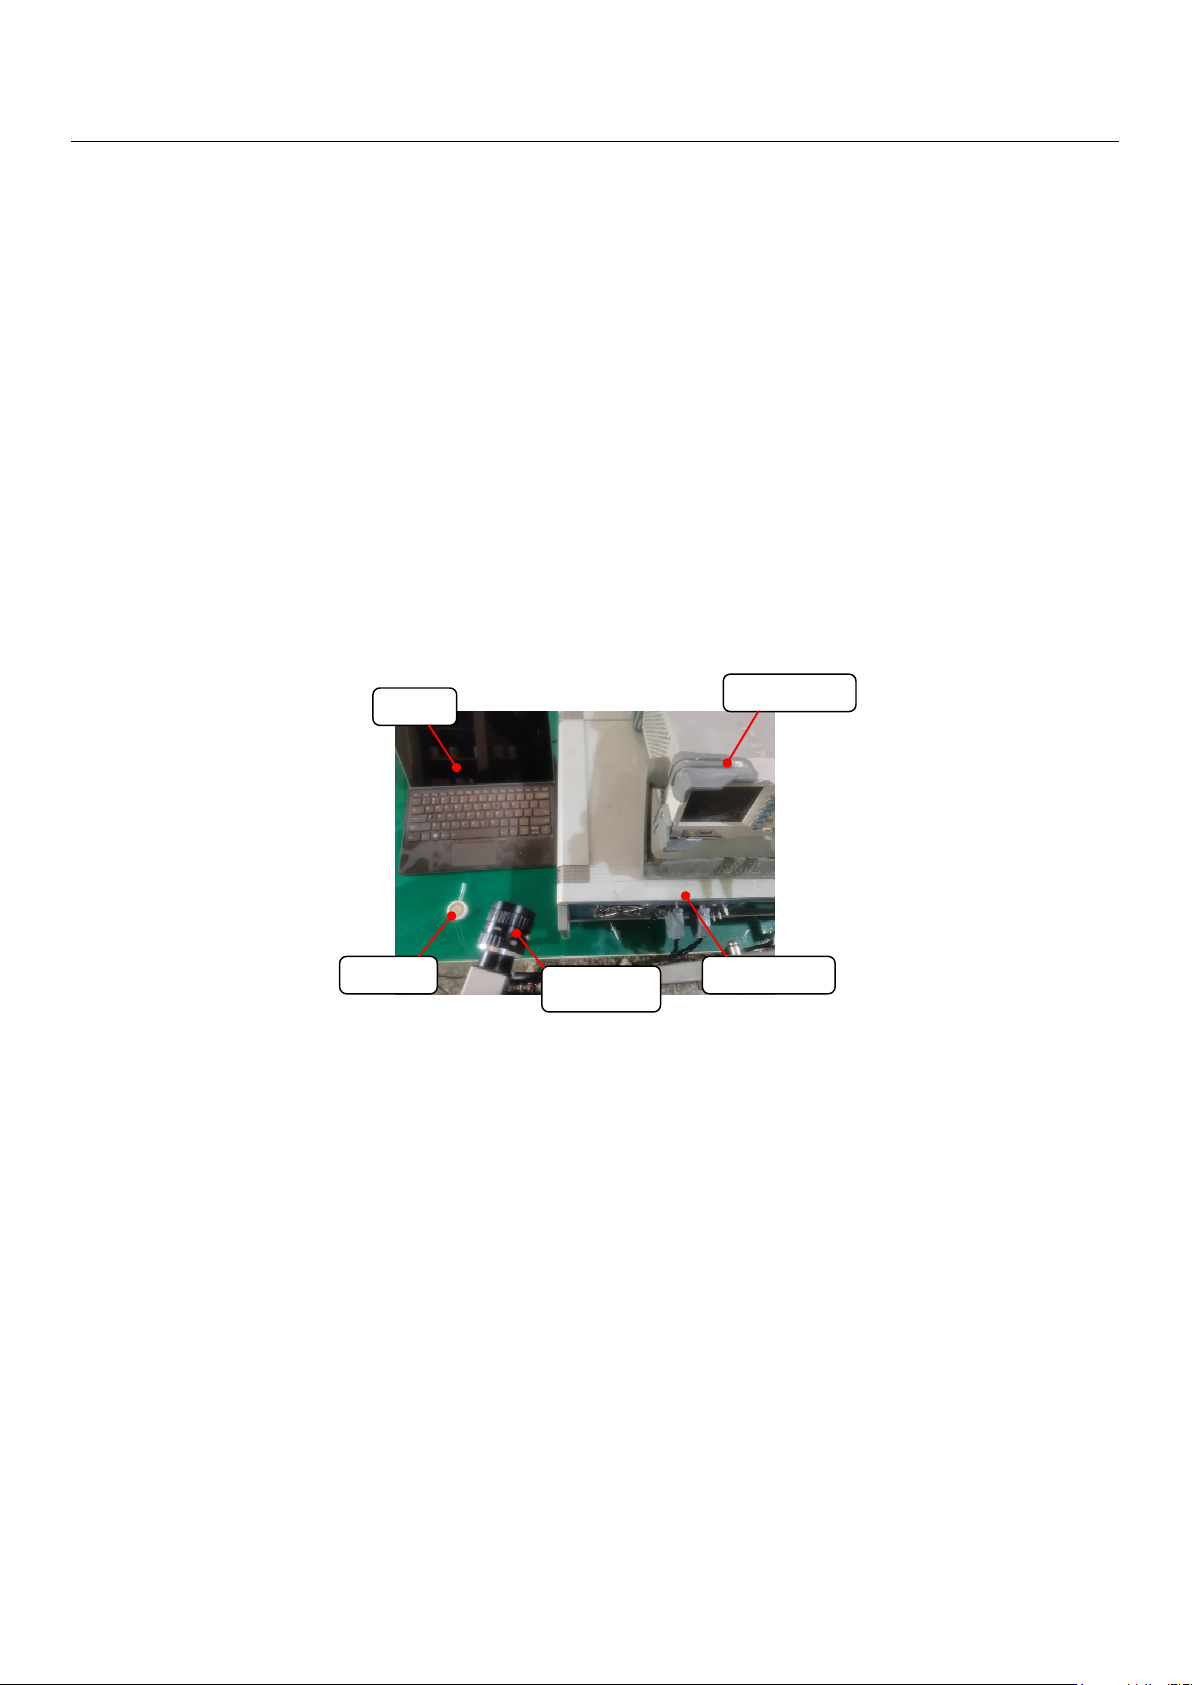
built, as shown in Figure 20. The experimental system mainly consists of a prototype, a
personal computer (PC), a signal generator (DG4162, RIGOL, Beijing, China), a power
amplifier (ATA-4051, Aigtek Inc., Xi’an, China) and an industrial camera. The experimental
steps are as follows: firstly, the prototype is injected with a certain viscosity of viscosity
lubrication oil; then, a given square wave signal is applied in the prototype through the
signal generator and power amplifier, and then, the industrial camera is started to record
the injection process. Finally, the video taken with the industrial camera is exported and
analyzed using the PC.
Micromachines 2023, 14, x FOR PEER REVIEW 21 of 28
PC
Prototype
Industrial
camera
Signal generator
Power amplifier
Figure 20. The experimental system.
Figure 20. The experimental system.
Corresponding to the above simulation analysis, the experimental parameters are
set as follows: voltage amplitude, 100 V; square wave signal frequency, 728 Hz; nozzle
diameter, 0.4 mm; fluid viscosity, 200 Pa.s. The results of the injection experiment are shown
in Figure 21. Figure 21a shows the state of the piezoelectric micro-jet device when it is not
working, and Figure 21b–d are the injection diagrams of the piezoelectric micro-jet device
after the given square wave signal is applied. Figure 21b–d, respectively, correspond to the
droplet just being squeezed out of the nozzle, the droplet separating from the oil and being
ejected and forming satellite droplets, which are in accordance with the simulation in the
above section, further verifying the correctness of the injection mechanism revealed. It can
be seen from the observation that after the device works, the size of the droplets ejected
is uniform and the injection state is stable, which can realize long-term continuous and
stable injection, which confirms the correctness of the piezoelectric micro-jet principle and
the feasibility of the proposed piezoelectric micro-jet device. The experimental video is
attached as Video S1.
Micromachines 2023, 14, 1267 13 of 17
Micromachines 2023, 14, x FOR PEER REVIEW 22 of 28
Corresponding to the above simulation analysis, the experimental parameters are set
as follows: voltage amplitude, 100 V; square wave signal frequency, 728 Hz; nozzle diam-
eter, 0.4 mm; fluid viscosity, 200 Pa.s. The results of the injection experiment are shown in
Figure 21. Figure 21a shows the state of the piezoelectric micro-jet device when it is not
working, and Figure 21b–d are the injection diagrams of the piezoelectric micro-jet device
after the given square wave signal is applied. Figure 21b–d, respectively, correspond to
the droplet just being squeezed out of the nozzle, the droplet separating from the oil and
being ejected and forming satellite droplets, which are in accordance with the simulation
in the above section, further verifying the correctness of the injection mechanism revealed.
It can be seen from the observation that after the device works, the size of the droplets
ejected is uniform and the injection state is stable, which can realize long-term continuous
and stable injection, which confirms the correctness of the piezoelectric micro-jet principle
and the feasibility of the proposed piezoelectric micro-jet device. The experimental video
is aached as Video S1.
When the device is
not working
When the device is applied a given square wave signal
a
b
cd
Figure 21. The results of the injection experiment: (a) The state of the piezoelectric micro-jet device
when it is not working; (b) the droplet just being squeezed out of the nozzle; (c) the droplet sepa-
rating from the oil and being ejected; (d) the formation of satellite droplets.
In this work, the verification experiment is carried out according to the simulation
content in the previous part. The main research is to investigate the outlet velocity and
droplet volume of the piezoelectric micro-jet device under different voltage amplitudes,
signal frequencies, oil viscosities and nozzle diameters. The standard experimental condi-
tions are set as follows: voltage amplitude, 100 V; signal frequency, 8090 Hz; nozzle diam-
eter, 0.4 mm; oil viscosity, 200 Pa.s. The experimental results of the effects of voltage am-
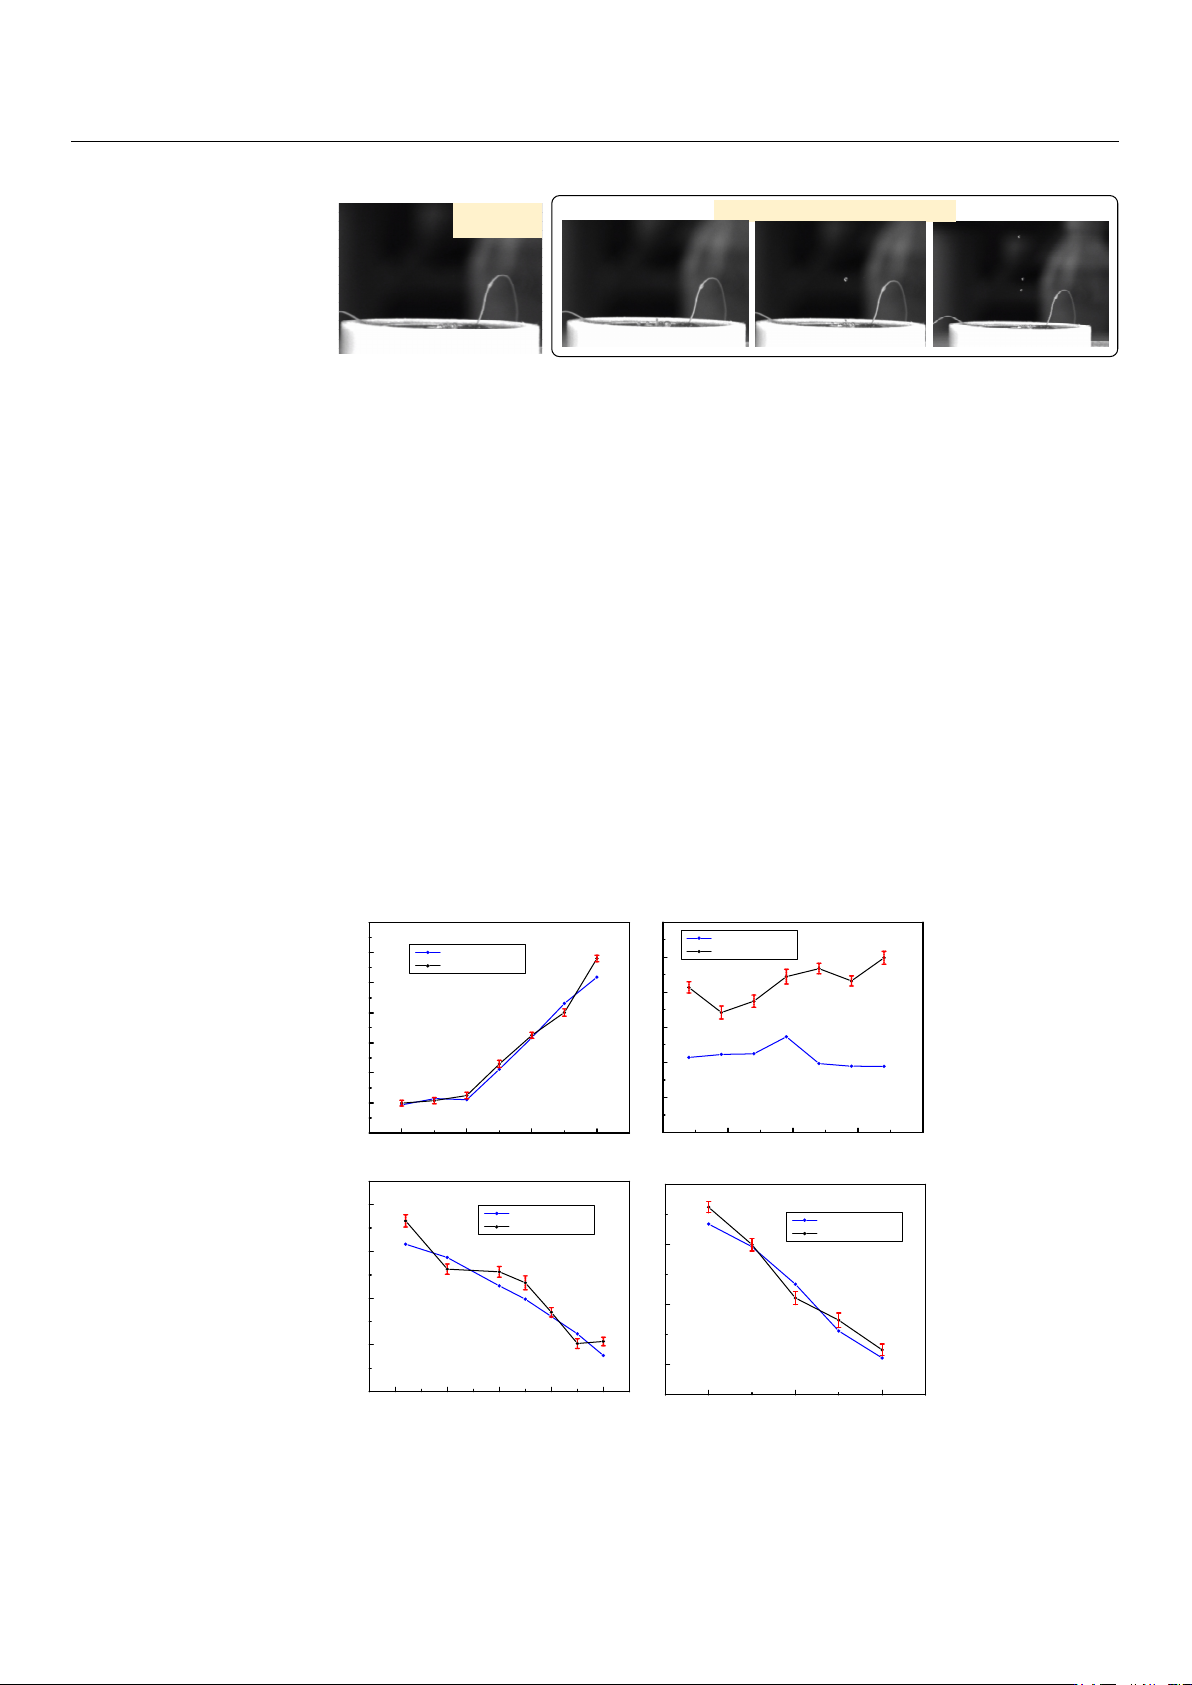
plitude, signal frequency, oil viscosity and nozzle diameter on droplet outlet velocity
when other experimental conditions remain unchanged are shown in Figure 22. The ex-
perimental results are consistent with the simulation results in the above part, and the
errors are all within the acceptable range. The maximum error of Figure 22a–d is 11.93%,
11.53%, 8.797% and 11.55%, respectively. The experimental results of the effects of voltage
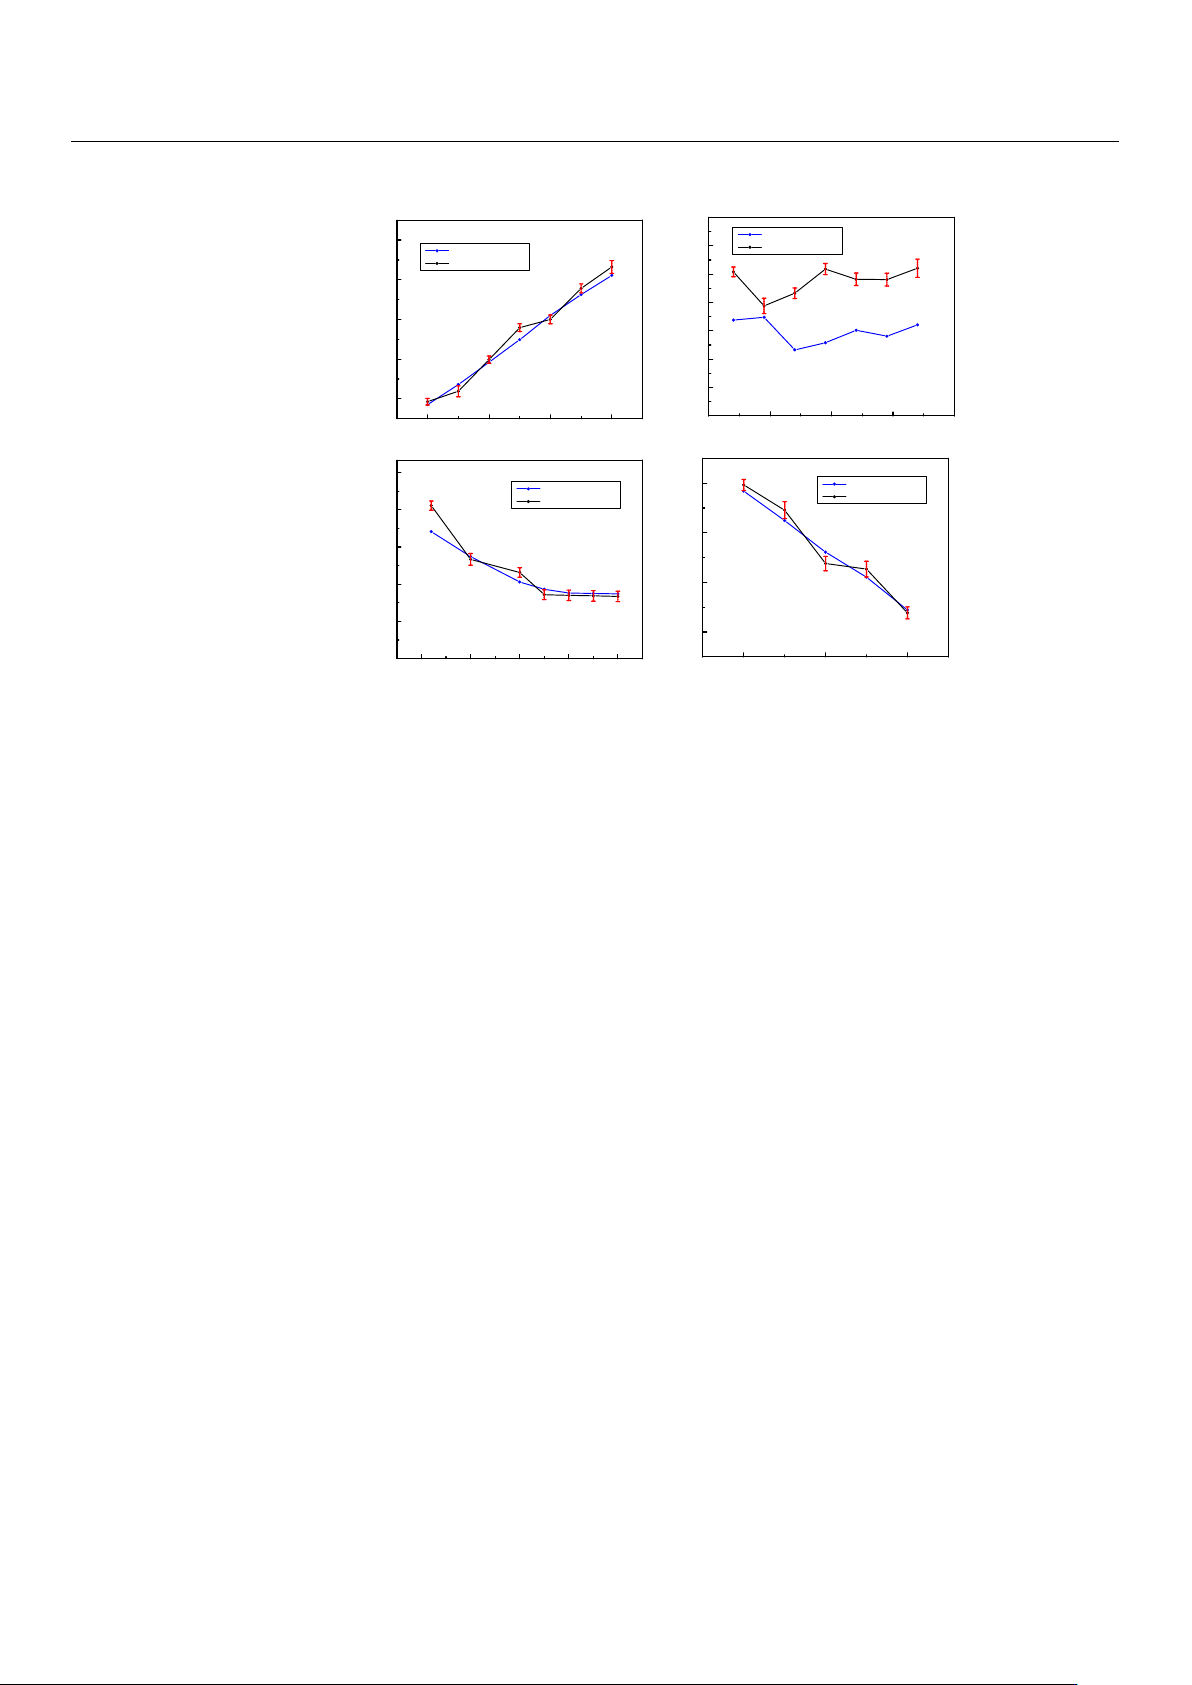
amplitude, signal frequency, oil viscosity and nozzle diameter on droplet volume when
other experimental conditions remain unchanged are shown in Figure 23. The experi-
mental results are consistent with the simulation results in the above section, and the er-
rors are all within the acceptable range. The maximum error in Figure 23a–d is 12.17%,
6.92%, 4.86% and 9.61%, respectively.
Figure 21.
The results of the injection experiment: (
a
) The state of the piezoelectric micro-jet device
when it is not working; (
b
) the droplet just being squeezed out of the nozzle; (
c
) the droplet separating
from the oil and being ejected; (d) the formation of satellite droplets.
In this work, the verification experiment is carried out according to the simulation
content in the previous part. The main research is to investigate the outlet velocity and
droplet volume of the piezoelectric micro-jet device under different voltage amplitudes,
signal frequencies, oil viscosities and nozzle diameters. The standard experimental con-
ditions are set as follows: voltage amplitude, 100 V; signal frequency, 8090 Hz; nozzle
diameter, 0.4 mm; oil viscosity, 200 Pa.s. The experimental results of the effects of voltage
amplitude, signal frequency, oil viscosity and nozzle diameter on droplet outlet velocity
when other experimental conditions remain unchanged are shown in Figure 22. The ex-
perimental results are consistent with the simulation results in the above part, and the
errors are all within the acceptable range. The maximum error of Figure 22a–d is 11.93%,
11.53%, 8.797% and 11.55%, respectively. The experimental results of the effects of voltage
amplitude, signal frequency, oil viscosity and nozzle diameter on droplet volume when
other experimental conditions remain unchanged are shown in Figure 23. The experimental
results are consistent with the simulation results in the above section, and the errors are all
within the acceptable range. The maximum error in Figure 23a–d is 12.17%, 6.92%, 4.86%
and 9.61%, respectively.
Micromachines 2023, 14, x FOR PEER REVIEW 23 of 28
50 100 150 200
0
5
10
15
20
25
30
35
Velocity (m/s)
Voltage amplitude (V)
7900 8000 8100 8200 8300
5.0
5.2
5.4
5.6
5.8
6.0
6.2
Velocity ( m/s)
Signal frequency (Hz)
0 50 100 150 200
4
6
8
10
12
Velocity (m/s)
Oil viscosity (cs)
0.2 0.3 0.4
5
10
15
20
Velocity (m/s)
Nozzle diameter (m)
Simulation result
Experimental result
a
b
c
d
Simulation result
Exp erimental result
Simulation result
Experimental result
Simulation result
Experimental result
Figure 22. The experimental results of voltage amplitude, signal frequency, oil viscosity and nozzle
diameter on droplet outlet velocity: (a) The experimental results of voltage amplitude on droplet
outlet velocity; (b) the experimental results of signal frequency on droplet outlet velocity; (c) the
experimental results of oil viscosity on droplet outlet velocity; (d) the experimental results of nozzle
diameter on droplet outlet velocity.
Figure 22.
The experimental results of voltage amplitude, signal frequency, oil viscosity and nozzle
diameter on droplet outlet velocity: (
a
) The experimental results of voltage amplitude on droplet
outlet velocity; (
b
) the experimental results of signal frequency on droplet outlet velocity; (
c
) the
experimental results of oil viscosity on droplet outlet velocity; (
d
) the experimental results of nozzle
diameter on droplet outlet velocity.
Micromachines 2023, 14, 1267 14 of 17
Micromachines 2023, 14, x FOR PEER REVIEW 24 of 28
50 100 150 200
Droplet volume (L)
Voltage amplitude (V)
7900 8000 8100 8200 8300
Droplet volume (L)
Signal frequency (Hz)
0 50 100 150 200
Droplet volume (L)
Oil viscosity (cs)
0.2 0.3 0.4
Droplet volume (L)
Nozzle diameter (m)
a
b
c
d
Simulation result
Exp erimenta l result
Simulation result
Exp erimenta l result
Simulation result
Exp erime ntal result
Simulation result
Experimental result
7
110
−
×
8
810
−
×
8
610
−
×
8
410
−
×
8
210
−
×
8
4.2 10
−
×
8
4.1 10
−
×
8
4.0 10
−
×
8
3.9 10
−
×
8
3.8 10
−
×
8
3.7 10
−
×
8
3.6 10
−
×
8
3.5 10
−
×
8
4.8 10
−
×
8
4.5 10
−
×
8
4.2 10
−
×
8
3.9 10
−
×
8
3.6 10
−
×
8
3.3 10
−
×
8
410
−
×
8
210
−
×
8
310
−
×
8
110
−
×
Figure 23. The experimental results of voltage amplitude, signal frequency, oil viscosity and nozzle
diameter on droplet volume: (a) The experimental results of voltage amplitude on droplet volume;
(b) the experimental results of signal frequency on droplet volume; (c) the experimental results of
oil viscosity on droplet volume; (d) the experimental results of nozzle diameter on droplet volume.
Figure 23.
The experimental results of voltage amplitude, signal frequency, oil viscosity and nozzle
diameter on droplet volume: (
a
) The experimental results of voltage amplitude on droplet volume;
(
b
) the experimental results of signal frequency on droplet volume; (
c
) the experimental results of oil
viscosity on droplet volume; (d) the experimental results of nozzle diameter on droplet volume.
The nozzle-driven piezoelectric micro-jet device proposed in this work is not like the
traditional piezoelectric micro-jet device; due to the entry of bubbles, the stability of the
device will gradually decline as the work progresses. Once the bubbles are entrapped,
the air bubble grows via rectified diffusion and results in a malfunction [
13
]. In addition
to excellent stability, the piezoelectric micro-jet device proposed in this paper also has
good accuracy and ejection speed. The device has a maximum drop outlet velocity of
29.056 m/s at a voltage amplitude of 200 V and a maximum drop accuracy of 13.864 nL at
a nozzle diameter of 0.2 mm. A piezoelectric micro-jet device with a pin joint designed by
Deng et al. is a typical traditional piezoelectric micro-jet device. Under the condition of an
operating frequency of 100 HZ and voltage amplitude of 100 V, 1 Pa.s adhesive is sprayed,
and its maximum control accuracy can reach about 35 nL [
24
]. The piezoelectric micro-jet
device proposed by Li et al. can obtain the injection speed of 4.7 m/s under the voltage
amplitude of 130 V, and the control accuracy can reach 4.7 nL under the signal of a 50%
duty cycle [
25
]. In summary, compared with the traditional piezoelectric micro-jet device,
the nozzle-driven piezoelectric micro-jet device proposed in this work performs well in
terms of control accuracy and ejection speed, while in terms of stability, the nozzle-driven
piezoelectric micro-jet device is better because it is not affected by bubbles.
In order to prove the stability of the proposed nozzle-driven piezoelectric micro-jet
device, a traditional piezoelectric micro-jet device is fabricated in this work, and its internal
structure is shown in Figure 24a. The cavity structure and experimental settings of the
two sets of experimental devices are the same, and the experimental system built is shown
in Figure 24b. The comparison experiment steps are as follows: under the settings of a
voltage amplitude of 100 V, signal frequency of 8090 Hz, nozzle diameter of 0.4 mm and oil
viscosity of 200 cs, the same continuous pulse signal is applied to the two sets of devices
through a signal generator and power amplifier, and the volume of droplets ejected by
the devices under multiple pulses is measured. The experimental results are shown in
Figure 25. The analysis shows that both sets of devices have good ejection conditions in
the initial few cycles, and both have high control accuracy. However, with the increase in
the total working time, the ejection performance of the traditional piezoelectric micro-jet