mi14061267.pdf - 第4页
Micromachines 2023 , 14 , 1267 4 of 17 sweep method, and the dynamic mesh method (remesh and smooth) is used to simulate the dynamic change in the fluid domain caused by the deformation of the piezoelectric vibrator throu…
Micromachines 2023, 14, 1267 3 of 17
compressed, and instantaneous pulsating high pressure is generated in the cavity. Under
the action of high pressure, the droplets are driven to converge at the nozzle and obtain
kinetic energy. As shown in Figure 2c, when the vibrator generates convex deformation,
the cavity expands, resulting in pulsating negative pressure in the cavity. Under the dual
action of negative pressure and acquired kinetic energy, the liquid droplets are separated
from the oil in the cavity and then fly out to form liquid droplets. According to the above
analysis, the droplets are ejected periodically and uniformly with the periodic deformation
of the piezoelectric vibrator.
Micromachines 2023, 14, x FOR PEER REVIEW 3 of 28
A nozzle is drilled in the center of the piezoelectric vibrator with a high-precision
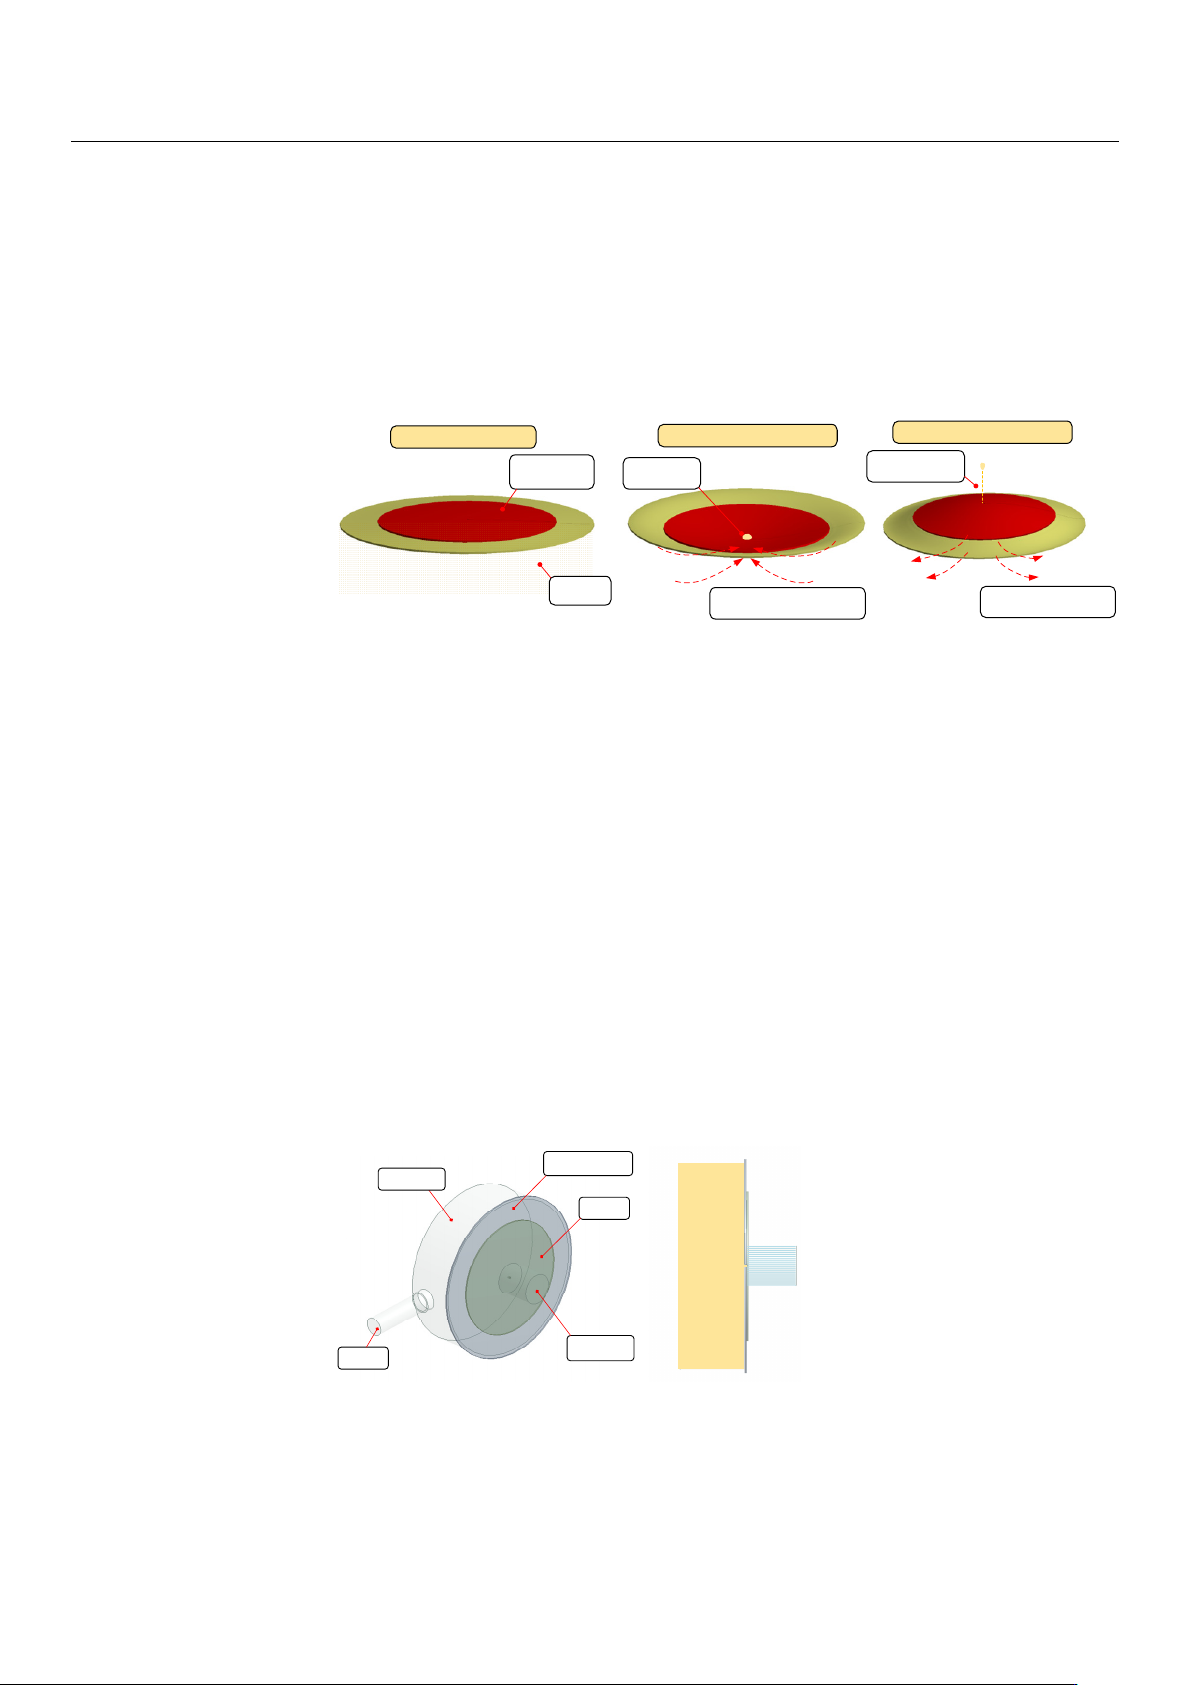
drilling machine, and the operation process of ejecting oil is shown in Figure 2. When the
piezoelectric vibrator is not working, as shown in Figure 2a, the vibrator always keeps
contact with the oil. When periodic square wave signals are applied in the vibrator, the
vibrator vibrates and produces deformation, and the oil begins to periodically eject from
the nozzle. As shown in Figure 2b, when the vibrator generates concave deformation, the
oil is compressed, and instantaneous pulsating high pressure is generated in the cavity.
Under the action of high pressure, the droplets are driven to converge at the nozzle and
obtain kinetic energy. As shown in Figure 2c, when the vibrator generates convex defor-
mation, the cavity expands, resulting in pulsating negative pressure in the cavity. Under
the dual action of negative pressure and acquired kinetic energy, the liquid droplets are
separated from the oil in the cavity and then fly out to form liquid droplets. According to
the above analysis, the droplets are ejected periodically and uniformly with the periodic
deformation of the piezoelectric vibrator.
Piezoelectric
vibrator
Oil fluid
Droplet
formation
a
b
c
When no signal is applied
When concave deformation occurs
When convex deformation occurs
Droplet separates
and is ejected
Instantaneous pulsating high
pressure effect
Negative pressure effect
Figure 2. The ejection process of droplets: (a) When no signal is applied; (b) when concave defor-
mation occurs; (c) when convex deformation occurs.
In order to further reveal the principle of the piezoelectric micro-jet and study the
influence of signal, oil viscosity and nozzle size on the injection performance, we use AN-
SYS software to carry out a two-phase, two-way fl uid–structure coupling analysis on the
designed piezoelectric micro-jet device. The simulation model is shown in Figure 3. As
can be seen from the axonal diagram of the model in Figure 3a, the simulation model is
composed of a cavity, copper sheet, PZT ceramics, liquid inlet and liquid outlet. The solid
model of the cavity and infusion tube is removed, and the internal fluid model of the cav-
ity and infusion tube is added. As can be seen from the front view of the model in Figure
3b, in order to simulate the injection of oil from the nozzle into the air, a fluid domain
simulating the external air environment is added on the right side of the nozzle. The pie-
zoelectric vibrator is set as the structural domain, and the cavity part is set as the fluid
domain (oil). PZT-5H is selected as the material of PZT ceramics, and its Young′s modulus
is 56 Gpa, Poisson’s ratio is 0.36 and density is 7600 kg/m
3
. The copper sheet is made of
red copper with a Young′s modulus of 108 Gpa and Poisson′s ratio of 0.32. The thickness
of copper and PZT ceramics is 0.2 mm. The transient structure analysis module and fluent
module are used to simulate the two-phase, two-way fluid–structure coupling analysis.
Figure 2.
The ejection process of droplets: (
a
) When no signal is applied; (
b
) when concave deforma-
tion occurs; (c) when convex deformation occurs.
In order to further reveal the principle of the piezoelectric micro-jet and study the
influence of signal, oil viscosity and nozzle size on the injection performance, we use
ANSYS software to carry out a two-phase, two-way fluid–structure coupling analysis on
the designed piezoelectric micro-jet device. The simulation model is shown in Figure 3. As
can be seen from the axonal diagram of the model in Figure 3a, the simulation model is
composed of a cavity, copper sheet, PZT ceramics, liquid inlet and liquid outlet. The solid
model of the cavity and infusion tube is removed, and the internal fluid model of the cavity
and infusion tube is added. As can be seen from the front view of the model in Figure 3b, in
order to simulate the injection of oil from the nozzle into the air, a fluid domain simulating
the external air environment is added on the right side of the nozzle. The piezoelectric
vibrator is set as the structural domain, and the cavity part is set as the fluid domain (oil).
PZT-5H is selected as the material of PZT ceramics, and its Young
0
s modulus is 56 Gpa,
Poisson’s ratio is 0.36 and density is 7600 kg/m
3
. The copper sheet is made of red copper
with a Young
0
s modulus of 108 Gpa and Poisson
0
s ratio of 0.32. The thickness of copper
and PZT ceramics is 0.2 mm. The transient structure analysis module and fluent module
are used to simulate the two-phase, two-way fluid–structure coupling analysis.
Micromachines 2023, 14, x FOR PEER REVIEW 4 of 28
Air
Oil
Inlet
Cooper sheet
PZT
Outlet
a
b
Cavity
Figure 3. The axonometric and frontal view of the simulation model: (a) The axonometric view of
the simulation model; (b) the frontal view of the simulation model.
In the transient analysis module, the fixed boundary condition is applied to the cir-
cumference of the copper sheet. The surface where the piezoelectric vibrator contacts the
fluid domain is set as the fluid–solid interface, and a square wave pulse signal is applied
to the piezoelectric vibrator. In the fluent module, the fluid domain is meshed via the
sweep method, and the dynamic mesh method (remesh and smooth) is used to simulate
the dynamic change in the fluid domain caused by the deformation of the piezoelectric
vibrator through the coupling surface. The inlet of the fluid domain is set to the pressure
inlet of 100 MPa constant pressure, and the outlet of the fluid domain is set to the pressure
outlet of 0 MPa constant pressure.
In order to achieve the best injection effect, it is necessary to find an optimal injection
frequency. The acoustic structure coupling analysis of the piezoelectric vibrator is carried
out, that is, the bidirectional coupling frequency response analysis considering fluid reac-
tion. First, the frequency with the largest amplitude is found within a large frequency
range, and then, the frequency analysis range shrinks towards this frequency to obtain the
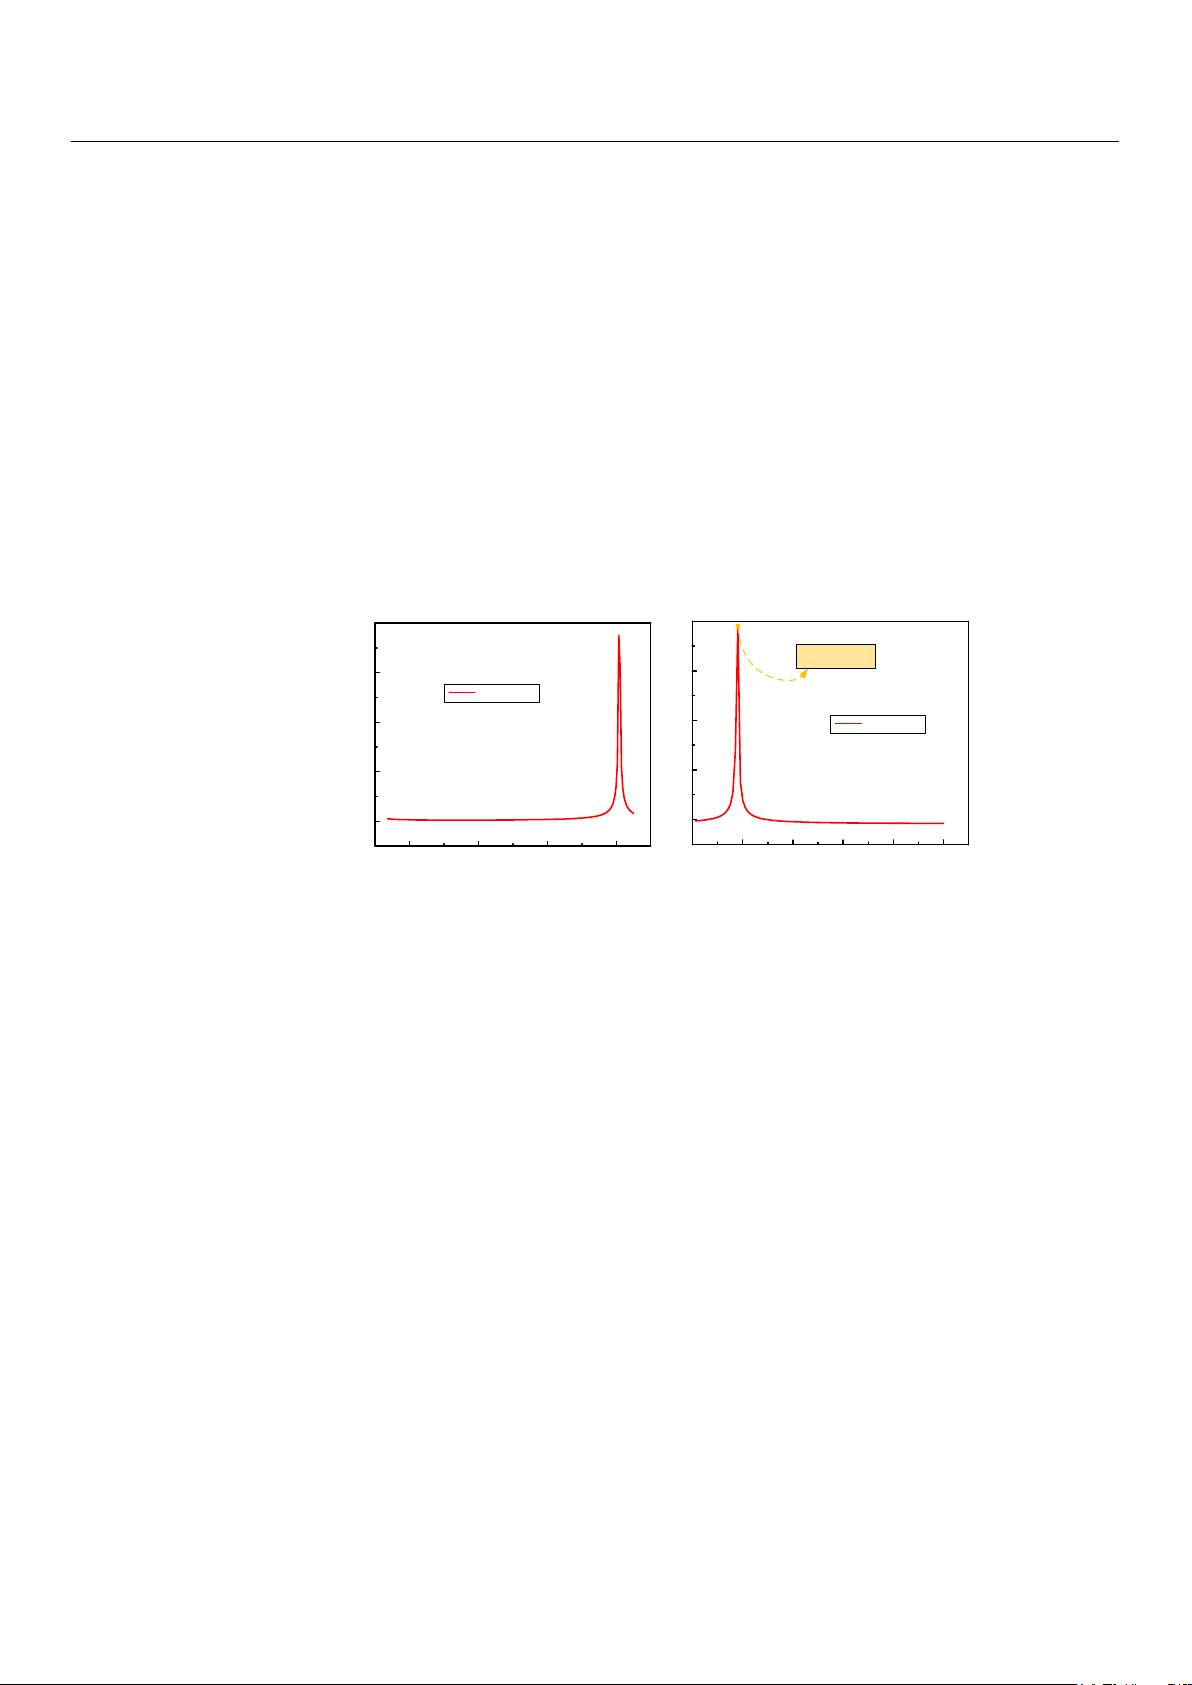
exact optimal frequency value. The results of the amplitude–frequency response are
shown in Figure 4. Figure 4a shows the result of the amplitude–frequency response in a
large frequency analysis range, and Figure 4b shows the exact optimal frequency value. It
can be seen that the vibration amplitude of the piezoelectric vibrator is maximum at 8090
Hz, so 8090 Hz is set as the optimal working frequency in this work.
Figure 3.
The axonometric and frontal view of the simulation model: (
a
) The axonometric view of the
simulation model; (b) the frontal view of the simulation model.
In the transient analysis module, the fixed boundary condition is applied to the
circumference of the copper sheet. The surface where the piezoelectric vibrator contacts the
fluid domain is set as the fluid–solid interface, and a square wave pulse signal is applied
to the piezoelectric vibrator. In the fluent module, the fluid domain is meshed via the
Micromachines 2023, 14, 1267 4 of 17
sweep method, and the dynamic mesh method (remesh and smooth) is used to simulate
the dynamic change in the fluid domain caused by the deformation of the piezoelectric
vibrator through the coupling surface. The inlet of the fluid domain is set to the pressure
inlet of 100 MPa constant pressure, and the outlet of the fluid domain is set to the pressure
outlet of 0 MPa constant pressure.
In order to achieve the best injection effect, it is necessary to find an optimal injection
frequency. The acoustic structure coupling analysis of the piezoelectric vibrator is carried
out, that is, the bidirectional coupling frequency response analysis considering fluid re-
action. First, the frequency with the largest amplitude is found within a large frequency
range, and then, the frequency analysis range shrinks towards this frequency to obtain the
exact optimal frequency value. The results of the amplitude–frequency response are shown
in Figure 4. Figure 4a shows the result of the amplitude–frequency response in a large
frequency analysis range, and Figure 4b shows the exact optimal frequency value. It can be
seen that the vibration amplitude of the piezoelectric vibrator is maximum at 8090 Hz, so
8090 Hz is set as the optimal working frequency in this work.
Micromachines 2023, 14, x FOR PEER REVIEW 5 of 28
2000 4000 6000 8000
0
50
100
150
200
Amplitude (um)
Frequency (Hz)
Amplitude
8000 8100 8200 8300 8400 8500
Amplitude (um)
Frequency (Hz)
Amplitude
8090Hz
0
50
100
150
200
a
b
Figure 4. The results of the amplitude–frequency response: (a) The result of amplitude–frequency
response in a large frequency analysis range; (b) the exact optimal frequency value.
Figure 4.
The results of the amplitude–frequency response: (
a
) The result of amplitude–frequency
response in a large frequency analysis range; (b) the exact optimal frequency value.
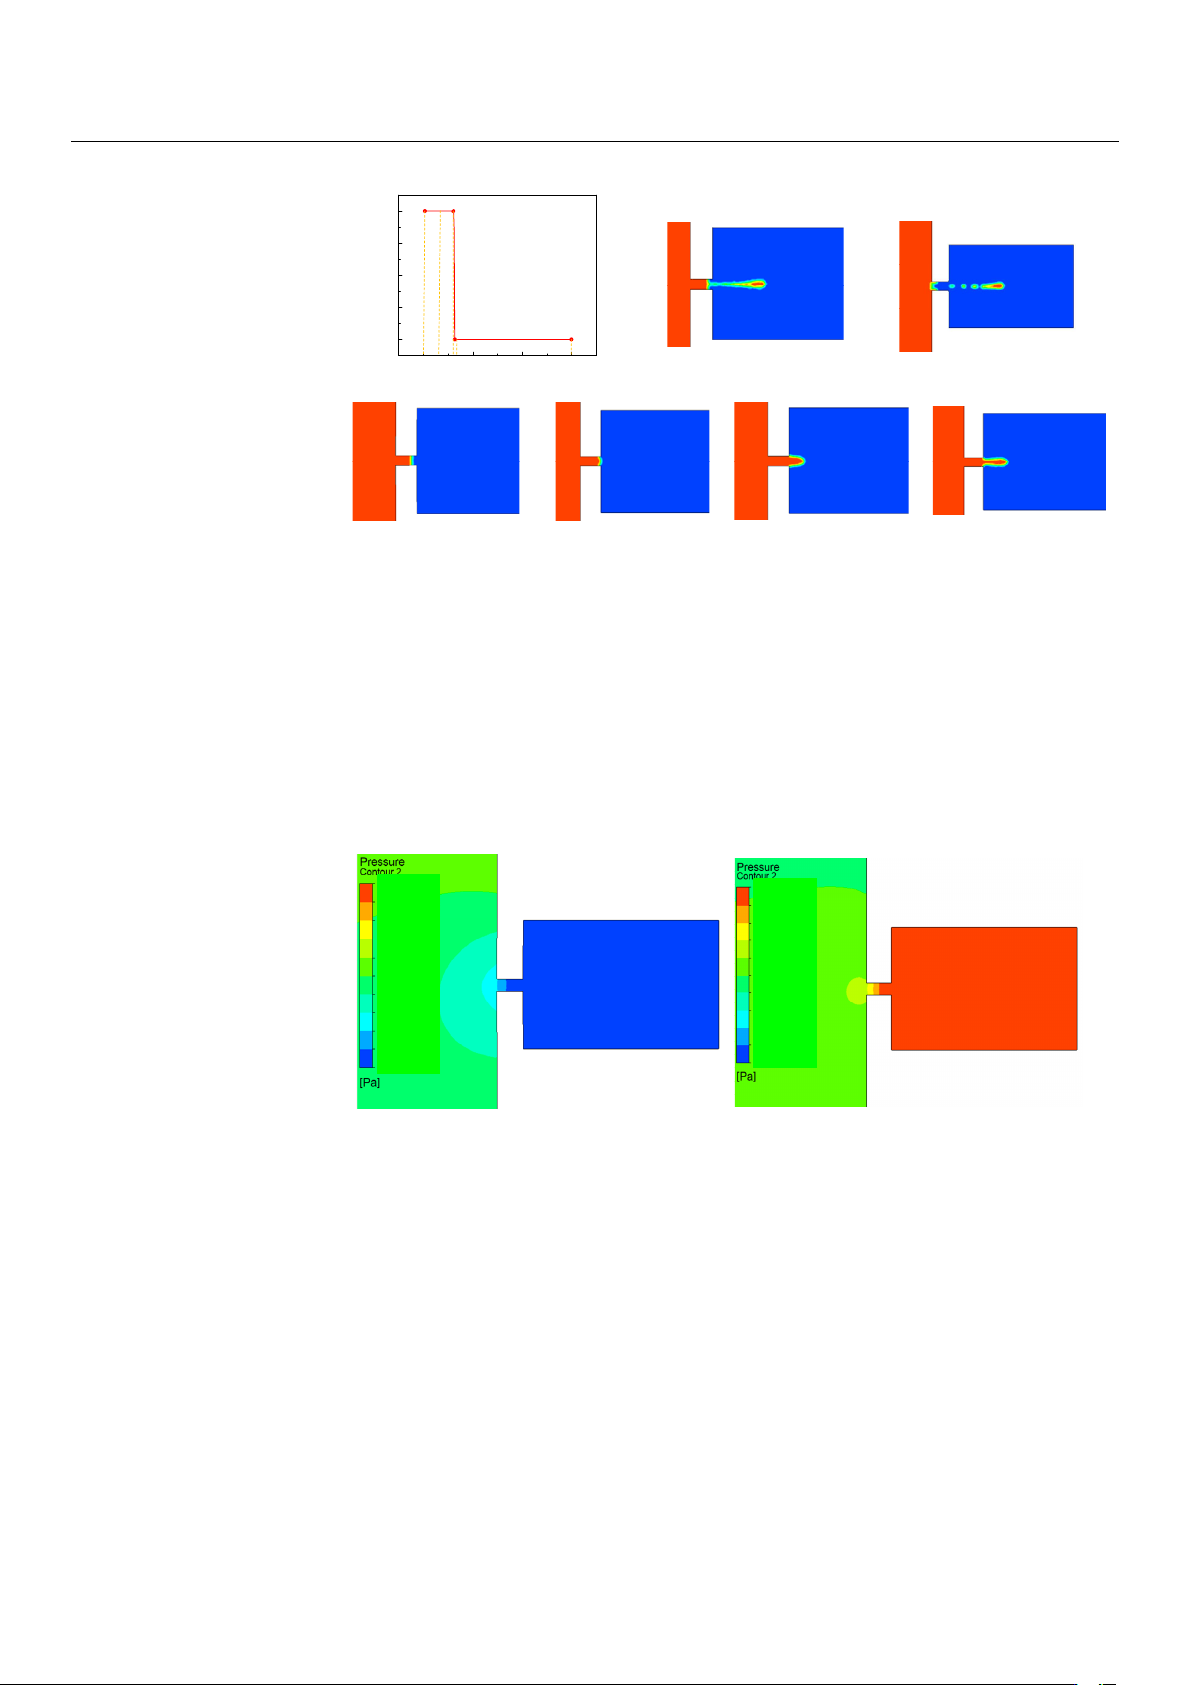
For the follow-up study on the influence of a single parameter on the injection state, the
basic parameters are set as follows: voltage amplitude is 100 V, signal frequency is 8090 Hz,
nozzle diameter is 0.4 mm, and oil viscosity is 200 Pa.s. The single-droplet-injection two-
phase flow diagram of the piezoelectric micro-jet device under standard parameters is
shown in Figure 5. The mechanism of the piezoelectric micro-jet will be elaborated upon in
Figure 5. At
t
= 0 s, the device has no signal input and the liquid level remains stationary. At
t
1
, the high-level pulse signal is applied to the piezoelectric vibrator, and the vibrator begins
to produce concave deformation and squeezes the cavity to produce positive pressure,
resulting in the oil beginning to converge to the nozzle. From t
1
to t
3
, the vibrator continues
to receive positive voltage signal, the cavity keeps positive pressure and the oil continues
to be ejected out. At t
4
, the pulse signal changes to a low level after the falling edge. At this
time, the vibrator begins to produce convex deformation, and the cavity begins to expand,
negative pressure begins to be generated and part of the oil begins to be sucked back. At t
5
,
it can be seen that part of the droplets are sucked back, and the droplets are completely
separated from the oil and ejected outward. The simulation results show the feasibility of
the piezoelectric micro-jet and describe the generation process of droplets in detail.
Micromachines 2023, 14, 1267 5 of 17
Micromachines 2023, 14, x FOR PEER REVIEW 6 of 28
For the follow-up study on the influence of a single parameter on the injection state,
the basic parameters are set as follows: voltage amplitude is 100 V, signal frequency is
8090 Hz, nozzle diameter is 0.4 mm, and oil viscosity is 200 Pa.s. The single-droplet-injec-
tion two-phase flow diagram of the piezoelectric micro-jet device under standard param-
eters is shown in Figure 5. The mechanism of the piezoelectric micro-jet will be elaborated
upon in Figure 5. At t = 0 s, the device has no signal input and the liquid level remains
stationary. At t
1, the high-level pulse signal is applied to the piezoelectric vibrator, and the
vibrator begins to produce concave deformation and squeezes the cavity to produce pos-
itive pressure, resulting in the oil beginning to converge to the nozzle. From t
1 to t3, the
vibrator continues to receive positive voltage signal, the cavity keeps positive pressure
and the oil continues to be ejected out. At t
4, the pulse signal changes to a low level after
the falling edge. At this time, the vibrator begins to produce convex deformation, and the
cavity begins to expand, negative pressure begins to be generated and part of the oil be-
gins to be sucked back. At t
5, it can be seen that part of the droplets are sucked back, and
the droplets are completely separated from the oil and ejected outward. The simulation
results show the feasibility of the piezoelectric micro-jet and describe the generation pro-
cess of droplets in detail.
0
t
1
0
50
100
150
200
VotVoltage amplitude (V)
Time (s)
0 t
1
t
2
t
3
t
4
t
5
t
2
t
3
t
4
t
5
Figure 5. The single-droplet-injection two-phase flow diagram.
The single-injection pressure diagram of the piezoelectric micro-jet device under
standard parameters is shown in Figure 6, in which Figure 6a corresponds to the concave
deformation of the piezoelectric vibrator, and Figure 6b corresponds to the convex defor-
mation of the piezoelectric vibrator. As can be seen from Figure 6a, when the piezoelectric
vibrator generates concave deformation, positive pressure is formed inside the cavity,
which gives kinetic energy to the oil and squeezes the oil to the nozzle. As can be seen
from Figure 6b, when the piezoelectric vibrator generates convex deformation, negative
pressure is generated inside the cavity, which helps the droplet to separate from the oil.
The simulation results are consistent with the previous analysis of droplet ejection.
Figure 5. The single-droplet-injection two-phase flow diagram.
The single-injection pressure diagram of the piezoelectric micro-jet device under stan-
dard parameters is shown in Figure 6, in which Figure 6a corresponds to the concave
deformation of the piezoelectric vibrator, and Figure 6b corresponds to the convex defor-
mation of the piezoelectric vibrator. As can be seen from Figure 6a, when the piezoelectric
vibrator generates concave deformation, positive pressure is formed inside the cavity,
which gives kinetic energy to the oil and squeezes the oil to the nozzle. As can be seen
from Figure 6b, when the piezoelectric vibrator generates convex deformation, negative
pressure is generated inside the cavity, which helps the droplet to separate from the oil.
The simulation results are consistent with the previous analysis of droplet ejection.
Micromachines 2023, 14, x FOR PEER REVIEW 7 of 28
a
b
9.717×10
5
8.745×10
5
7.774×10
5
6.802×10
5
5.830×10
5
4.859×10
5
3.887×10
5
2.915×10
5
1.943×10
5
9.717×10
4
0
4.070×10
2
-2.641×10
5
-5.287×10
5
-7.932×10
5
-1.058×10
6
-1.332×10
6
-1.587×10
6
-1.851×10
6
-2.116×10
6
-2.380×10
6
-2.645×10
6
Figure 6. The single-injection pressure diagram: (a) The pressure diagram when the piezoelectric
vibrator generates concave deformation; (b) the pressure diagram when the piezoelectric vibrator
generates convex deformation.
The injection velocity diagram of the piezoelectric micro-jet device under standard
parameters is shown in Figure 7. Figure 7a,b show the velocity diagram of the droplet
during the convergence of the droplet at the nozzle. Figure 7c,d show the velocity diagram
of the droplet during the separation and ejection of the droplet from the oil. From Figure
7a–d, it can be seen that with the gradual ejection of the droplet, the kinetic energy of the
droplet is gradually lost due to the need to overcome the viscous resistance of the oil, and
the velocity of the droplets is gradually reduced.
Figure 6.
The single-injection pressure diagram: (
a
) The pressure diagram when the piezoelectric
vibrator generates concave deformation; (
b
) the pressure diagram when the piezoelectric vibrator
generates convex deformation.
The injection velocity diagram of the piezoelectric micro-jet device under standard pa-
rameters is shown in Figure 7. Figure 7a,b show the velocity diagram of the droplet during
the convergence of the droplet at the nozzle. Figure 7c,d show the velocity diagram of the
droplet during the separation and ejection of the droplet from the oil. From
Figure 7a–d
, it
can be seen that with the gradual ejection of the droplet, the kinetic energy of the droplet is
gradually lost due to the need to overcome the viscous resistance of the oil, and the velocity
of the droplets is gradually reduced.