mi14061267.pdf - 第5页
Micromachines 2023 , 14 , 1267 5 of 17 Micromachines 20 23 , 14 , x FOR PEER REVIEW 6 of 28 For t h e fo llo w-up st udy o n t h e in fl uenc e of a sing le par a meter on the inject ion state, the ba si c pa ra meters ar…
Micromachines 2023, 14, 1267 4 of 17
sweep method, and the dynamic mesh method (remesh and smooth) is used to simulate
the dynamic change in the fluid domain caused by the deformation of the piezoelectric
vibrator through the coupling surface. The inlet of the fluid domain is set to the pressure
inlet of 100 MPa constant pressure, and the outlet of the fluid domain is set to the pressure
outlet of 0 MPa constant pressure.
In order to achieve the best injection effect, it is necessary to find an optimal injection
frequency. The acoustic structure coupling analysis of the piezoelectric vibrator is carried
out, that is, the bidirectional coupling frequency response analysis considering fluid re-
action. First, the frequency with the largest amplitude is found within a large frequency
range, and then, the frequency analysis range shrinks towards this frequency to obtain the
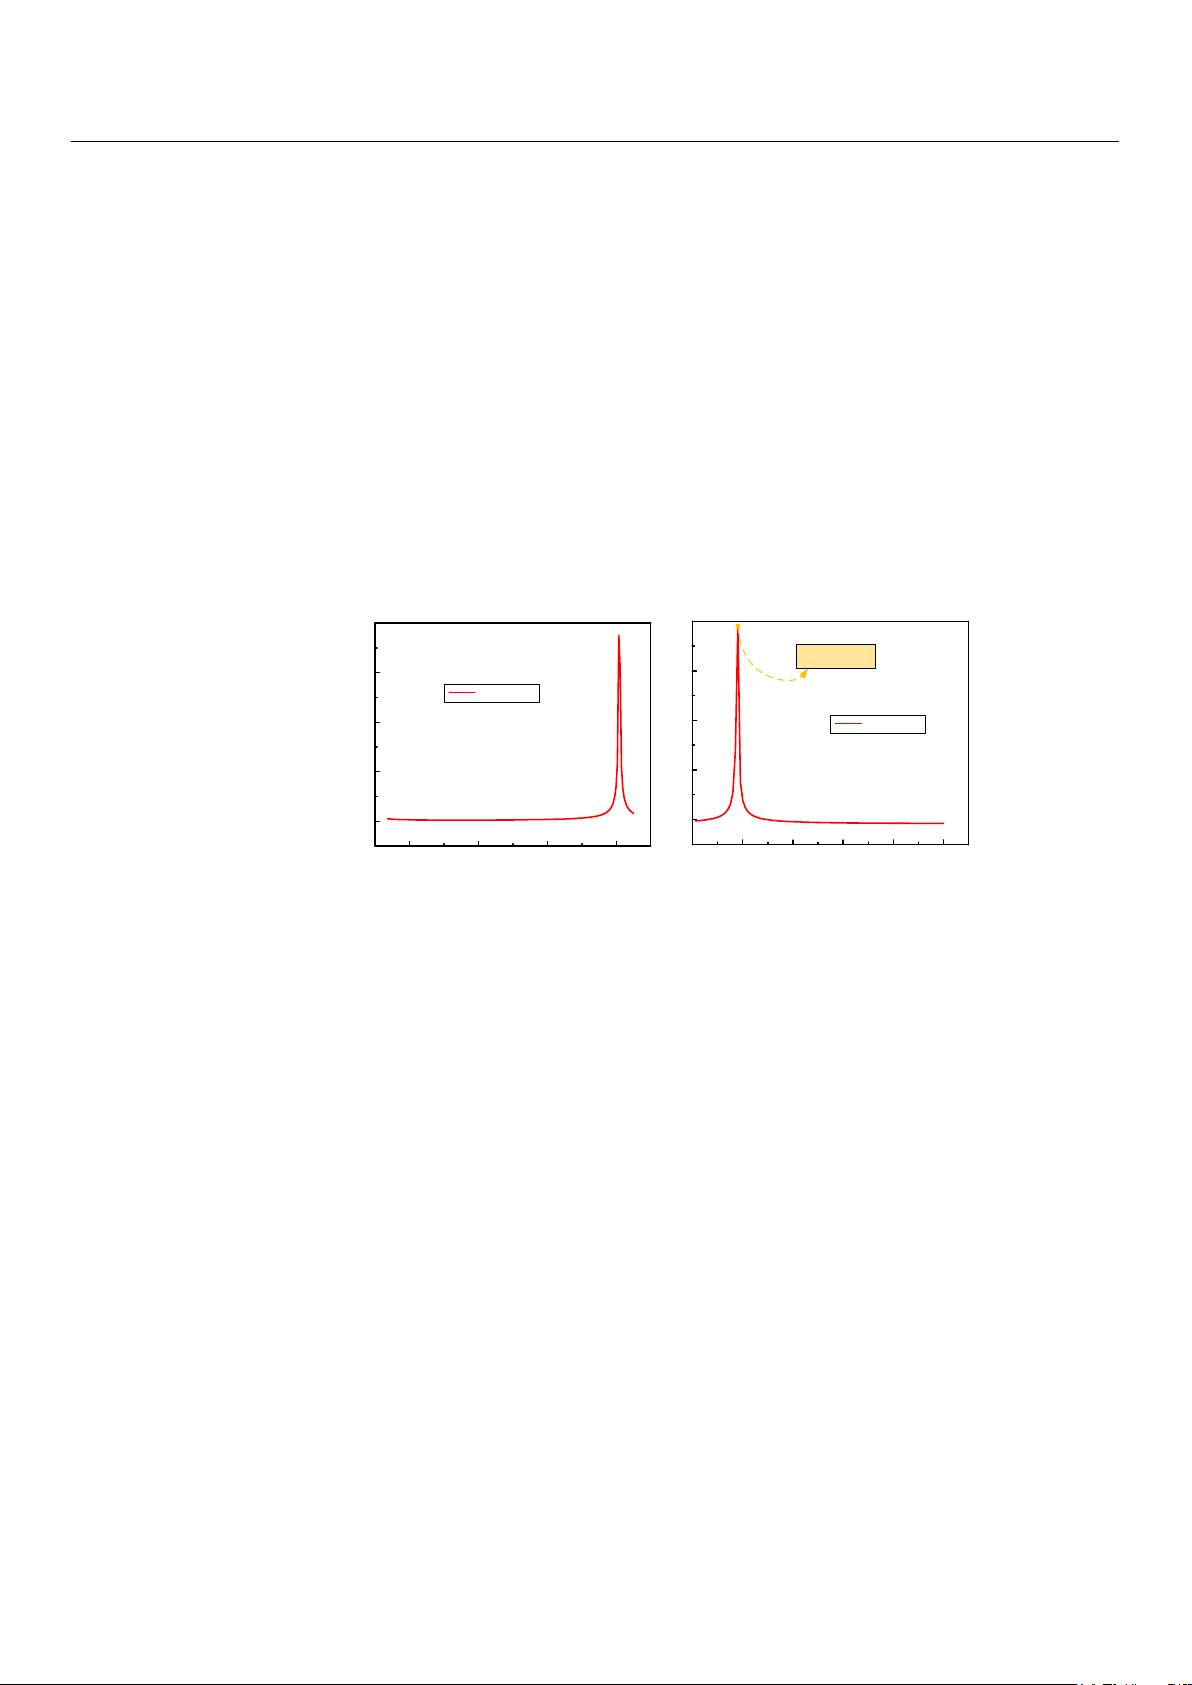
exact optimal frequency value. The results of the amplitude–frequency response are shown
in Figure 4. Figure 4a shows the result of the amplitude–frequency response in a large
frequency analysis range, and Figure 4b shows the exact optimal frequency value. It can be
seen that the vibration amplitude of the piezoelectric vibrator is maximum at 8090 Hz, so
8090 Hz is set as the optimal working frequency in this work.
Micromachines 2023, 14, x FOR PEER REVIEW 5 of 28
2000 4000 6000 8000
0
50
100
150
200
Amplitude (um)
Frequency (Hz)
Amplitude
8000 8100 8200 8300 8400 8500
Amplitude (um)
Frequency (Hz)
Amplitude
8090Hz
0
50
100
150
200
a
b
Figure 4. The results of the amplitude–frequency response: (a) The result of amplitude–frequency
response in a large frequency analysis range; (b) the exact optimal frequency value.
Figure 4.
The results of the amplitude–frequency response: (
a
) The result of amplitude–frequency
response in a large frequency analysis range; (b) the exact optimal frequency value.
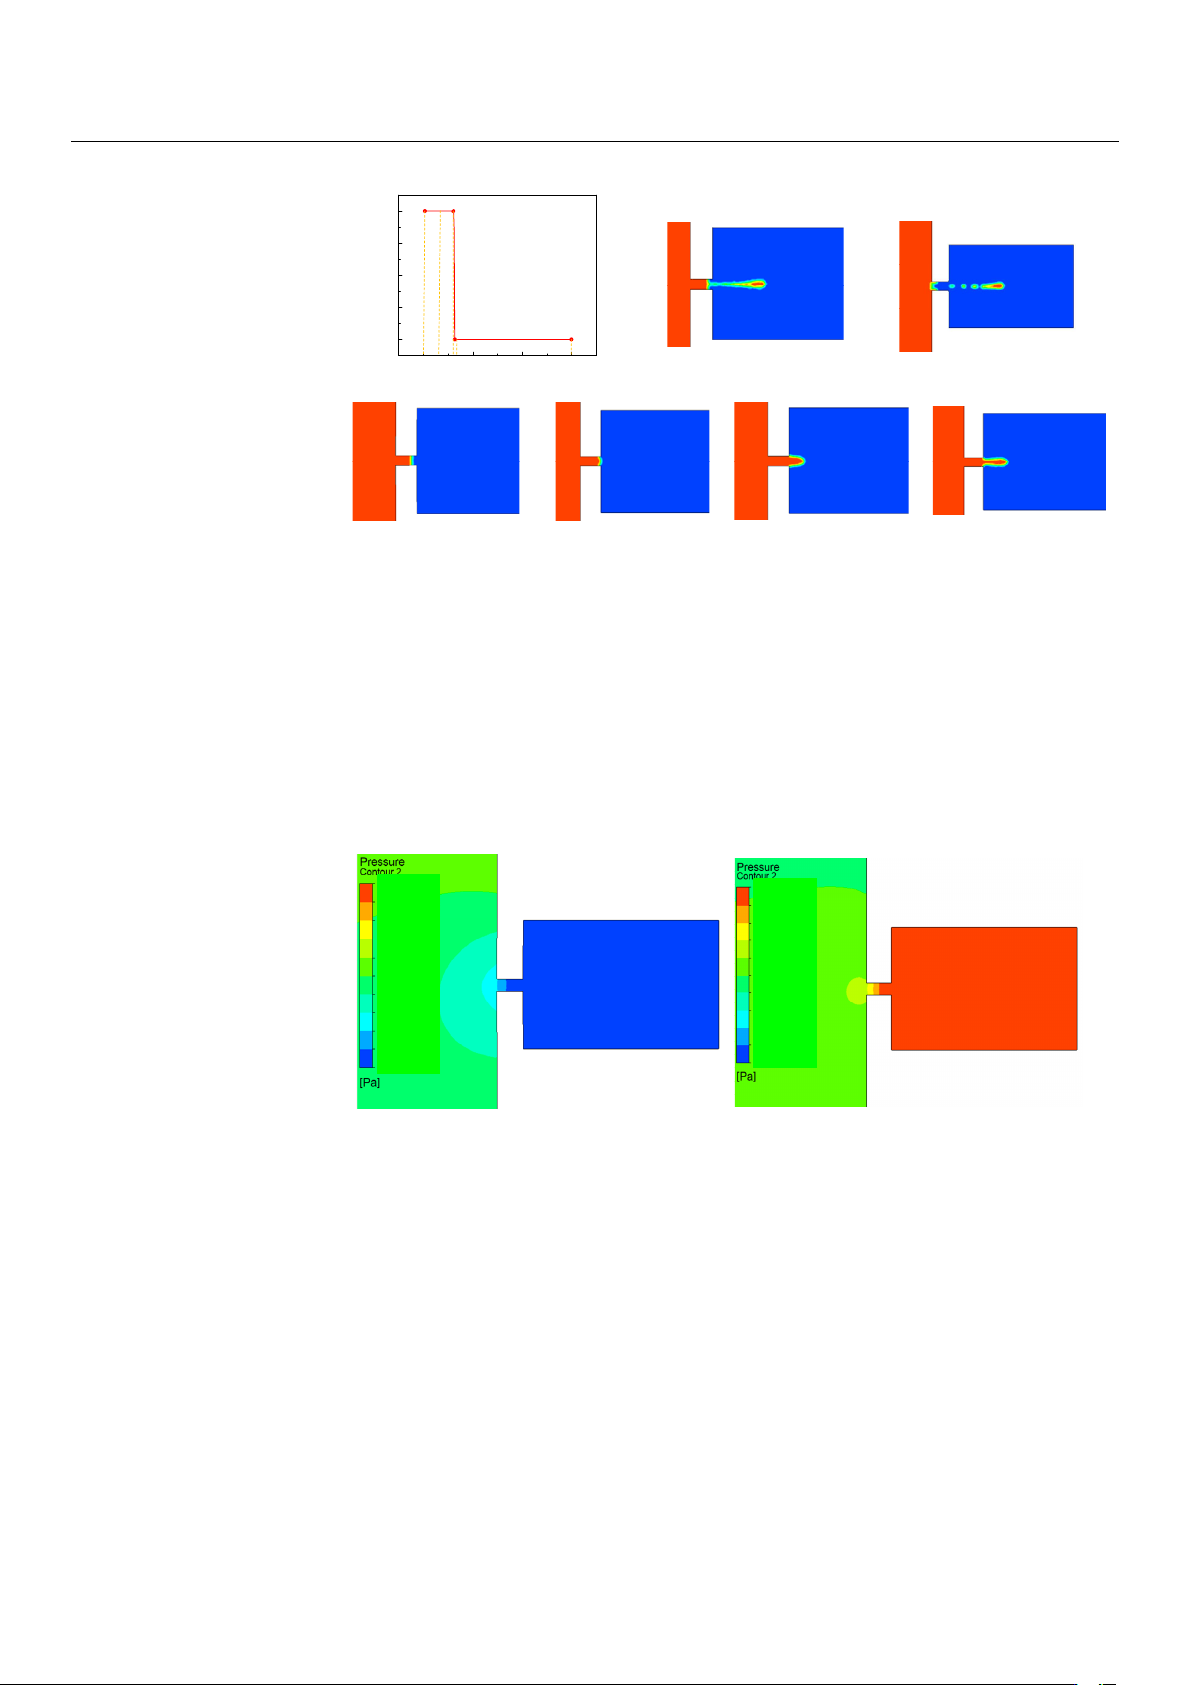
For the follow-up study on the influence of a single parameter on the injection state, the
basic parameters are set as follows: voltage amplitude is 100 V, signal frequency is 8090 Hz,
nozzle diameter is 0.4 mm, and oil viscosity is 200 Pa.s. The single-droplet-injection two-
phase flow diagram of the piezoelectric micro-jet device under standard parameters is
shown in Figure 5. The mechanism of the piezoelectric micro-jet will be elaborated upon in
Figure 5. At
t
= 0 s, the device has no signal input and the liquid level remains stationary. At
t
1
, the high-level pulse signal is applied to the piezoelectric vibrator, and the vibrator begins
to produce concave deformation and squeezes the cavity to produce positive pressure,
resulting in the oil beginning to converge to the nozzle. From t
1
to t
3
, the vibrator continues
to receive positive voltage signal, the cavity keeps positive pressure and the oil continues
to be ejected out. At t
4
, the pulse signal changes to a low level after the falling edge. At this
time, the vibrator begins to produce convex deformation, and the cavity begins to expand,
negative pressure begins to be generated and part of the oil begins to be sucked back. At t
5
,
it can be seen that part of the droplets are sucked back, and the droplets are completely
separated from the oil and ejected outward. The simulation results show the feasibility of
the piezoelectric micro-jet and describe the generation process of droplets in detail.
Micromachines 2023, 14, 1267 5 of 17
Micromachines 2023, 14, x FOR PEER REVIEW 6 of 28
For the follow-up study on the influence of a single parameter on the injection state,
the basic parameters are set as follows: voltage amplitude is 100 V, signal frequency is
8090 Hz, nozzle diameter is 0.4 mm, and oil viscosity is 200 Pa.s. The single-droplet-injec-
tion two-phase flow diagram of the piezoelectric micro-jet device under standard param-
eters is shown in Figure 5. The mechanism of the piezoelectric micro-jet will be elaborated
upon in Figure 5. At t = 0 s, the device has no signal input and the liquid level remains
stationary. At t
1, the high-level pulse signal is applied to the piezoelectric vibrator, and the
vibrator begins to produce concave deformation and squeezes the cavity to produce pos-
itive pressure, resulting in the oil beginning to converge to the nozzle. From t
1 to t3, the
vibrator continues to receive positive voltage signal, the cavity keeps positive pressure
and the oil continues to be ejected out. At t
4, the pulse signal changes to a low level after
the falling edge. At this time, the vibrator begins to produce convex deformation, and the
cavity begins to expand, negative pressure begins to be generated and part of the oil be-
gins to be sucked back. At t
5, it can be seen that part of the droplets are sucked back, and
the droplets are completely separated from the oil and ejected outward. The simulation
results show the feasibility of the piezoelectric micro-jet and describe the generation pro-
cess of droplets in detail.
0
t
1
0
50
100
150
200
VotVoltage amplitude (V)
Time (s)
0 t
1
t
2
t
3
t
4
t
5
t
2
t
3
t
4
t
5
Figure 5. The single-droplet-injection two-phase flow diagram.
The single-injection pressure diagram of the piezoelectric micro-jet device under
standard parameters is shown in Figure 6, in which Figure 6a corresponds to the concave
deformation of the piezoelectric vibrator, and Figure 6b corresponds to the convex defor-
mation of the piezoelectric vibrator. As can be seen from Figure 6a, when the piezoelectric
vibrator generates concave deformation, positive pressure is formed inside the cavity,
which gives kinetic energy to the oil and squeezes the oil to the nozzle. As can be seen
from Figure 6b, when the piezoelectric vibrator generates convex deformation, negative
pressure is generated inside the cavity, which helps the droplet to separate from the oil.
The simulation results are consistent with the previous analysis of droplet ejection.
Figure 5. The single-droplet-injection two-phase flow diagram.
The single-injection pressure diagram of the piezoelectric micro-jet device under stan-
dard parameters is shown in Figure 6, in which Figure 6a corresponds to the concave
deformation of the piezoelectric vibrator, and Figure 6b corresponds to the convex defor-
mation of the piezoelectric vibrator. As can be seen from Figure 6a, when the piezoelectric
vibrator generates concave deformation, positive pressure is formed inside the cavity,
which gives kinetic energy to the oil and squeezes the oil to the nozzle. As can be seen
from Figure 6b, when the piezoelectric vibrator generates convex deformation, negative
pressure is generated inside the cavity, which helps the droplet to separate from the oil.
The simulation results are consistent with the previous analysis of droplet ejection.
Micromachines 2023, 14, x FOR PEER REVIEW 7 of 28
a
b
9.717×10
5
8.745×10
5
7.774×10
5
6.802×10
5
5.830×10
5
4.859×10
5
3.887×10
5
2.915×10
5
1.943×10
5
9.717×10
4
0
4.070×10
2
-2.641×10
5
-5.287×10
5
-7.932×10
5
-1.058×10
6
-1.332×10
6
-1.587×10
6
-1.851×10
6
-2.116×10
6
-2.380×10
6
-2.645×10
6
Figure 6. The single-injection pressure diagram: (a) The pressure diagram when the piezoelectric
vibrator generates concave deformation; (b) the pressure diagram when the piezoelectric vibrator
generates convex deformation.
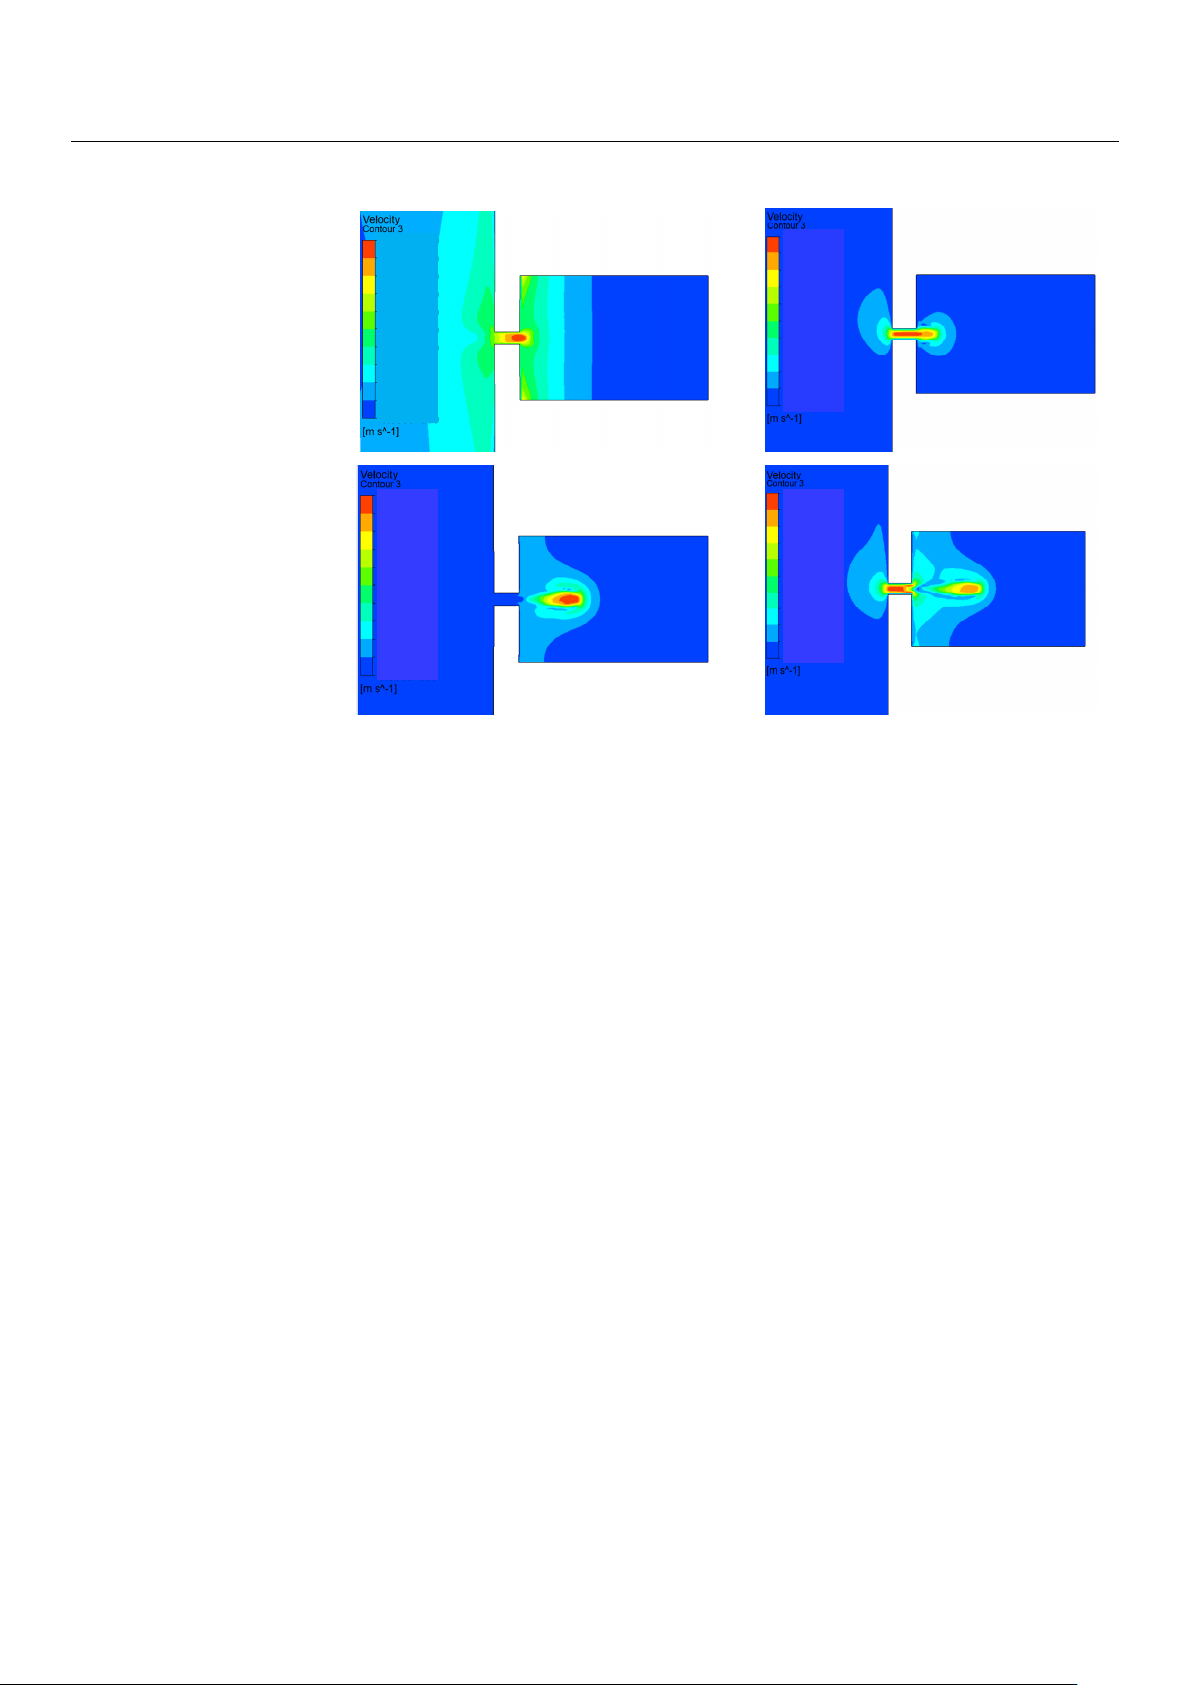
The injection velocity diagram of the piezoelectric micro-jet device under standard
parameters is shown in Figure 7. Figure 7a,b show the velocity diagram of the droplet
during the convergence of the droplet at the nozzle. Figure 7c,d show the velocity diagram
of the droplet during the separation and ejection of the droplet from the oil. From Figure
7a–d, it can be seen that with the gradual ejection of the droplet, the kinetic energy of the
droplet is gradually lost due to the need to overcome the viscous resistance of the oil, and
the velocity of the droplets is gradually reduced.
Figure 6.
The single-injection pressure diagram: (
a
) The pressure diagram when the piezoelectric
vibrator generates concave deformation; (
b
) the pressure diagram when the piezoelectric vibrator
generates convex deformation.
The injection velocity diagram of the piezoelectric micro-jet device under standard pa-
rameters is shown in Figure 7. Figure 7a,b show the velocity diagram of the droplet during
the convergence of the droplet at the nozzle. Figure 7c,d show the velocity diagram of the
droplet during the separation and ejection of the droplet from the oil. From
Figure 7a–d
, it
can be seen that with the gradual ejection of the droplet, the kinetic energy of the droplet is
gradually lost due to the need to overcome the viscous resistance of the oil, and the velocity
of the droplets is gradually reduced.
Micromachines 2023, 14, 1267 6 of 17
Micromachines 2023, 14, x FOR PEER REVIEW 8 of 28
a b
c
d
3.100
2.790
2.48 0
2.170
1.860
1.550
1.240
9.300×10
-1
6.200×10
-1
3.100×10
-1
0
2.552×10
1
2.297×10
1
2.042×10
1
1.786×10
1
1.531×10
1
1.276×10
1
1.021×10
1
7.656
5.104
2.552
0
1.670×10
1
1.503×10
1
1.33 6×10
1
1.169×10
1
1.002×10
1
8.351
6.681
5.010
3.340
1.670
0
1.880×10
1
1.692×10
1
1.504×10
1
1.316×10
1
1.128×10
1
9.402
7.521
5.641
3.761
1.880
0
Figure 7. The injection velocity diagram: (a,b) The velocity diagram of the droplet during the con-
vergence of the droplet at the nozzle; (c,d) velocity diagram of the droplet during the separation and
ejection of the droplet from the oil.
3. Performance Controlling
In the above section, we describe in detail the basic principle of the piezoelectric mi-
cro-jet and the formation process of single-droplet injection under standard parameters.
In order to propose an injection performance control method for this device, this section
will study the influence of various parameters—voltage amplitude, signal frequency, oil
viscosity and nozzle diameter—on the injection performance. The injection performance
considered in this work mainly includes droplet volume, droplet outlet velocity and ejec-
tion state. The outlet flow rate of the nozzle is integrated with time to obtain the droplet
volume, and the droplet outlet velocity and ejection state are the droplet outlet velocity
and ejection state at which the droplet is separated from the oil and is about to eject. In
order to ensure that droplets can be fully ejected, the total duration of this simulation is
set as 0.0003 s, which is about twice the period of a single pulse.
The voltage amplitude can affect the injection performance of the piezoelectric micro-
jet device by changing the vibration amplitude of the piezoelectric vibrator. Firstly, the
influence of voltage amplitude variation on the injection performance of the device is stud-
ied, and Figures 8–10 reflect the influence of voltage amplitude variation on device injec-
tion performance. Figure 8 shows the change in the droplet ejection state caused by the
change in voltage amplitude. It can be seen that when the voltage is too low, such as 50 V
and 75 V, droplets cannot be formed and ejected within a total duration of 0.0003 s, while
when the voltage amplitude is higher than 100 V, droplets can be ejected normally, and
the larger the voltage amplitude, the earlier the droplet is ejected. If it is difficult to eject
droplets, we can increase the voltage amplitude of the input signal.
Figure 7.
The injection velocity diagram: (
a
,
b
) The velocity diagram of the droplet during the
convergence of the droplet at the nozzle; (
c
,
d
) velocity diagram of the droplet during the separation
and ejection of the droplet from the oil.
3. Performance Controlling
In the above section, we describe in detail the basic principle of the piezoelectric
micro-jet and the formation process of single-droplet injection under standard parameters.
In order to propose an injection performance control method for this device, this section
will study the influence of various parameters—voltage amplitude, signal frequency, oil
viscosity and nozzle diameter—on the injection performance. The injection performance
considered in this work mainly includes droplet volume, droplet outlet velocity and ejection
state. The outlet flow rate of the nozzle is integrated with time to obtain the droplet volume,
and the droplet outlet velocity and ejection state are the droplet outlet velocity and ejection
state at which the droplet is separated from the oil and is about to eject. In order to ensure
that droplets can be fully ejected, the total duration of this simulation is set as 0.0003 s,
which is about twice the period of a single pulse.
The voltage amplitude can affect the injection performance of the piezoelectric micro-
jet device by changing the vibration amplitude of the piezoelectric vibrator. Firstly, the
influence of voltage amplitude variation on the injection performance of the device is
studied, and Figures 8–10 reflect the influence of voltage amplitude variation on device
injection performance. Figure 8 shows the change in the droplet ejection state caused by
the change in voltage amplitude. It can be seen that when the voltage is too low, such as
50 V and 75 V, droplets cannot be formed and ejected within a total duration of 0.0003 s,
while when the voltage amplitude is higher than 100 V, droplets can be ejected normally,
and the larger the voltage amplitude, the earlier the droplet is ejected. If it is difficult to
eject droplets, we can increase the voltage amplitude of the input signal.
Figure 9 shows the change in droplet outlet velocity caused by the change in voltage
amplitude. It can be observed that the droplet outlet velocity increases gradually with the
increase in voltage amplitude. Figure 10 reflects the influence of voltage amplitude change
on the volume of droplets ejected. It can be seen that the oil is first extruded inwards
and then injected. With the increase in voltage amplitude, the volume of droplets ejected
gradually increases, and the injection efficiency increases while the control accuracy of the
droplets decreases. Therefore, if you want to reduce the difficulty of injection or improve