mi14061267.pdf - 第8页
Micromachines 2023 , 14 , 1267 8 of 17 Signal frequency also has an influence on the injection performance. When the fre- quency of the applied signal is just under the fr equency of the vibrator 0 s operating mode, the a…
Micromachines 2023, 14, 1267 7 of 17
the outlet velocity and injection efficiency of the droplets, you can appropriately increase
the voltage amplitude, and if you want to improve the control accuracy of the droplets, you
can appropriately reduce the voltage amplitude.
Micromachines 2023, 14, x FOR PEER REVIEW 9 of 28
The voltage amplitude is 50V The voltage amplitude is 75V
The voltage amplitude is 100V
The voltage amplitude is 125V
The voltage amplitude is 175VThe voltage amplitude is 150V The voltage amplitude is 200V
0.682T
1T 1T
0.64T
0.5745T
0.5125T 0.496T
1
9.000×10
-1
0
8.000×10
-1
7.000×10
-1
6.000×10
-1
5.000×10
-1
4.000×10
-1
3.00 0×10
-1
2.000×10
-1
1.000×10
-1
1
9.00 0×10
-1
0
8.000×10
-1
7.00 0×10
-1
6.00 0×10
-1
5.00 0×10
-1
4.000×10
-1
3.000×10
-1
2.000×10
-1
1.00 0×10
-1
1
9.00 0×10
-1
0
8.00 0×10
-1
7.00 0×10
-1
6.00 0×10
-1
5.00 0×10
-1
4.00 0×10
-1
3.00 0×10
-1
2.00 0×10
-1
1.00 0×10
-1
1
9.000×10
-1
0
8.000×10
-1
7.000×10
-1
6.000×10
-1
5.000×10
-1
4.000×10
-1
3.000×10
-1
2.000×10
-1
1.000×10
-1
1
9.000×10
-1
0
8.000×10
-1
7.000×10
-1
6.000×10
-1
5.000×10
-1
4.000×10
-1
3.00 0×10
-1
2.000×10
-1
1.000×10
-1
1
9.00 0×10
-1
0
8.000×10
-1
7.00 0×10
-1
6.00 0×10
-1
5.00 0×10
-1
4.000×10
-1
3.00 0×10
-1
2.000×10
-1
1.00 0×10
-1
1
9.000×10
-1
0
8.000×10
-1
7.000×10
-1
6.000×10
-1
5.000×10
-1
4.000×10
-1
3.000×10
-1
2.000×10
-1
1.000×10
-1
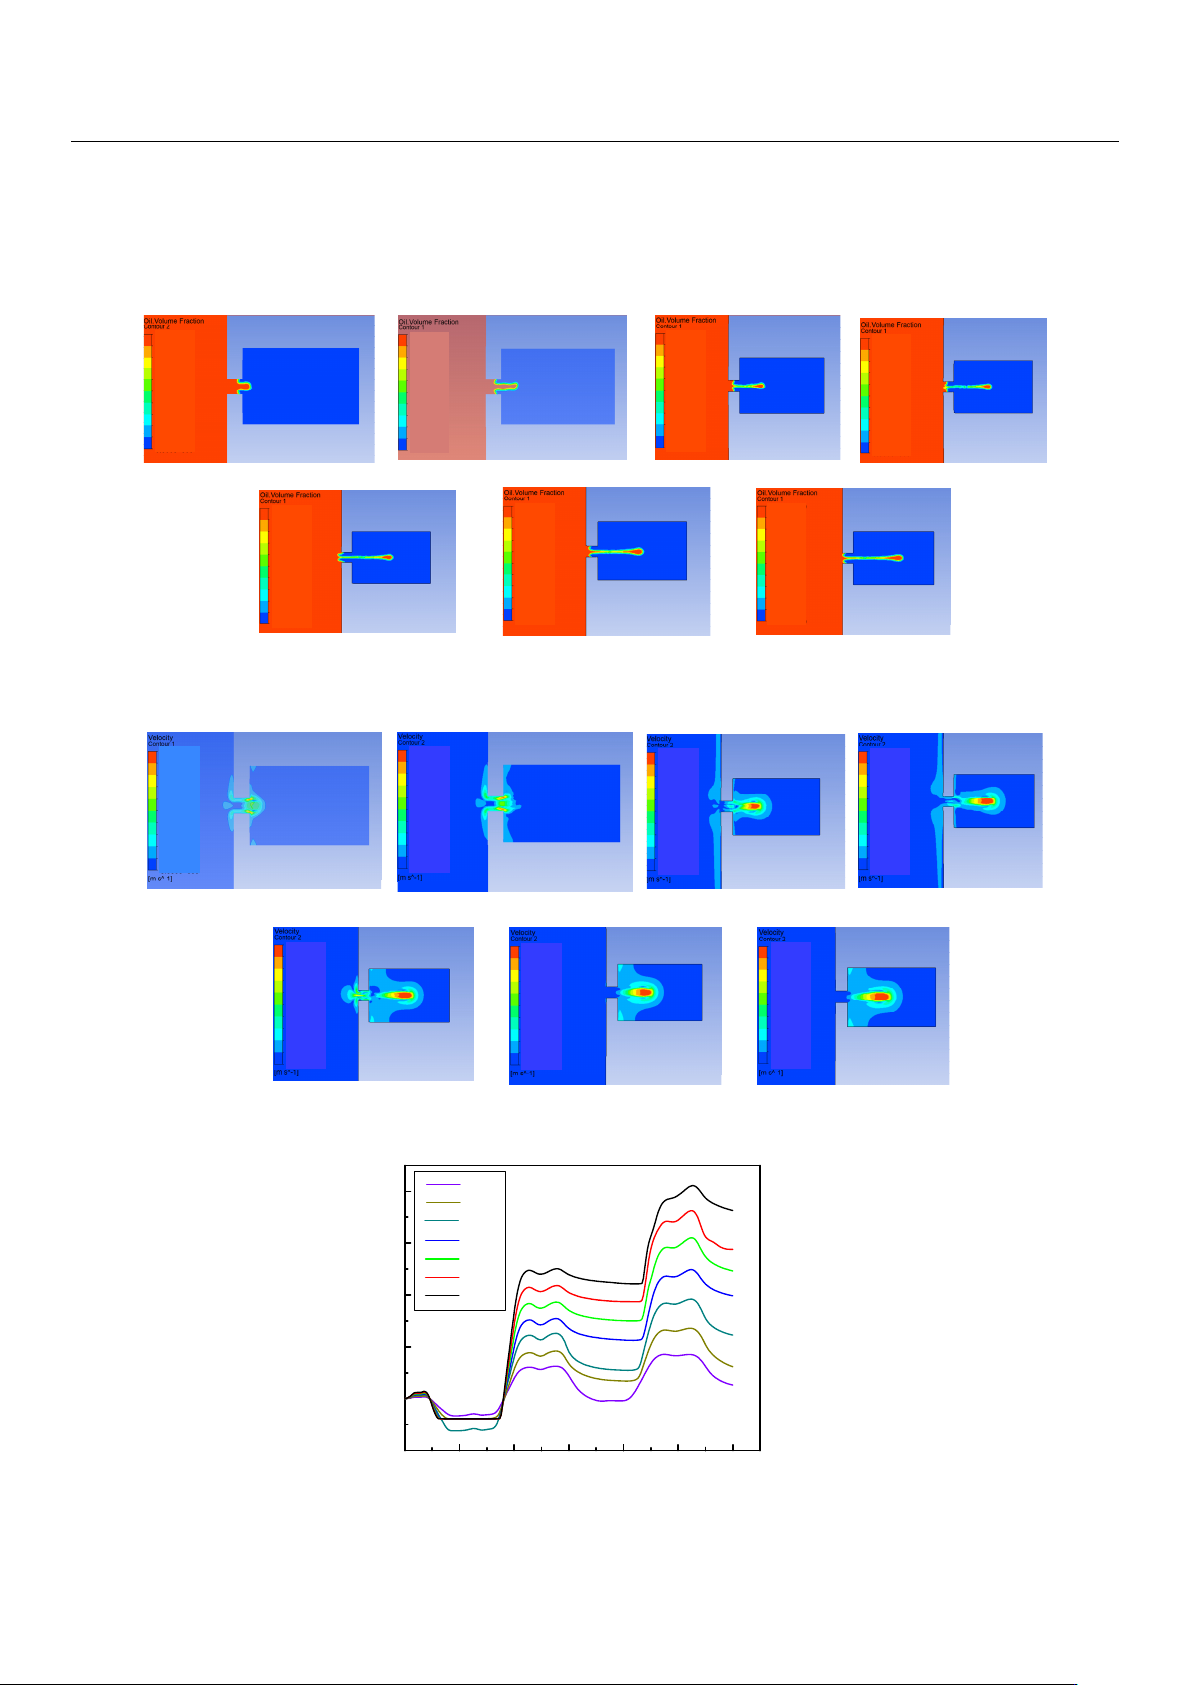
Figure 8. The change in droplet ejection state caused by the change in voltage amplitude.
Figure 9 shows the change in droplet outlet velocity caused by the change in voltage
amplitude. It can be observed that the droplet outlet velocity increases gradually with the
increase in voltage amplitude. Figure 10 reflects the influence of voltage amplitude change
on the volume of droplets ejected. It can be seen that the oil is first extruded inwards and
then injected. With the increase in voltage amplitude, the volume of droplets ejected grad-
ually increases, and the injection efficiency increases while the control accuracy of the
droplets decreases. Therefore, if you want to reduce the difficulty of injection or improve
the outlet velocity and injection efficiency of the droplets, you can appropriately increase
the voltage amplitude, and if you want to improve the control accuracy of the droplets,
you can appropriately reduce the voltage amplitude.
Figure 8. The change in droplet ejection state caused by the change in voltage amplitude.
Micromachines 2023, 14, x FOR PEER REVIEW 10 of 28
The voltage amplitude is 50V
The voltage amplitude is 75V
The voltage amplitude is 100V
The voltage amplitude is 125V
The voltage amplitude is 175VThe voltage amplitude is 150V The voltage amplitude is 200V
0.682T
1T
1T
0.64T
0.5745T
0.5125T
0.496T
4.206
0
3.73 9
3.272
2.804
2.337
1.86 9
1.402
4.674
4.674× 10
-1
9.347× 10
-1
5.147
0
4.575
4.003
3.431
2.859
2.287
1.71 6
1.144
5.71 9
5.719× 10
-1
4.992
0
4.43 7
3.882
3.328
2.773
2.21 8
1.664
1.10 9
5.546
5.546× 10
-1
9.54 4
0
8.48 3
7.42 3
6.36 3
5.30 2
4.24 2
3.181
2.12 1
1.060
1.06 0×10
1
0
9.52 5
7.93 8
6.350
4.763
3.175
1.58 8
1.58 8×10
1
1.42 9×10
1
1.270× 10
1
1.11 1×10
1
0
8.62 6
6.470
4.31 3
2.157
2.157× 10
1
1.941× 10
1
1.72 5×10
1
1.510× 10
1
1.29 4×10
1
1.078× 10
1
0
7.789
5.19 3
2.596
2.59 6×10
1
2.33 7×10
1
2.077× 10
1
1.817× 10
1
1.558× 10
1
1.298× 10
1
1.03 9×10
1
Figure 9. The change in droplet outlet velocity caused by the change in voltage amplitude.
Figure 9. The change in droplet outlet velocity caused by the change in voltage amplitude.
Micromachines 2023, 14, x FOR PEER REVIEW 11 of 28
0 0.00005 0.0001 0.00 015 0.0002 0.00025 0.0003
Droplet volume [ L ]
Time [ s ]
100V
75V
50V
125V
150V
175V
200V
0
8
810
−
×
8
610
−
×
8
410
−
×
8
210
−
×
8
210
−
−×
Figure 10. The change in the volume of droplets ejected caused by the change in voltage amplitude.
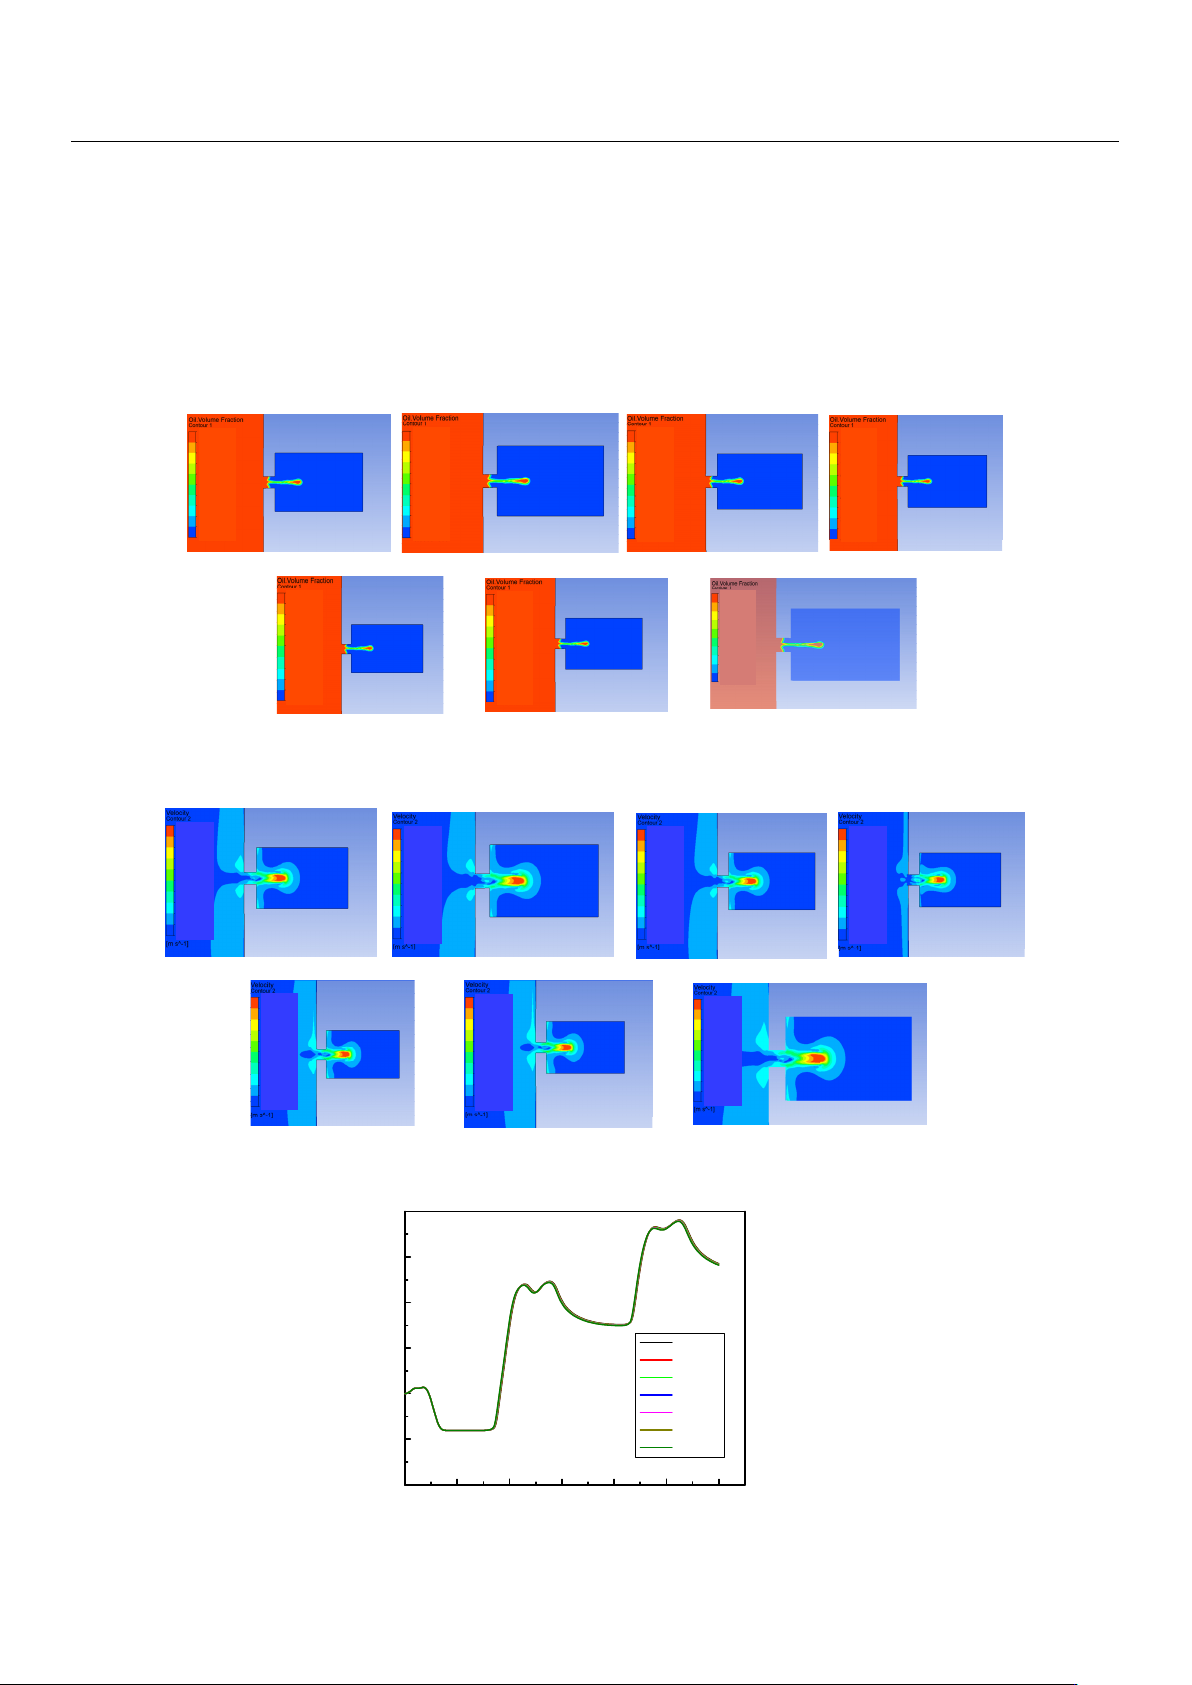
Signal frequency also has an influence on the injection performance. When the fre-
quency of the applied signal is just under the frequency of the vibrator′s operating mode,
the amplitude of the vibrator will increase, and the injection performance will be affected
by changing the vibration amplitude of the vibrator. Figures 11–13 show the influence of
the change in signal frequency on the injection performance. It can be seen from the com-
prehensive analysis of Figure 11, Figure 12 and Figure 13 that the change in signal fre-
quency has lile influence on the injection performance of the droplet within the range of
7940–8240 Hz.
Figure 10.
The change in the volume of droplets ejected caused by the change in voltage amplitude.
Micromachines 2023, 14, 1267 8 of 17
Signal frequency also has an influence on the injection performance. When the fre-
quency of the applied signal is just under the frequency of the vibrator
0
s operating mode,
the amplitude of the vibrator will increase, and the injection performance will be affected
by changing the vibration amplitude of the vibrator. Figures 11–13 show the influence
of the change in signal frequency on the injection performance. It can be seen from the
comprehensive analysis of Figures 11–13 that the change in signal frequency has little
influence on the injection performance of the droplet within the range of 7940–8240 Hz.
Micromachines 2023, 14, x FOR PEER REVIEW 12 of 28
The signal frequency is 8040Hz
The signal frequency is 8090Hz
The signal frequency is 8140Hz The signal frequency is 8190Hz The signal frequency is 8240Hz
The signal frequency is 7940Hz
The signal frequency is 7990Hz
0.682T0.698T 0.698T
0.69T
0.703T
0.7068T
0.686T
1
9.000× 10
-1
0
8.000× 10
-1
7.000× 10
-1
6.000× 10
-1
5.000× 10
-1
4.000× 10
-1
3.000× 10
-1
2.000× 10
-1
1.000× 10
-1
1
9.00 0×10
-1
0
8.000× 10
-1
7.00 0×10
-1
6.00 0×10
-1
5.00 0×10
-1
4.000× 10
-1
3.000× 10
-1
2.000× 10
-1
1.00 0×10
-1
1
9.000× 10
-1
0
8.000× 10
-1
7.000× 10
-1
6.000× 10
-1
5.000× 10
-1
4.000× 10
-1
3.000× 10
-1
2.000× 10
-1
1.000× 10
-1
1
9.00 0×10
-1
0
8.000× 10
-1
7.00 0×10
-1
6.00 0×10
-1
5.00 0×10
-1
4.000× 10
-1
3.000× 10
-1
2.000× 10
-1
1.00 0×10
-1
1
9.000× 10
-1
0
8.000× 10
-1
7.000× 10
-1
6.000× 10
-1
5.000× 10
-1
4.000× 10
-1
3.000×10
-1
2.000× 10
-1
1.000× 10
-1
1
9.000× 10
-1
0
8.000×10
-1
7.000× 10
-1
6.000× 10
-1
5.000× 10
-1
4.000×10
-1
3.000× 10
-1
2.000×10
-1
1.000× 10
-1
1
9.000× 10
-1
0
8.000× 10
-1
7.000× 10
-1
6.000× 10
-1
5.000× 10
-1
4.000× 10
-1
3.000×10
-1
2.000× 10
-1
1.000× 10
-1
Figure 11. The change in droplet ejection state caused by the change in signal frequency.
Figure 11. The change in droplet ejection state caused by the change in signal frequency.
Micromachines 2023, 14, x FOR PEER REVIEW 13 of 28
The signal frequency is 8040Hz
The signal frequency is 8090Hz
The signal frequency is 8140Hz
The signal frequency is 8190Hz
The signal frequency is 8240Hz
The signal frequency is 7940Hz
The signal frequency is 7990Hz
0.682T
0.698T
0.698T 0.69T
0.703T
0.7068T
0.686T
0
1.61 3
1.075
5.377
4.839
4.301
3.76 4
3.226
2.68 8
2.15 1
5.37 7×10
-1
0
1.613
1.07 6
5.37 8
4.84 0
4.30 2
3.764
3.22 7
2.689
2.151
5.378×10
-1
0
1.61 8
1.079
5.39 3
4.85 4
4.315
3.77 5
3.236
2.697
2.15 7
5.39 3×10
-1
0
1.664
1.10 9
5.54 6
4.99 2
4.43 7
3.882
3.32 8
2.773
2.21 8
5.546×10
-1
0
1.63 5
1.09 0
5.449
4.904
4.35 9
3.81 4
3.26 9
2.72 5
2.180
5.44 9×10
-1
0
1.63 4
1.089
5.44 5
4.90 1
4.356
3.81 2
3.26 7
2.723
2.17 8
5.44 5×10
-1
0
1.62 9
1.08 6
5.428
4.886
4.34 3
3.80 0
3.257
2.71 4
2.171
5.42 8×10
-1
Figure 12. The change in droplet outlet velocity caused by the change in signal frequency.
Figure 12. The change in droplet outlet velocity caused by the change in signal frequency.
Micromachines 2023, 14, x FOR PEER REVIEW 14 of 28
7940Hz
7990Hz
8040Hz
8090Hz
8140Hz
8190Hz
8240Hz
Droplet volume [ L ]
0 0.00005 0.0001 0.00015 0.0002 0.00025 0.0003
Time [ s ]
0
8
410
−
×
8
310
−
×
8
210
−
×
8
110
−
×
8
110
−
−×
8
210
−
−×
Figure 13. The change in the volume of droplets ejected caused by the change in signal frequency.
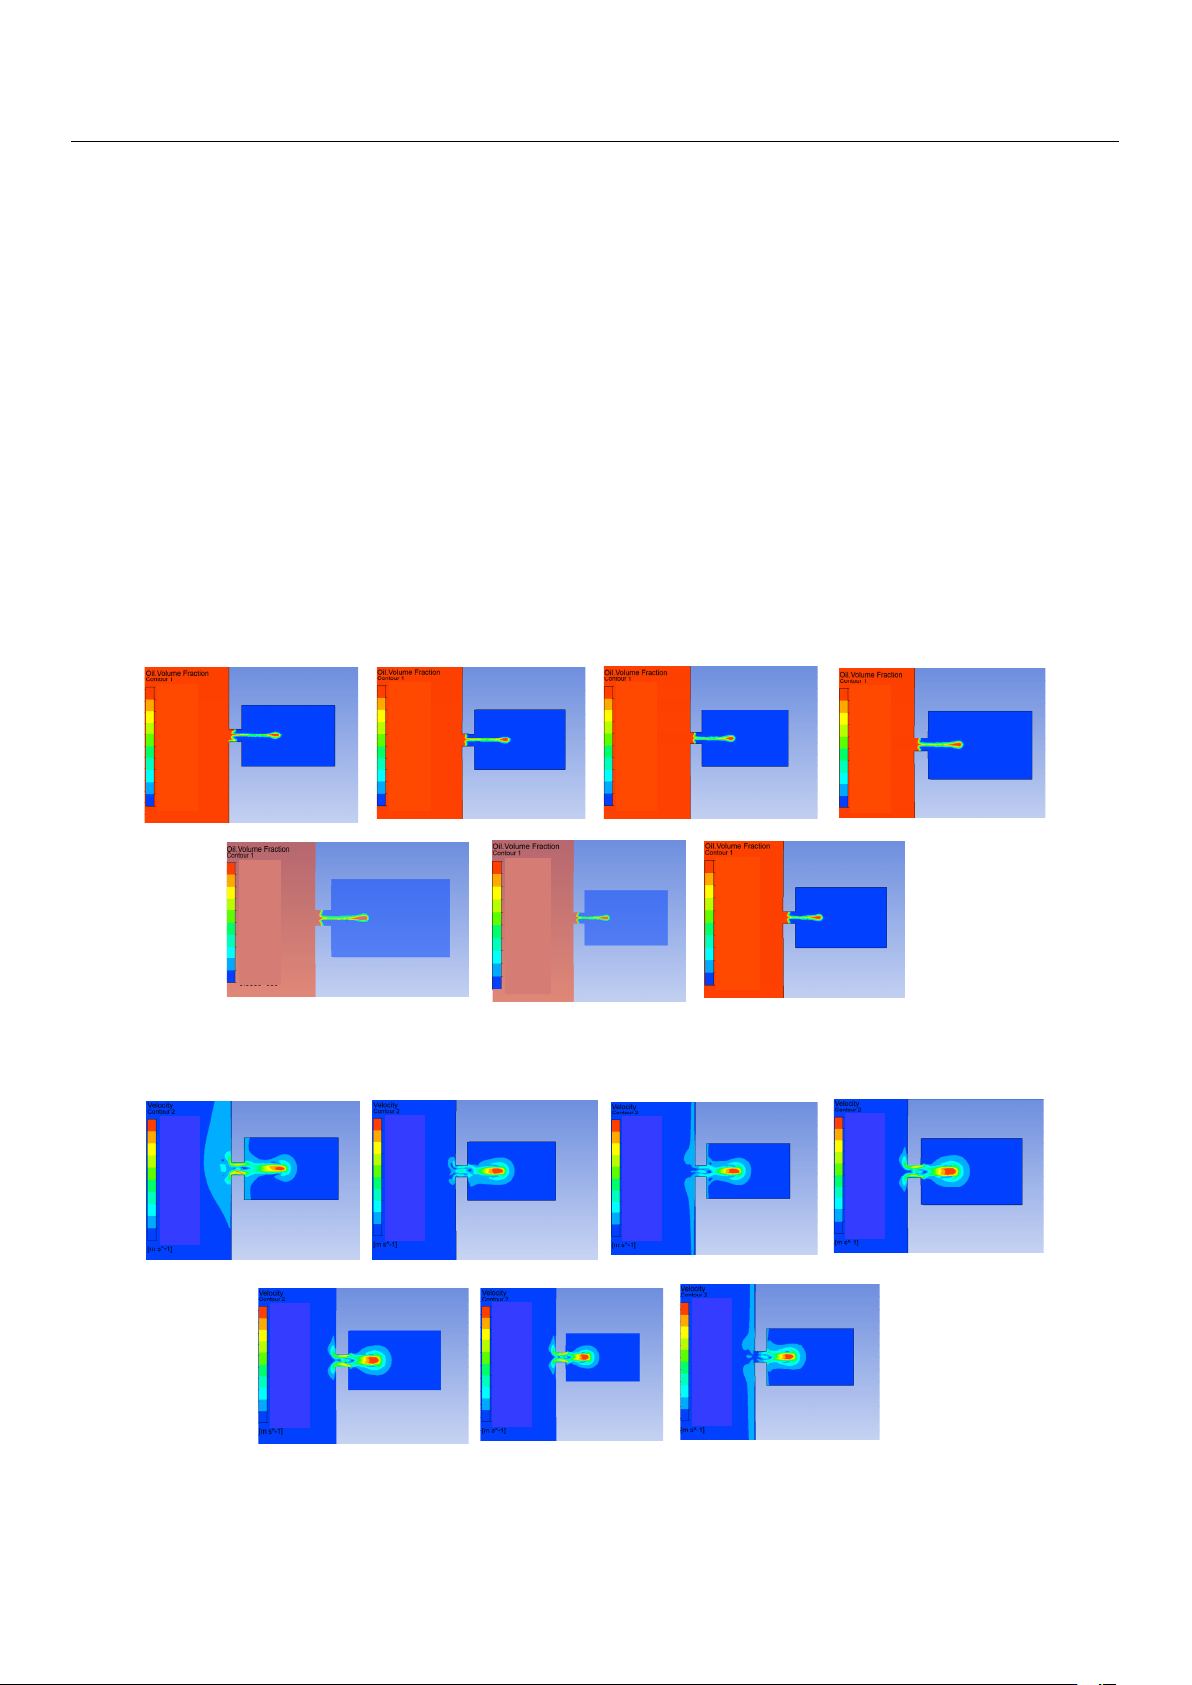
Changing the viscosity of the oil will change the viscous resistance of the liquid, and
a change in the viscous resistance will lead to a change in kinetic energy loss during the
movement of the droplets. The influence of the change in the oil viscosity on the injection
performance is shown in Figures 14–16. Figure 14 reflects the influence of the change in
oil viscosity on the ejection state of the droplets. It can be seen that with the increase in oil
viscosity, the droplets are more difficult to be ejected, and the time of ejection is later.
Figure 15 shows the influence of the change in oil viscosity on the outlet velocity of the
droplet. With the increase in oil viscosity, the larger the kinetic energy loss of the droplet,
the lower the outlet velocity. Figure 16 reflects the influence of the change in oil viscosity
on the volume of droplets ejected. The analysis shows that when the viscosity is less than
100 Pa.s, the higher the oil viscosity, the smaller the volume of droplets ejected, and the
higher the control accuracy but the lower the efficiency. When the oil viscosity is between
100 and 200 Pa.s, the oil viscosity has lile influence on the volume of droplets. The com-
prehensive analysis shows that when the oil viscosity is greater than 100 Pa.s, the increase
in the oil viscosity has a weak effect on the improvement in the control accuracy, but it
will reduce the droplet outlet velocity and increase the difficulty of droplet injection,
which will lead to the unsatisfactory injection performance of the device.
Figure 13. The change in the volume of droplets ejected caused by the change in signal frequency.
Micromachines 2023, 14, 1267 9 of 17
Changing the viscosity of the oil will change the viscous resistance of the liquid, and
a change in the viscous resistance will lead to a change in kinetic energy loss during the
movement of the droplets. The influence of the change in the oil viscosity on the injection
performance is shown in Figures 14–16. Figure 14 reflects the influence of the change
in oil viscosity on the ejection state of the droplets. It can be seen that with the increase
in oil viscosity, the droplets are more difficult to be ejected, and the time of ejection is
later. Figure 15 shows the influence of the change in oil viscosity on the outlet velocity
of the droplet. With the increase in oil viscosity, the larger the kinetic energy loss of the
droplet, the lower the outlet velocity. Figure 16 reflects the influence of the change in oil
viscosity on the volume of droplets ejected. The analysis shows that when the viscosity is
less than 100 Pa.s, the higher the oil viscosity, the smaller the volume of droplets ejected,
and the higher the control accuracy but the lower the efficiency. When the oil viscosity is
between 100 and 200 Pa.s, the oil viscosity has little influence on the volume of droplets.
The comprehensive analysis shows that when the oil viscosity is greater than 100 Pa.s, the
increase in the oil viscosity has a weak effect on the improvement in the control accuracy,
but it will reduce the droplet outlet velocity and increase the difficulty of droplet injection,
which will lead to the unsatisfactory injection performance of the device.
Micromachines 2023, 14, x FOR PEER REVIEW 15 of 28
The oil viscosity is 125cs
The oil viscosity is 150cs
The oil viscosity is 175cs
The oil viscosity is 200cs
The oil viscosity is 10cs
The oil viscosity is 50cs
The oil viscosity is 100cs
0.62T 0.628T 0.637T
0.641T
0.653T
0.6572T
0.682T
1
9.00 0×10
-1
0
8.000×10
-1
7.00 0×10
-1
6.00 0×10
-1
5.00 0×10
-1
4.000×10
-1
3.00 0×10
-1
2.000×10
-1
1.00 0×10
-1
1
9.00 0×10
-1
0
8.00 0×10
-1
7.00 0×10
-1
6.00 0×10
-1
5.00 0×10
-1
4.00 0×10
-1
3.00 0×10
-1
2.00 0×10
-1
1.00 0×10
-1
1
9.00 0×10
-1
0
8.000×10
-1
7.00 0×10
-1
6.00 0×10
-1
5.00 0×10
-1
4.000×10
-1
3.00 0×10
-1
2.000×10
-1
1.00 0×10
-1
1
9.00 0×10
-1
0
8.00 0×10
-1
7.00 0×10
-1
6.00 0×10
-1
5.00 0×10
-1
4.00 0×10
-1
3.00 0×10
-1
2.00 0×10
-1
1.00 0×10
-1
1
9.00 0×10
-1
0
8.00 0×10
-1
7.00 0×10
-1
6.00 0×10
-1
5.00 0×10
-1
4.00 0×10
-1
3.00 0×10
-1
2.00 0×10
-1
1.00 0×10
-1
1
9.00 0×10
-1
0
8.00 0×10
-1
7.00 0×10
-1
6.00 0×10
-1
5.00 0×10
-1
4.00 0×10
-1
3.000×10
-1
2.00 0×10
-1
1.00 0×10
-1
1
9.00 0×10
-1
0
8.00 0×10
-1
7.00 0×10
-1
6.00 0×10
-1
5.00 0×10
-1
4.00 0×10
-1
3.000×10
-1
2.00 0×10
-1
1.00 0×10
-1
Figure 14. The change in droplet ejection state caused by the change in oil viscosity.
Figure 14. The change in droplet ejection state caused by the change in oil viscosity.
Micromachines 2023, 14, x FOR PEER REVIEW 16 of 28
The oil viscosity is 125cs
The oil viscosity is 150cs The oil viscosity is 175cs
The oil viscosity is 200cs
The oil viscosity is 10cs
The oil viscosity is 50cs
The oil viscosity is 100cs
0.62T 0.628T 0.637T 0.641T
0.653T
0.6572T
0.682T
9.28 3
0
8.252
7.22 0
6.18 9
5.15 7
4.126
3.094
2.063
1.031
1.031×10
1
8.770
0
7.795
6.821
5.846
4.872
3.898
2.923
1.949
9.744
9.744× 10
-1
7.676
0
6.823
5.970
5.117
4.264
3.411
2.55 9
1.706
8.529
8.529×10
-1
7.161
0
6.36 6
5.570
4.774
3.978
3.18 3
2.387
1.59 1
7.957
7.957× 10
-1
6.494
0
5.77 2
5.051
4.329
3.608
2.88 6
2.165
1.44 3
7.215
7.215×10
-1
5.825
0
5.17 7
4.530
3.883
3.236
2.58 9
1.942
1.29 4
6.472
6.472×10
-1
4.992
0
4.437
3.882
3.328
2.773
2.218
1.664
1.109
5.546
5.546×10
-1
Figure 15. The change in droplet outlet velocity caused by the change in oil viscosity.
Figure 15. The change in droplet outlet velocity caused by the change in oil viscosity.