00197726-12_VB_SE3.11_DE_EN.pdf - 第17页
SIPLACE Explorer from 3. 11 (R 20 -2) Ausgabe 11/20 20 Edition 17 of 44 Timestamp of the placement data Components Placement area 1 Components Placement area 2 Boards 1 2 3 4 5 6 7 8 1 2 3 4 5 6 7 8 T1 T2 1 2 3 4 5 6 7 8…

SIPLACE Explorer from 3.11 (R20-2) Ausgabe 11/2020 Edition
16 of 44
NOTICE
Discontinued SIPLACE placement machines are not listed in the table above.
The standard SIPLACE Explorer delivery package supports the above listed SIPLACE machines.
SIPLACE Explorer can also be used with other line components (e.g. screen printers and reflow ovens)
and for the evaluation of production performance with the Standard Monitoring Application (SMA) or other
applications.
For detailed information about special components and interfaces, please contact your regional SIPLACE
sales partner.
4.5 Interfaces
SIPLACE Explorer does not provide any interfaces. However, a connection to OIS and SIS does exist, as
SIPLACE Explorer receives all required data from the OIS and SIS via so-called database views. For
further information about OIS and SIS database views, please see the following descriptions:
● SIPLACE OIS / SIS Databases 18.0 Interface Description.
4.6 Possible Placement Data Deviations Between SIPLACE
Explorer and OIS
The number of consumed components, rejects and boards can differ between SIPLACE Explorer and
OIS.
In OIS, each data set has a time stamp (consumed components, rejected components and each board).
If you start an OIS query for the consumption within a specific time period, via SQL Query, OIS will issue
the number of data sets which have a time stamp within this period.
SIPLACE Explorer, on the other hand, assigns the components to the boards on which they are to be
placed. If you start a query for the consumption within a specific time period, SIPLACE Explorer will issue
the number of components which have been placed on the boards which were produced within the
defined period. This difference becomes clearer when we consider production in 2 placement areas.
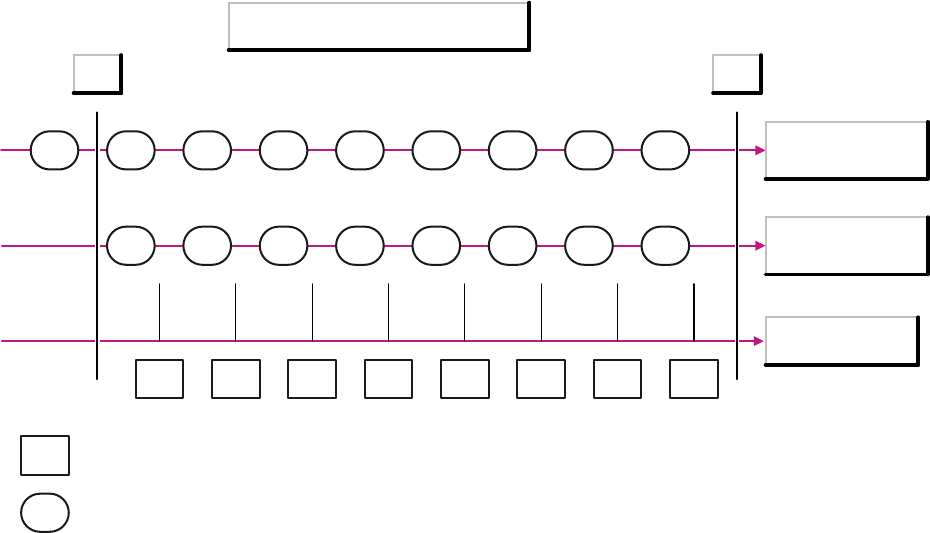
The following diagram illustrates the difference.
Example: 8 boards were placed on a machine with 2 placement areas. The diagram shows 3 timelines:
● Components for placement area 1
● Components for placement area 2
● Boards
The components X on the timeline for placement area 1 show the possible timestamps for those
components which were placed on board X.
SIPLACE Explorer from 3.11 (R20-2) Ausgabe 11/2020 Edition
17 of 44
Timestamp of the placement data
Components
Placement area 1
Components
Placement area 2
Boards
1 2 3 4 5 6 7 8
1 2 3 4 5 6 7 8
T1 T2
1 2 3 4 5 6 7 8 9
X
X
= Board
= Component record
If you start an OIS query via SQL Query, for the time between T1 and T2, the result will show the total
number of components which were placed on all 8 boards minus the number of components which were
placed on board 1 of placement area 1.
If you start the same query via SIPLACE Explorer, the result will show the total number of components
which were placed on all 8 boards.
In this example, the result in SIPLACE Explorer will be higher than the number shown in OIS.
However, this is not always the case. If board 9 is placed (in placement area 1 in the diagram), SIPLACE
Explorer will not count the components which were placed on this board and will therefore show fewer
components as the OIS.
For this reason, there will also be deviations between OIS and SIPLACE Explorer in the determination of
component reject numbers.
SIPLACE Explorer from 3.11 (R20-2) Ausgabe 11/2020 Edition
18 of 44
4.7 Status Display Deviations between SIPLACE Explorer and OIS
There is a special OIS status model realized in SIPLACE OIS. This OIS status model is shown in the
SIPLACE Explorer status model which matches the SEMI E10 status module. This may lead to deviations
in the states and status times shown between OIS and SIPLACE Explorer. A direct comparison is
therefore not possible.
1. Differences in status models and their states:
OIS has a status model for each of the two processing areas but no status model for the entire
machine. SIPLACE Explorer, on the other hand, does have a status model for the whole machine
(E10).
OIS recognizes the following 5 states:
● Running
● Starved
● Blocked
● Interrupted, fault
There are no substates.
The E10 status model in SIPLACE Explorer recognizes the following 6 states:
● Productive
● Standby
● Engineering
● Scheduled Downtime
● Unscheduled Downtime
● Nonscheduled Time
● There is also a special status Unknown.
Many of these states have substates, such as:
● The status Productive has the following substates:
– Zone1Productive_Zone2Productive, Zone1Productive_Zone2Blocked
– Zone1Blocked_Zone2Productive, Zone1Productive_Zone2Starved
– Zone1Starved_Zone2Productive.
The OIS states cannot be shown by the SIPLACE Explorer E10 status.