0197787-01_UM_HeadVerification_708_EN.pdf - 第46页
SIPLACE Head V erification User Manual Edition 01/2015 46 Use the button to zoom in on the diagram . 16. This diagram illustrates th e "Z down delt a pick m in/max [µm] (11,12)" values f or the segm ents. Blue …
SIPLACE Head Verification
User Manual Edition 01/2015
45
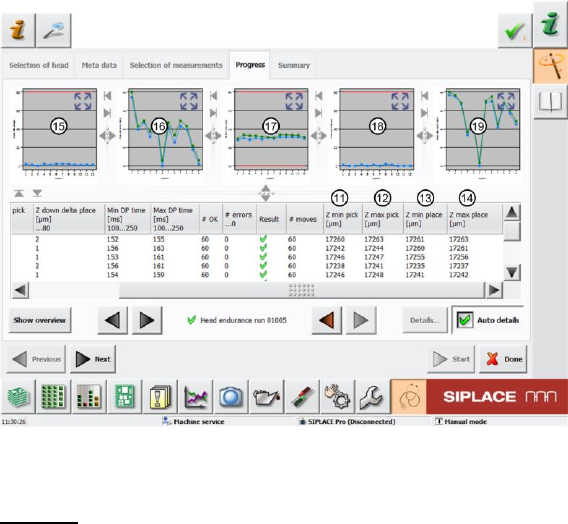
Figure 29: Head endurance run 01005_2 result
Legend:
1. Segment measured
2. Total number of cycles
3. Value determined Z down delta pick [µm]
This value is calculated by finding the difference between the lowest (Z min pick [µm] (11))
and the highest (Z max pick [µm] (12)) Z axis positioning value during the pickup cycles.
This value must be within a plausible tolerance (in this case 0..80µm).
Z down delta pick [µm] = Z max pick [µm] - Z min pick [µm]
4. Value determined Z down delta place [µm]
This value is calculated by finding the difference between the lowest (Z min place [µm]
(13)) and the highest (Z max place [µm] (14)) Z axis positioning value during the pickup
cycles.
This value must be within a plausible tolerance (in this case 0..80µm)!
Z down delta place [µm] = Z max place [µm] - Z min place [µm]
5. The Min DP time [ms] value is the shortest DP positioning time reached during positioning at
180°. This value must be within a plausible tolerance (in this case 100..250µm)!
6. The Max DP time [ms] value is the longest DP positioning time reached during positioning at
180°. This value must be within a plausible tolerance (in this case 100..250µm)!
7. Results display for number of successful strokes
8. Number of errors during 30x total cycles.
9. Results display (OK green tick / NOK red X)
10. Number of individual Z axis movements (in our case 30x down + 30x up = 60)
11. Z min pick [µm] is the lowest Z axis positioning value achieved during the pickup cycles.This
value is used to calculate the Z down delta pick [µm] (3) value.
12. Z max pick [µm] is the highest Z axis positioning value achieved during the pickup
cycles.This value is used to calculate the Z down delta pick [µm] (3) value.
13. Z min place [µm] is the lowest Z axis positioning value achieved during the placement
cycles.This value is used to calculate the Z down delta place [µm] (4) value.
14. Z max place [µm] is the highest Z axis positioning value achieved during the placement
cycles.This value is used to calculate the Z down delta place [µm] (4) value.
15. This diagram illustrates the "Z down delta pick [µm] (3)" values for the segments.
Blue line Z down delta pick [µm]
Red border Min and max tolerances (in our case 0..80µm)
SIPLACE Head Verification
User Manual Edition 01/2015
46
Use the button to zoom in on the diagram.
16. This diagram illustrates the "Z down delta pick min/max [µm] (11,12)" values for the segments.
Blue line Z down pick min [µm]
Green line Z down pick max [µm]
Use the button to zoom in on the diagram.
17. This diagram illustrates the "DP time min/max [ms] (5,6)" values for the segments.
Blue line DP time min [ms]
Green line DP time max [ms]
Red border Min and max tolerances (in our case 100..250ms)
Use the button to zoom in on the diagram.
18. This diagram illustrates the "Z down delta place [µm] (4)" values for the segments.
Blue line Z down delta pick [µm]
Red border Min and max tolerances (in our case 0..80µm)
Use the button to zoom in on the diagram.
19. This diagram illustrates the "Z down delta place min/max [µm] (13,14)" values for the
segments.
Blue line Z down place min [µm]
Green line Z down place max [µm]
Use the button to zoom in on the diagram.
4.7.3 Explanation of Measurement Results Using Results PDF
These results can be seen if you scroll down the "Summary" menu or generate a results PDF!
Figure 30: Results PDF for head endurance run 01005_1
SIPLACE Head Verification
User Manual Edition 01/2015
47
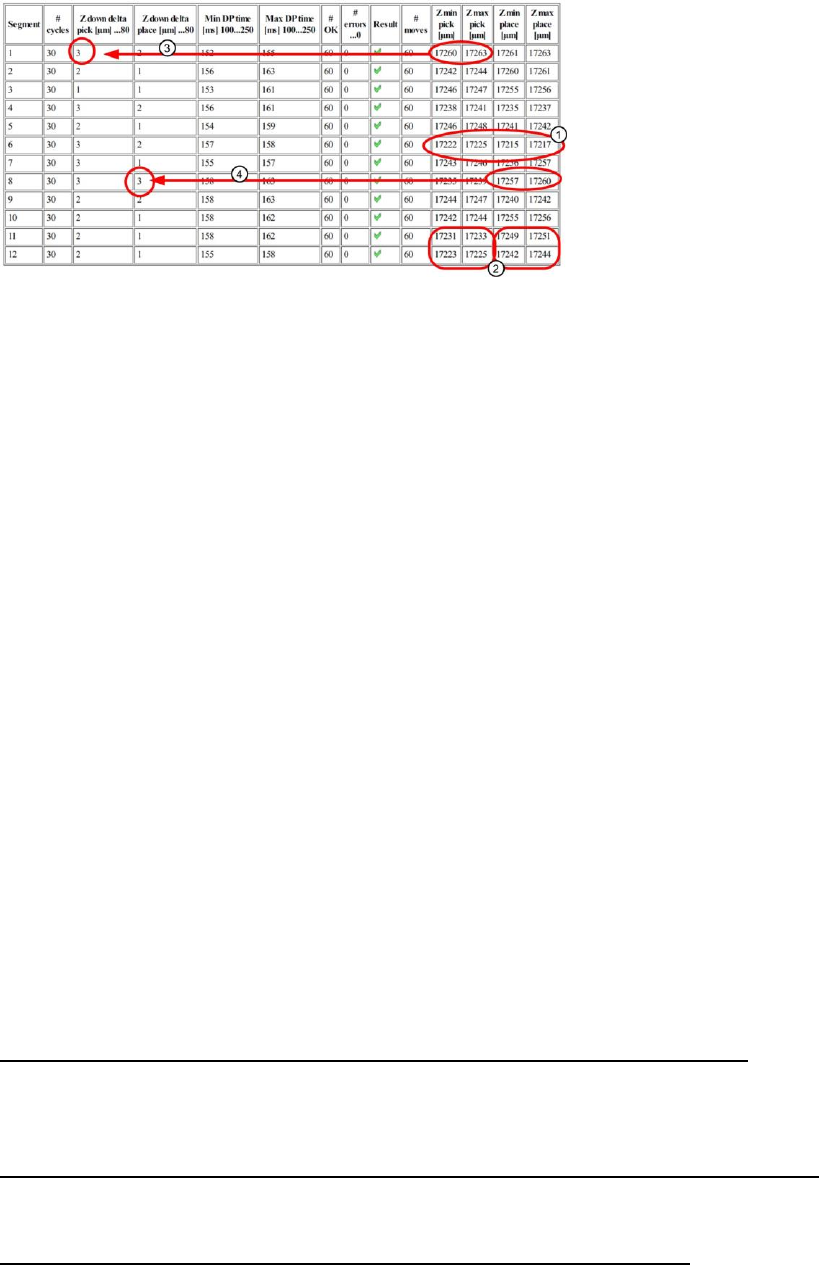
Figure 31: Results PDF for head endurance run 01005_2
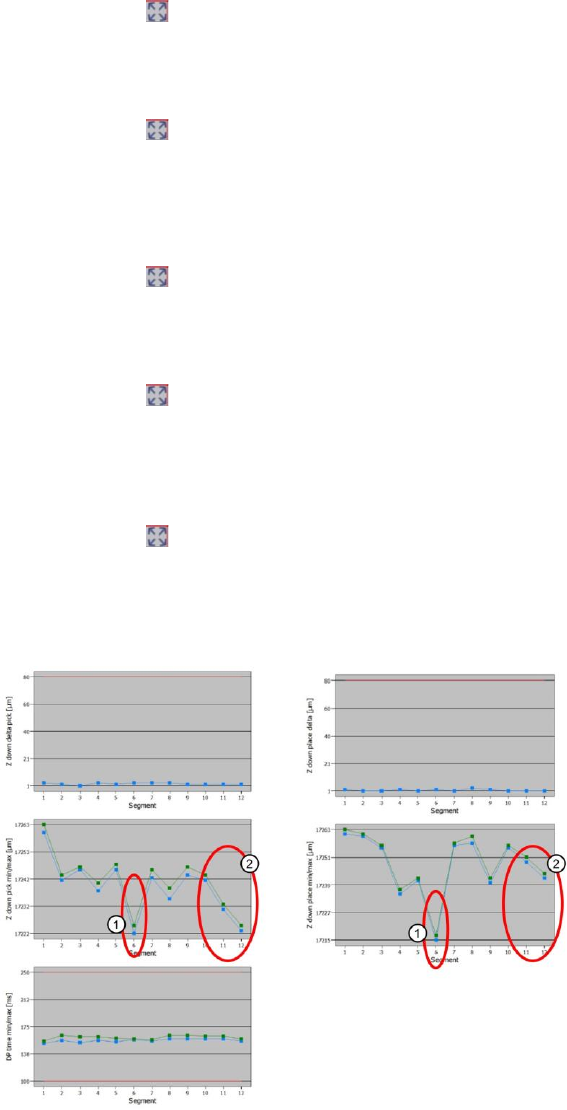
Point 1:
The "Z down pick min/max" and "Z down place min/max" diagrams, plus the corresponding
measurements in the table, indicate that segment 6 deviates from all other segments both during
pickup and during placement! During both movements, this segment was not able to move so far
downwards as the other segments.
This may be due to a linear guide which has difficulty moving at this segment.
Point 2:
The "Z down pick min/max" and "Z down place min/max" diagrams, plus the corresponding
measurements in the table, indicate that segments 11 and 12 deviate significantly between pickup and
placement. The Z axis does not move as far downwards during pickup as it does during placement.
One possible cause could be that the DP linear guide have difficulty moving and that the segment or
DP linear guide may soon need replacing.
Point 3:
We can see here how the "Z down delta pick [ms]" value is calculated using the two threshold values
"Z min pick [ms]" and "Z max pick [max]". A value which is leaning towards the upper threshold (in this
example 80µm) indicates a problem with the linear guide for that segment.
Point 4:
We can see here how the "Z down delta place [ms]" value is calculated using the two threshold values
"Z min place [ms]" and "Z max place [max]". A value which is leaning towards the upper threshold (in
this example 80µm) indicates a problem with the linear guide for that segment.
4.7.4 Meaning of the Results
"Z down delta pick [µm]" and "Z down delta place [µm]" errors at all segments:
1. Z motor defective Replace Z motor
2. Z motor linear guide has difficulty moving Replace Z motor
3. Read unit of Z motor is dirty Clean the read unit
"Z down delta pick [µm]" and "Z down delta place [µm]" errors at individual segments:
1. DP linear guide has difficulty moving Replace DP
2. Linear guide for segment has difficulty moving Replace linear guide for segment
"Min DP time [ms]" or "Max DP time [ms]" errors at individual segments:
1. Internal DP/segment problem Replace DP/segment