0197787-01_UM_HeadVerification_708_EN.pdf - 第63页
SIPLACE Head V erification User Manual Edition 01/2015 63 The CS Variation [ µm] val ue shows the com ponent sensor CS pos 1 - 6 variance in accordance with the ro tary angle of th e segment. The "CS Variation [µm ]…
SIPLACE Head Verification
User Manual Edition 01/2015
62
4.11.2 Explanation of Measurement Results in "Progress" Menu
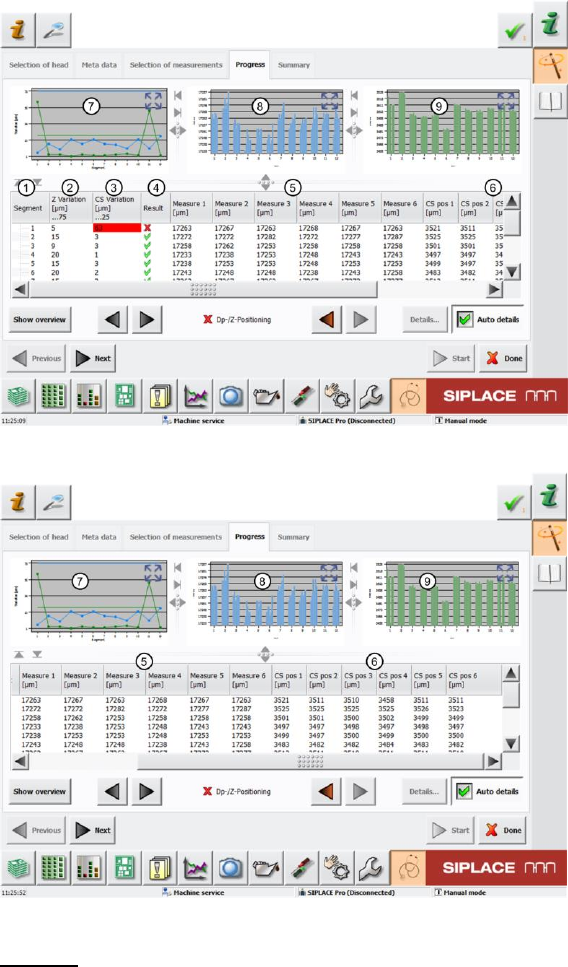
After completion of the measurement, the following results appear in the "Progress" menu:
Figure 41: DP-Z positioning_1 result
Figure 42: DP-Z positioning_2 result
Legend:
1. Segment measured
2. Value determined Z Variation [µm] This value is calculated by finding the difference
between the minimum and maximum Measure 1 – Measure 6 value (end position signal Z-
down light barrier).
Z Variation [µm] = Maximum Measure 1-6 [µm] value – Minimum Measure 1-6 [µm] value
The Z Variation [µm] value shows the Z-down light barrier end position signal variance in
accordance with the rotary angle of the segment.
The "Z Variation [µm]" value must be within a plausible tolerance (in our case 0..75µm).
If the value is outside this tolerance, it is not possible to guarantee accurate placement at
every angle.
3. Value determined CS Variation [µm] This value is calculated by finding the difference
between the minimum and maximum CS pos 1 – CS pos 6 value (interruption of component
sensor).
CS Variation [µm] = Maximum CS pos 1-6 [µm] value – Minimum CS pos 1-6 [µm] value
SIPLACE Head Verification
User Manual Edition 01/2015
63
The CS Variation [µm] value shows the component sensor CS pos 1-6 variance in
accordance with the rotary angle of the segment.
The "CS Variation [µm]" value must be within a plausible tolerance (in our case 0..25µm).
If the value is outside this tolerance, it is not possible to guarantee accurate placement at
every angle.
4. Results display (OK green tick / NOK red X)
5. The values Measure 1 [µm] – Measure 6 [µm] are as follows:
Rotary angle 0° Light barrier Z-down measure 1 [µm]
Rotary angle 60° Light barrier Z-down measure 2 [µm]
Rotary angle 120° Light barrier Z-down measure 3 [µm]
Rotary angle 180° Light barrier Z-down measure 4 [µm]
Rotary angle 240° Light barrier Z-down measure 5 [µm]
Rotary angle 300° Light barrier Z-down measure 6 [µm]
6. The values CS pos 1 [µm] – CS pos 6 [µm] are as follows:
Rotary angle 0° Component sensor value CS pos 1 [µm]
Rotary angle 60° Component sensor value CS pos 2 [µm]
Rotary angle 120° Component sensor value CS pos 3 [µm]
Rotary angle 180° Component sensor value CS pos 4 [µm]
Rotary angle 240° Component sensor value CS pos 5 [µm]
Rotary angle 300° Component sensor value CS pos 6 [µm]
7. This diagram illustrates the "Variation [µm] (2)" values for the segments.
Blue line Z Variation [µm]
Green line CS Variation [µm]
8. This diagram illustrates the "Measure1" – "Measure6" values for the segments.
Blue bar one bar each for "Measure1(0°)" – "Measure6 (300°)"
If the Z-down light barrier is working reliably, the bars should
ideally be the same height or have little variance to the other
segments.
9. This diagram illustrates the "CS pos 1" – "CS pos 6" values for the segments.
Green bar one bar each for "Measure1(0°)" – "Measure6 (300°)"
If the component sensor is working reliably, the bars should ideally
be the same height or have little variance to the other segments.
SIPLACE Head Verification
User Manual Edition 01/2015
64
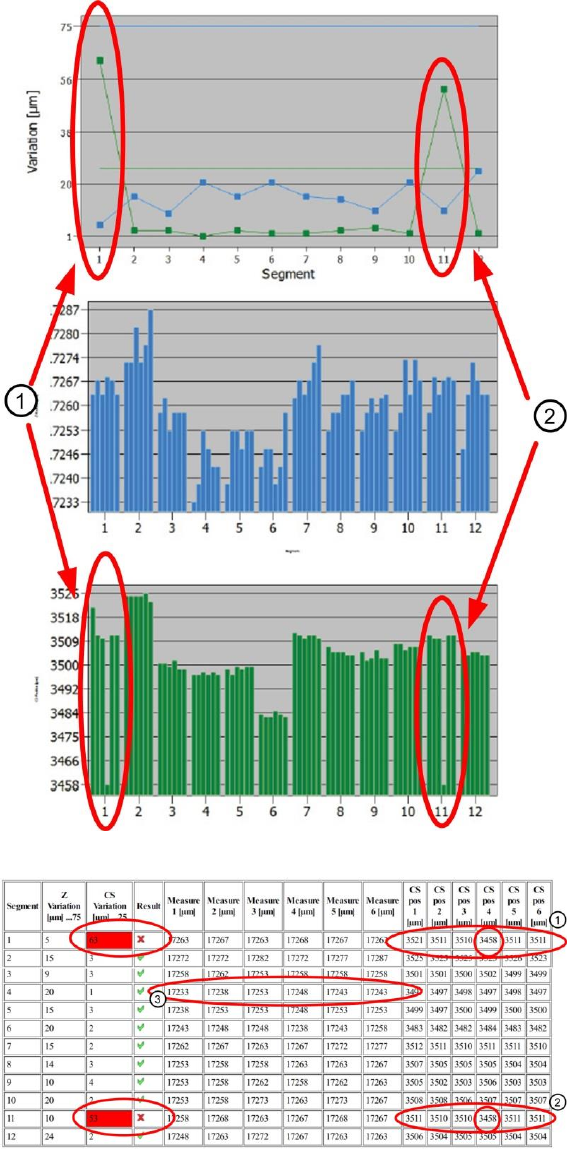
4.11.3 Explanation of Measurement Results Using Results PDF
These results can be seen if you scroll down the "Summary" menu or generate a results PDF!
Figure 43: Results PDF DP-Z positioning_1
Figure 44: Results PDF DP-Z positioning_2
You can see that, in the case of segment 1 (1) and also segment 11 (2), the component sensor CS
pos 4 [µm] switches earlier at an angle of 180°. This is shown in the green bar chart.
This low value also means that the "CS Variation [µm]" value is outside the permitted tolerance.
Reliable placement of the entire DP positioning area can therefore not be guaranteed.