0197787-01_UM_HeadVerification_708_EN.pdf - 第72页
SIPLACE Head V erification User Manual Edition 01/2015 72 4.13.3 Ex planation of Measurement Results Using Results PDF These results can b e seen if you scroll down the "Sum mary" menu or generat e a results PD…

SIPLACE Head Verification
User Manual Edition 01/2015
71
8. The Radial runout 360° [µm] value describes the complete change in nozzle length
determined during segment rotation across 360°. This value is calculated by finding the
difference between the smallest (shortest measurement) nozzle length and the largest
(longest measurement) nozzle length found during rotation across the entire 360°. This value
must be within a plausible tolerance (in our example 0..100µm)!
9. Results display (OK green tick / NOK red X)
10. The Variation 5° [µm] value is the highest increase in voltage for the Z-down light barrier
during rotation of the segment in an area of 5°, while rotating around the full 360°
11. The Variation 360° [µm] value is the voltage difference for the Z-down light barrier by rotation
of the segment around the full 360°. This difference is calculated by finding the greatest
analog voltage value Max value [mV] for the Z-down light barrier and the smallest analog
voltage value Min value [mV] during a complete rotation of the DP around the full 360°.
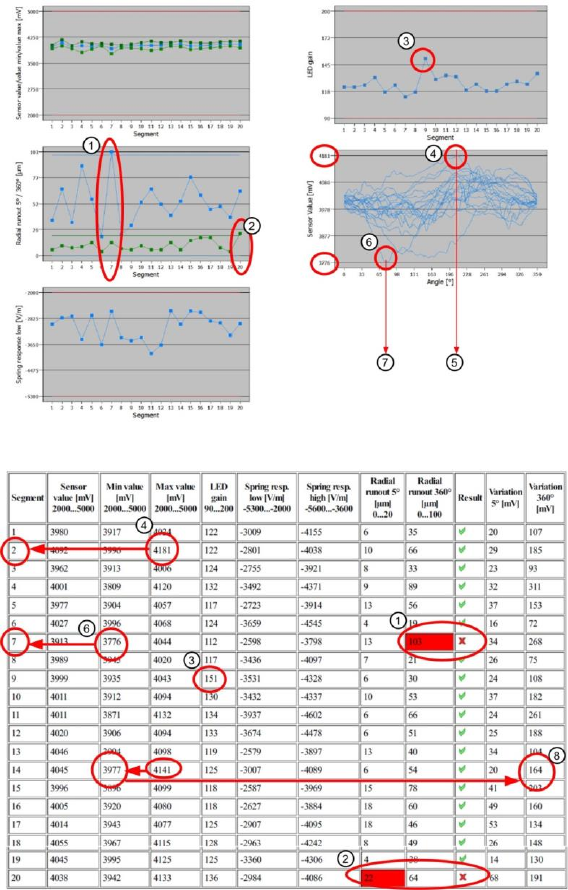
12. This diagram illustrates the Sensor value [mV] (2) / Min value [mV] (3) / Max value [mV] (3)
values for the segments.
Blue line Sensor value [mV]
Light green line Min value [mV]
Dark green line Max value [mV]
Red border Min and max tolerances (in our case 2000..5000mV)
Use the button to zoom in on the diagram.
13. This diagram illustrates the Radial runout 5° [µm] (7) / Radial runout 360° [µm] (8) values
for the segments.
Blue line Radial runout 360° [µm]
Green line Radial runout 5° [µm]
Blue border Tolerances for "Radial runout 360° min and max" (in our case 0…100µm)
Green border Tolerances for "Radial runout 5° min and max" (in our case 0…20µm)
Use the button to zoom in on the diagram.
14. This diagram shows the Spring response low [V/m] (5) value.
Blue line Spring response low [V/m]
Red border Tolerances for "Spring response low [V/m]" (in our case -2000..-5300V/m)
Use the button to zoom in on the diagram.
15. This diagram shows the LED gain value.
Blue line LED gain
Red border Tolerances for "LED gain" (in our case 90..200)
16. This diagram shows the Sensor Value [mV] values as a curve for each segment during the
360° rotation.
Blue lines Each segment has its own curve, illustrating the path of the analog voltage
values for the Z-down light barrier during the 360° rotation. The analog voltage value is an
indication for the distance between the switching ring and the light barrier at each position
during the rotation. Due to the light-dark recognition, contaminants (dust) can be detected on
the black surface of the switching ring.
SIPLACE Head Verification
User Manual Edition 01/2015
72
4.13.3 Explanation of Measurement Results Using Results PDF
These results can be seen if you scroll down the "Summary" menu or generate a results PDF!
Figure 49: Result PDF for ZDS sensor values_1
Figure 50: Result PDF for ZDS sensor values_2
Segment 7 shows that the "Radial runout 360°" value of 103µm (1) is significantly above the
permissible threshold. This means that the nozzle length during a complete 360° rotation of the
segment is inconsistent and that the nozzle is not reliably positioned on the nozzle seat.
In addition, this result can be related to the "Sensor value [mV]" for segment 7 (6). The lowest "Min
Value [mV]" for the entire measurement, which reflects the greatest distance between the Z-down light
barrier and the switching ring (brightest measurement) is around a rotary angle of approx. 75° (7) at
segment 7. This indicates that there may be a contamination with dust particles (white particles,
therefore a light measurement).
The highest measured "Max value [mV]" can be found at segment 2 (4). The diagram shows that the
value at segment 2 was reached roughly at an angle of approx. 210° (5). This is therefore the smallest
distance measured from the Z-down light barrier to the switching ring. Due to the dark measurement
performed for this area, there may well be damage to the switching ring.
Light-dark measurements (fluctuations in analog voltage value for Z-down light barrier) can also be
caused by an inconsistency (incorrectly fitted switching ring) of the switching ring.
At segment 20 (2), the "Radial runout 5°" measurement resulted in an impermissible nozzle length
increase within 5°. This may be due to a dirty nozzle.

SIPLACE Head Verification
User Manual Edition 01/2015
73
The highest value achieved for the "LED gain" was at segment 9 (3). This type of deviation could
indicate that the Z-down light barrier will fail in the near future.
The "Variation 360 [mV]" (8) value is calculated by finding the difference between the "Max value
[mV]" and the "Min value [mV]". In our case this is 4141mV – 3977mV = 164mV
4.13.4 Meaning of the Results
No figures based on experience available!
4.14 "Component Sensor Calibration" Measurement
The following tools are required for these measurements:
CP20P: 20x nozzle type 4235 03098748-01 (calibration nozzle)
4.14.1 Explanation of Measurement – Procedure
The "Component sensor calibration" measurement checks the degree to which the Z height of the
nozzle changes when the Z axis is moved downwards in axis overlapping mode, during the star
rotation and the component sensor is triggered. It checks, when the component sensor switches,
whether the front surface of the nozzle tip triggers the component sensor eccentrically during axis
overlapping. The corner of the front nozzle surface moves slightly downwards during a rotation around
the star in the lower angles (as in the case of jaw stop left and jaw stop right). This can also be
described as a diagonal tilting effect! This Z axis change is recorded during this measurement at the
component sensor.
The results of these measurements provide feedback about the following sources of errors:
1. Slanted component sensor fitting
Measurement steps:
1. Head reference run is performed
2. Segment 1 is rotated with the star into the placement position.
3. The driver bearing is now positioned in the center of the Z axis jaws.
4. The Z axis moves downwards until the jaws are in the center of the raceway cutout and the
component sensor switches.
5. Segment 1 is rotated slowly with the star in the direction of the left stop on the raceway.
6. Once the left stop position is reached, the Z axis begins to step downwards until the corner of
the nozzle front surface triggers the component sensor.
7. The star is now stepped from the left to the right jaw stop.
8. The Z axis is moved in steps until the component sensor is triggered by the front surface of
the nozzle.
9. When the center of the jaws is reached, the smallest value i.e. 0 should be reached.
10. The distance between the lowest Z axis setting (driver in jaw at left or right) and the highest Z
axis setting (driver in center of jaws = 0) at component sensor triggering provides the
Calibration value.