TM2939.Solder Remaining Quantity Detection-Function.pdf - 第14页
SMT Software En gineering G roup IM Operati ons Y AMAHA MOTOR CO., L TD. MDOC-SOFT50 128 14 /18 Fig.4.10 [ MIS] - [ Board Lo g] screen 4.3.2. Solder transition graph Transition of the r olling w idth per b oard is di spl…
SMT Software Engineering Group
IM Operations YAMAHA MOTOR CO., LTD.
MDOC-SOFT50128
13/18
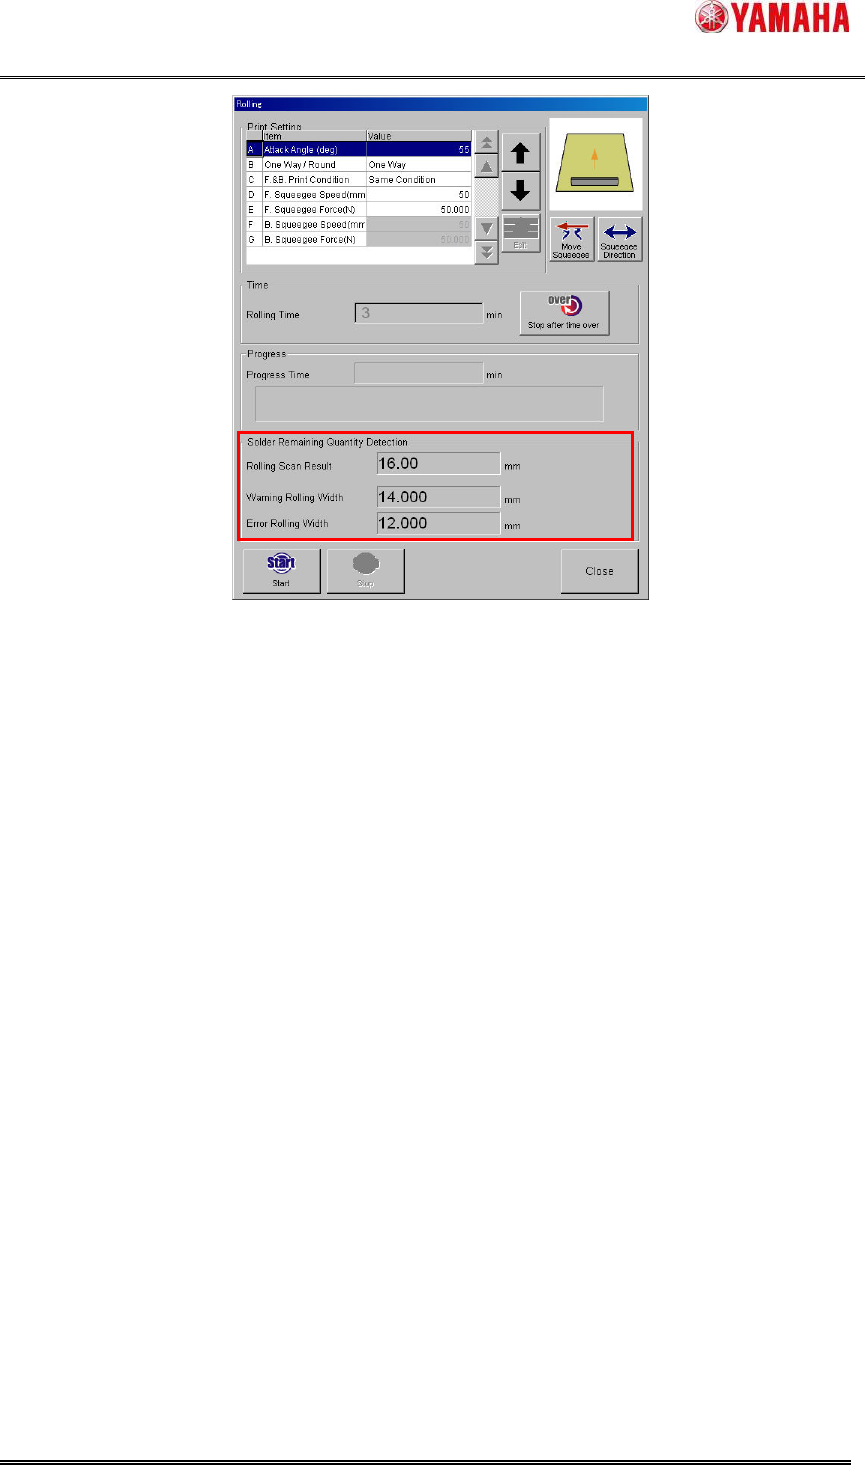
Fig.4.9 “Rolling” dialog box
4.2.3. Test print
During the test print, the solder rolling width on the mask is scanned only after backward
printing. When the rolling width is scanned correctly, the result is displayed in the ”Ea8985:
Succeeded in Scanning” message (Fig.4.8). After that “Ea8645: Do you wish to carry out the
fixed Board?” is displayed. Even if scan result is smaller than “Warning Rolling Width” or “Error
Rolling Width”, neither warnings nor errors are counted. However, “Refilling Solder Board”
counter is counted down.
4.3. Result log function
The rolling width scan result is output to history and graph.
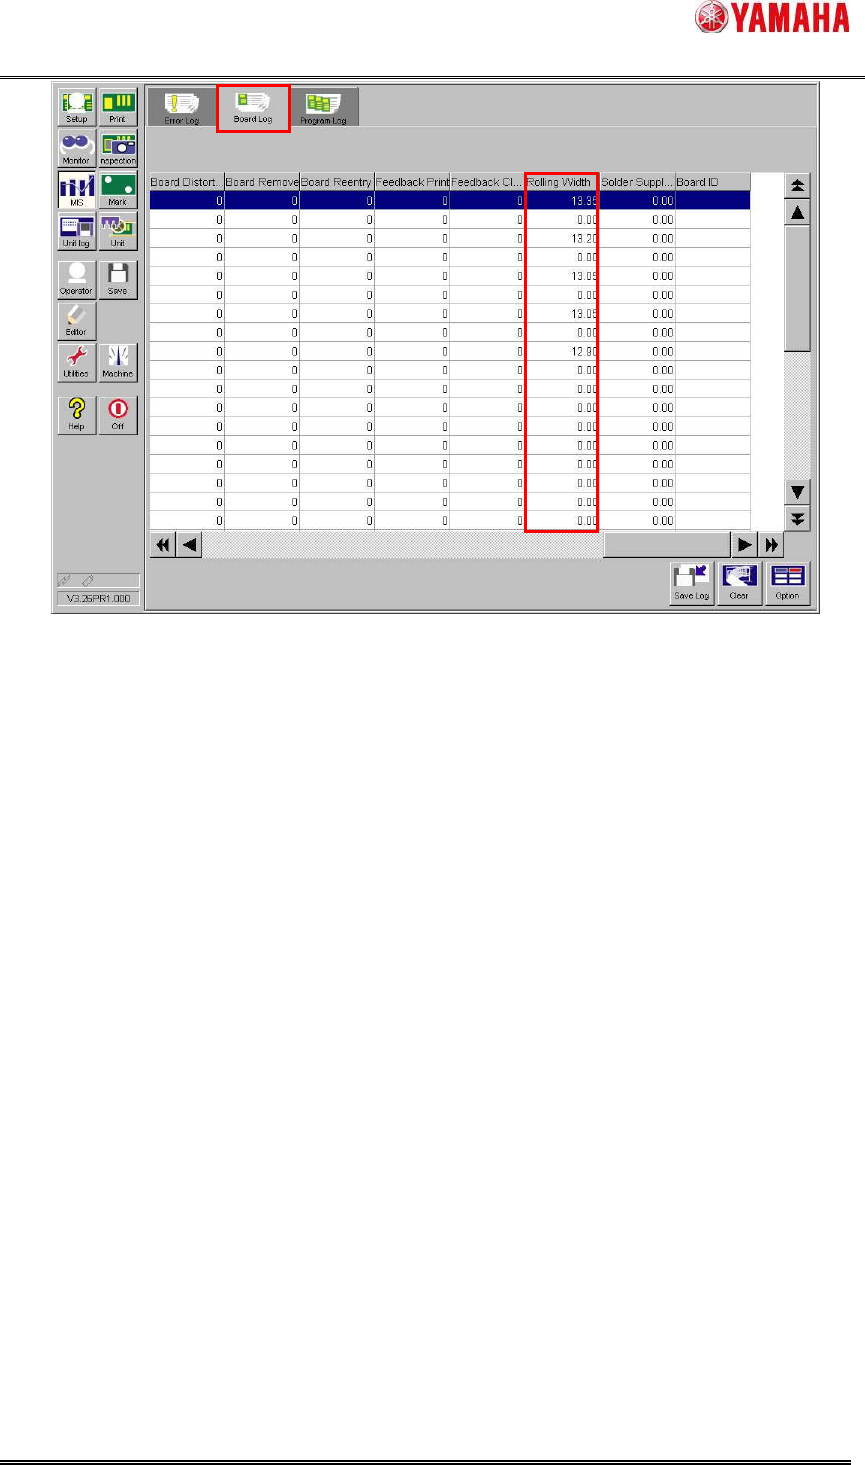
4.3.1. Board log
The rolling width scan result is output to [MIS] – [Board Log] – [Rolling Width] column per
board. If board log is saved to CSV file, it is useful for result analysis in offline software.
SMT Software Engineering Group
IM Operations YAMAHA MOTOR CO., LTD.
MDOC-SOFT50128
14/18
Fig.4.10 [MIS] - [Board Log] screen
4.3.2. Solder transition graph
Transition of the rolling width per board is displayed visually in [Monitor] – [Solder transition].
The horizontal axis is the number of produced board and the vertical axis is the rolling width. The
blue line shows rolling width scan result, the red line shows the ”Error Rolling Width” of board
data, and the green line shows the ”Warning Rolling Width” of the board data.
When solder is supplied (“Yes” button is tapped in “Ea8988:Supply Solder” message), the
“Supply” flag is indicated on the graph to check solder supply timings at a glance.

SMT Software Engineering Group
IM Operations YAMAHA MOTOR CO., LTD.
MDOC-SOFT50128
15/18
Fig.4.11 [Monitor] - [Solder Transition] screen
4.3.3. Inspection result analysis graph
Since the solder fill amount may vary as the solder is supplied, this change may affect the
inspection result. To make it easy to determine whether the effect depends on solder supply, the
“Supply” flag is indicated on the transition graph of the inspection result analysis to check the
solder supply timings at a glance.
Fig.4.12 [Monitor] - [Analysis] - [Transition] screen
“Supply” flag
“Supply” flag