E4416A_E4417A EPM-P Series Power Meters and E-Series E9320 Peak and Average Power Sensors.pdf - 第12页
Find us at www.keys ight.com Page 12 Figure 3. Typic al SWR for t he E9323A and E9327A sensors at various power levels. Sensor Linearity Table 6a. Pow er sensor linea rity, norm al mode (upper a nd lower range). Sensor m…
Find us at www.keysight.com Page 11
Table 5. Power sensor maximum SWR.
Sensor model Maximum SWR (≦ 0 dBm)
E9321A, E9325A
50 MHz to 2 GHz
1.12
>2 GHz to 10 GHz
1.16
>10 GHz to 16 GHz
1.23
>16 GHz to 18 GHz
1.28
E9322A, E9326A
50 MHz to 2 GHz
1.12
>2 GHz to 12 GHz
1.18
>12 GHz to 16 GHz
1.21
>16 GHz to 18 GHz
1.27
E9323A, E9327A
50 MHz to 2 GHz
1.14
>2 GHz to 16 GHz
1.22
>16 GHz to 18 GHz
1.26
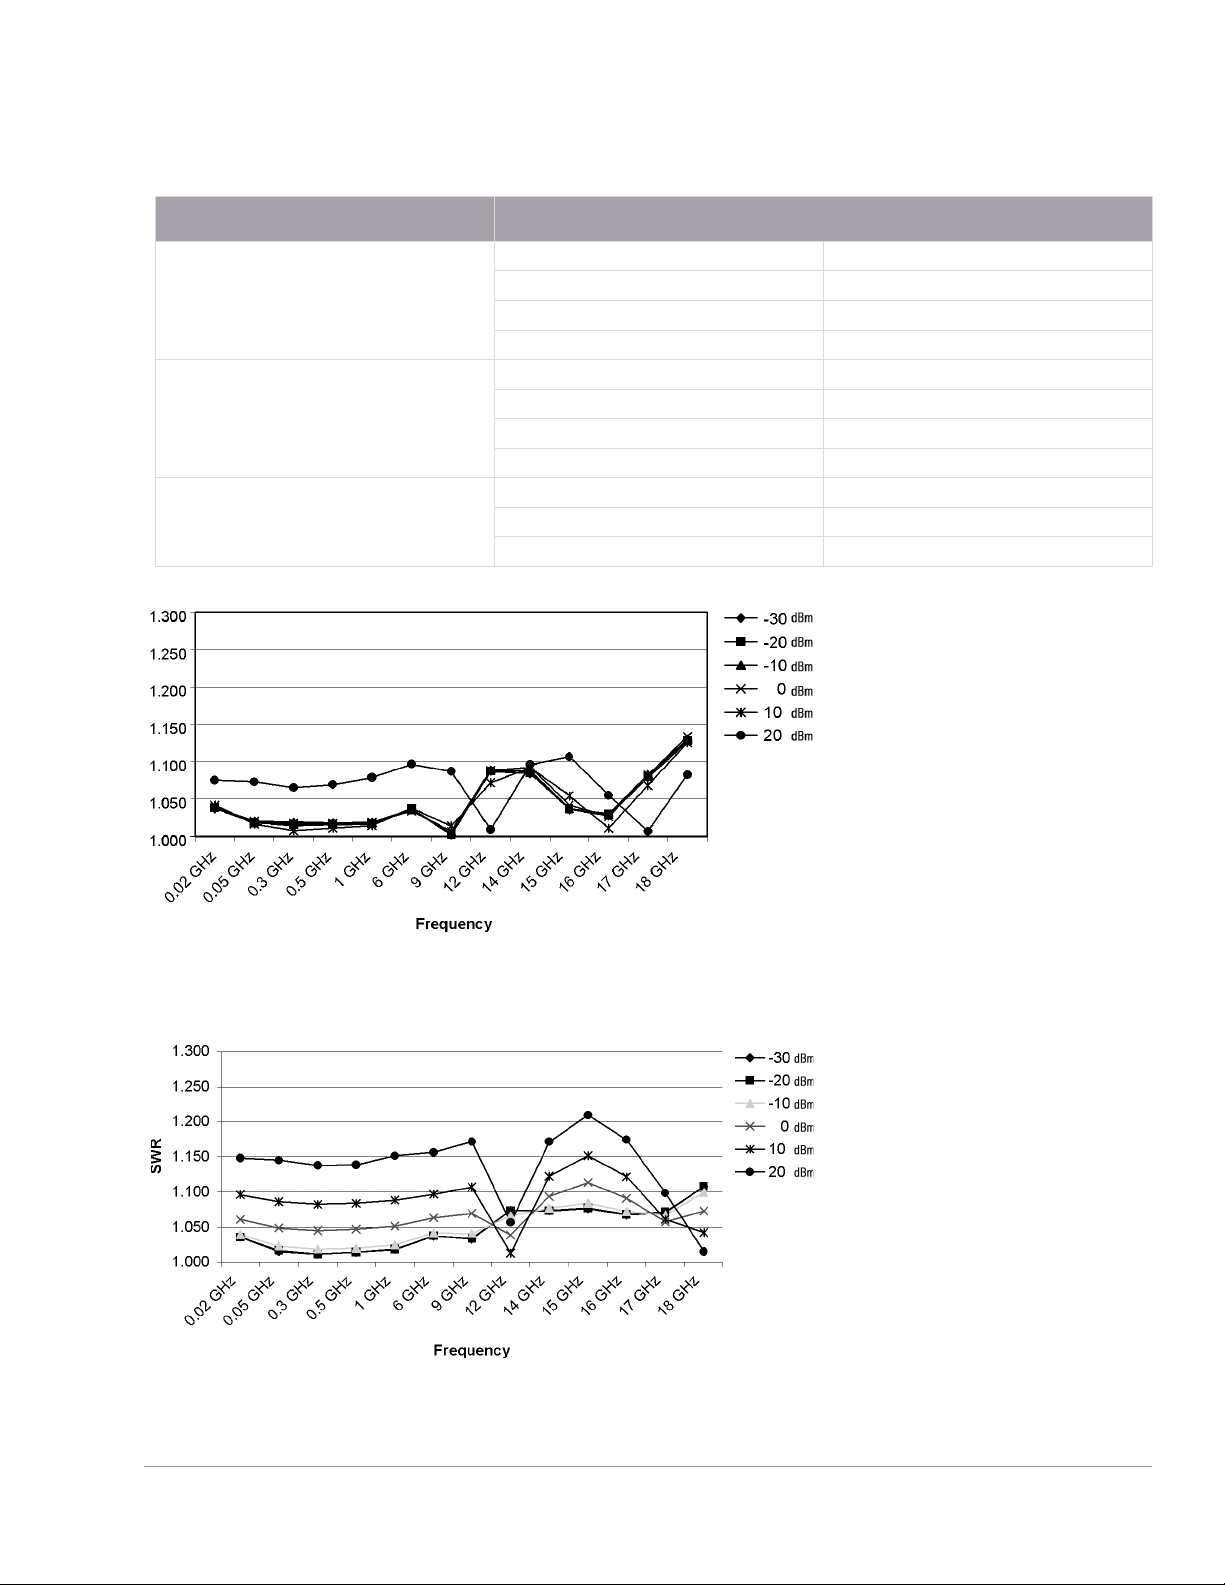
Figure 1. Typical SWR for the E9321A and E9325A sensors at various power levels.
Figure 2. Typical SWR for the E9322A and E9326A sensors at various power levels.
Find us at www.keysight.com Page 12
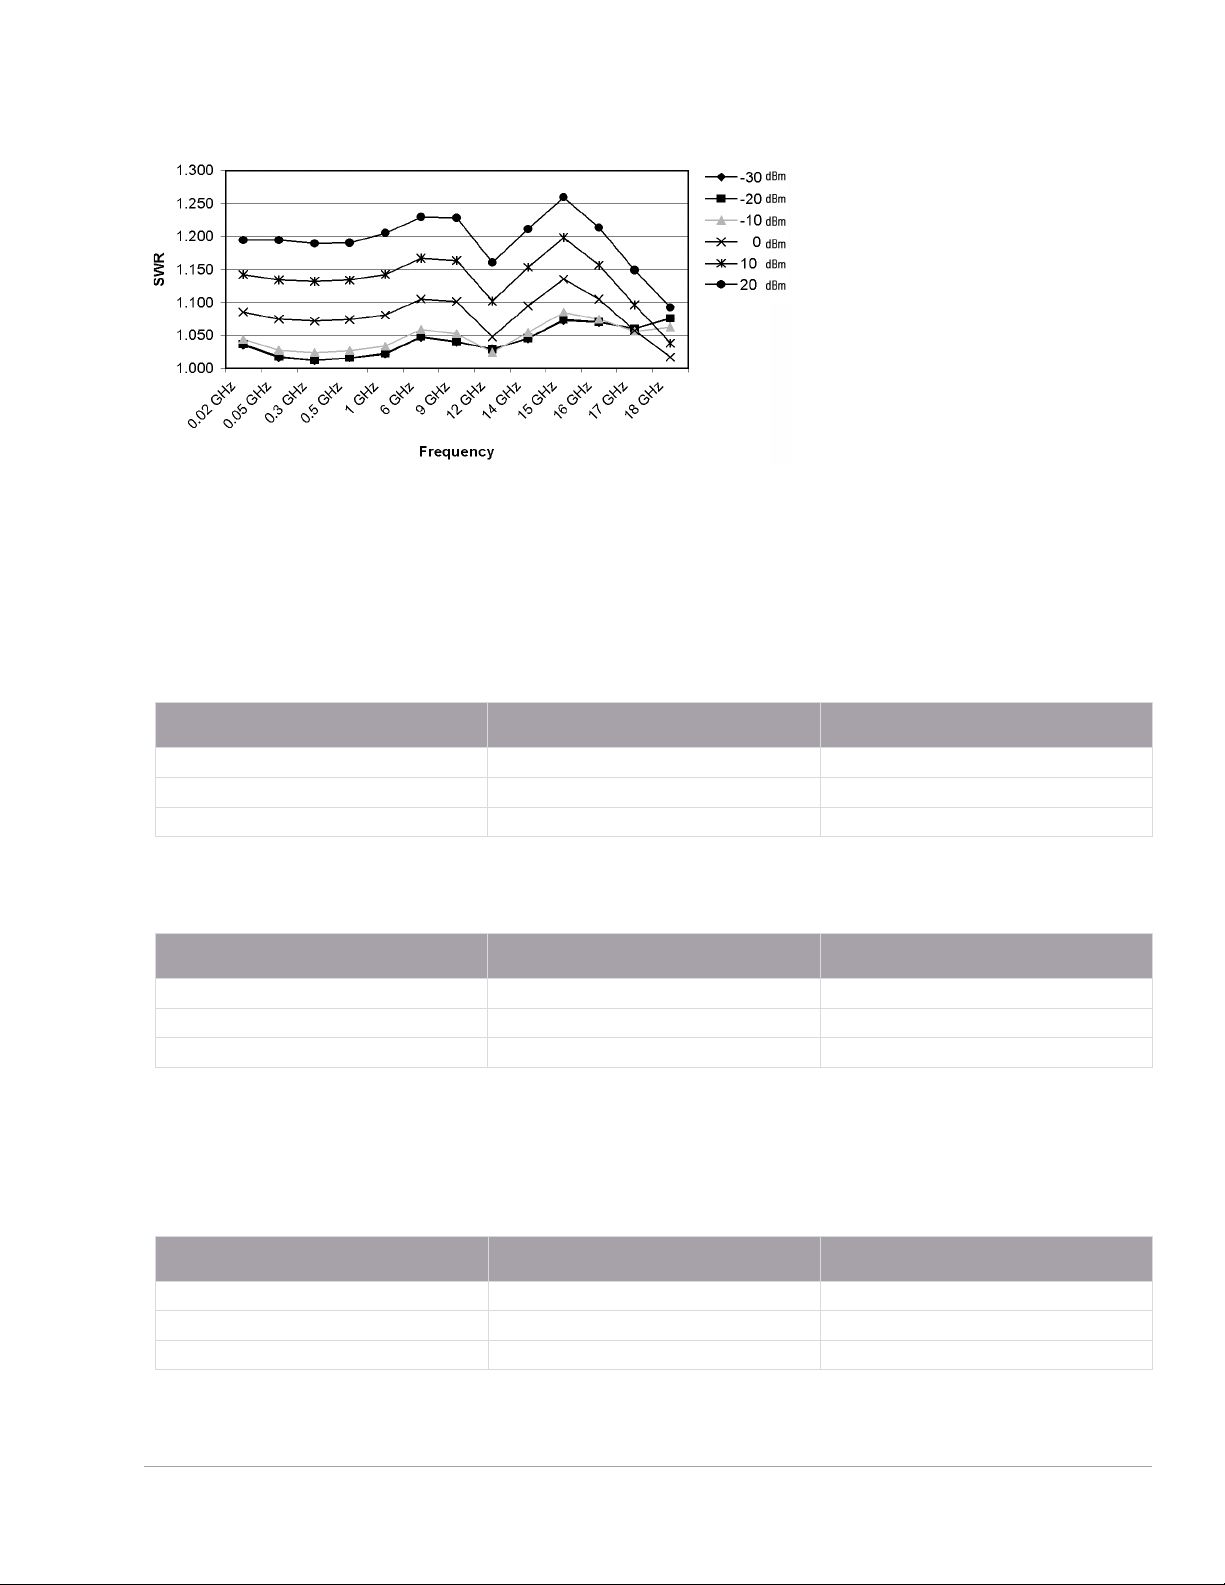
Figure 3. Typical SWR for the E9323A and E9327A sensors at various power levels.
Sensor Linearity
Table 6a. Power sensor linearity, normal mode (upper and lower range).
Sensor model Temperature (25 ± 10 °C) Temperature (0 to 55 °C)
E9321A and E9325A
± 4.2%
± 5.0%
E9322A and E9326A
± 4.2%
± 5.0%
E9323A and E9327A
± 4.2%
± 5.0%
Table 6b. Power sensor linearity, average only mode (upper and lower range).
Sensor model Temperature (25 ± 10 °C) Temperature (0 to 55 °C)
E9321A and E9325A
± 3.7%
± 4.5%
E9322A and E9326A
± 3.7%
± 4.5%
E9323A and E9327A
± 3.7%
± 5.0 %
If the sensor temperature changes after calibration, and the meter and sensor is not re-calibrated, then
the following additional linearity errors should be added to the linearity figures in Tables 6a and 6b.
Table 6c. Additional linearity error (normal and average only modes).
Sensor model Temperature (25 ± 10 °C) Temperature (0 to 55 °C)
E9321A and E9325A
± 1.0%
± 1.0%
E9322A and E9326A
± 1.0%
± 1.0%
E9323A and E9327A
± 1.0%
± 1.0%
Find us at www.keysight.com Page 13
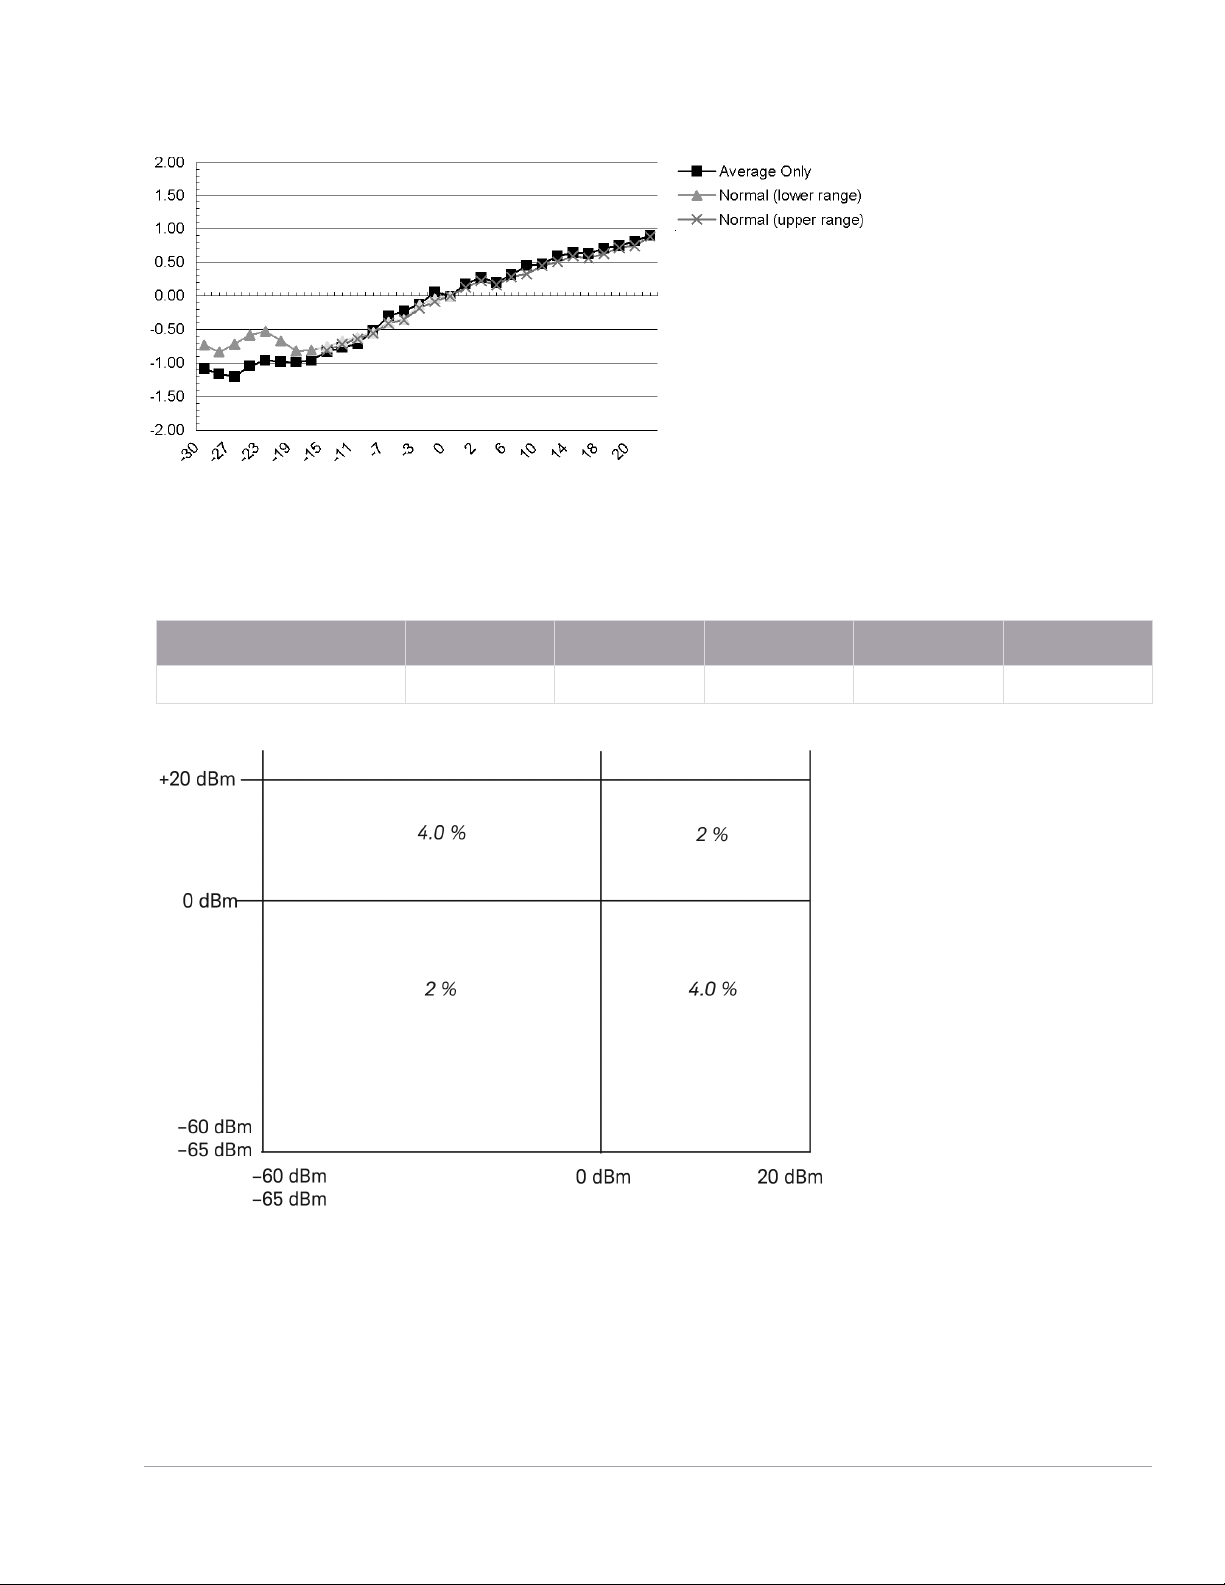
Figure 4. Typical power linearity at 25 °C for the E9323A and E9327A 5 MHz bandwidth sensors, after zero and
calibration, with associated measurement uncertainty.
Power range –30 to –20 dBm –20 to –10 dBm –10 to 0 dBm 0 to +10 dBm +10 to +20 dBm
Measurement uncertainty
0.9%
0.8%
0.65%
0.55%
0.45%
Figure 5. Relative mode power measurement linearity with an EPM-P series power meter, at 25 °C (typical).
Figure 5 shows the typical uncertainty in making a relative power measurement, using the same power
meter channel and the same power sensor to obtain the reference and the measured values. It also
assumes that negligible change in frequency and mismatch error occurs when transitioning from the
power level used as the reference to the power level measured.