E4416A_E4417A EPM-P Series Power Meters and E-Series E9320 Peak and Average Power Sensors.pdf - 第15页
Find us at www.keys ight.com Page 15 Figure 8. E932 3A and E9327 A error in peak - to - average measur ements for a t wo - tone input (high, medium , low and off filters). Calibration Factor (CF) and Reflection Coefficie…
Find us at www.keysight.com Page 14
Peak Flatness
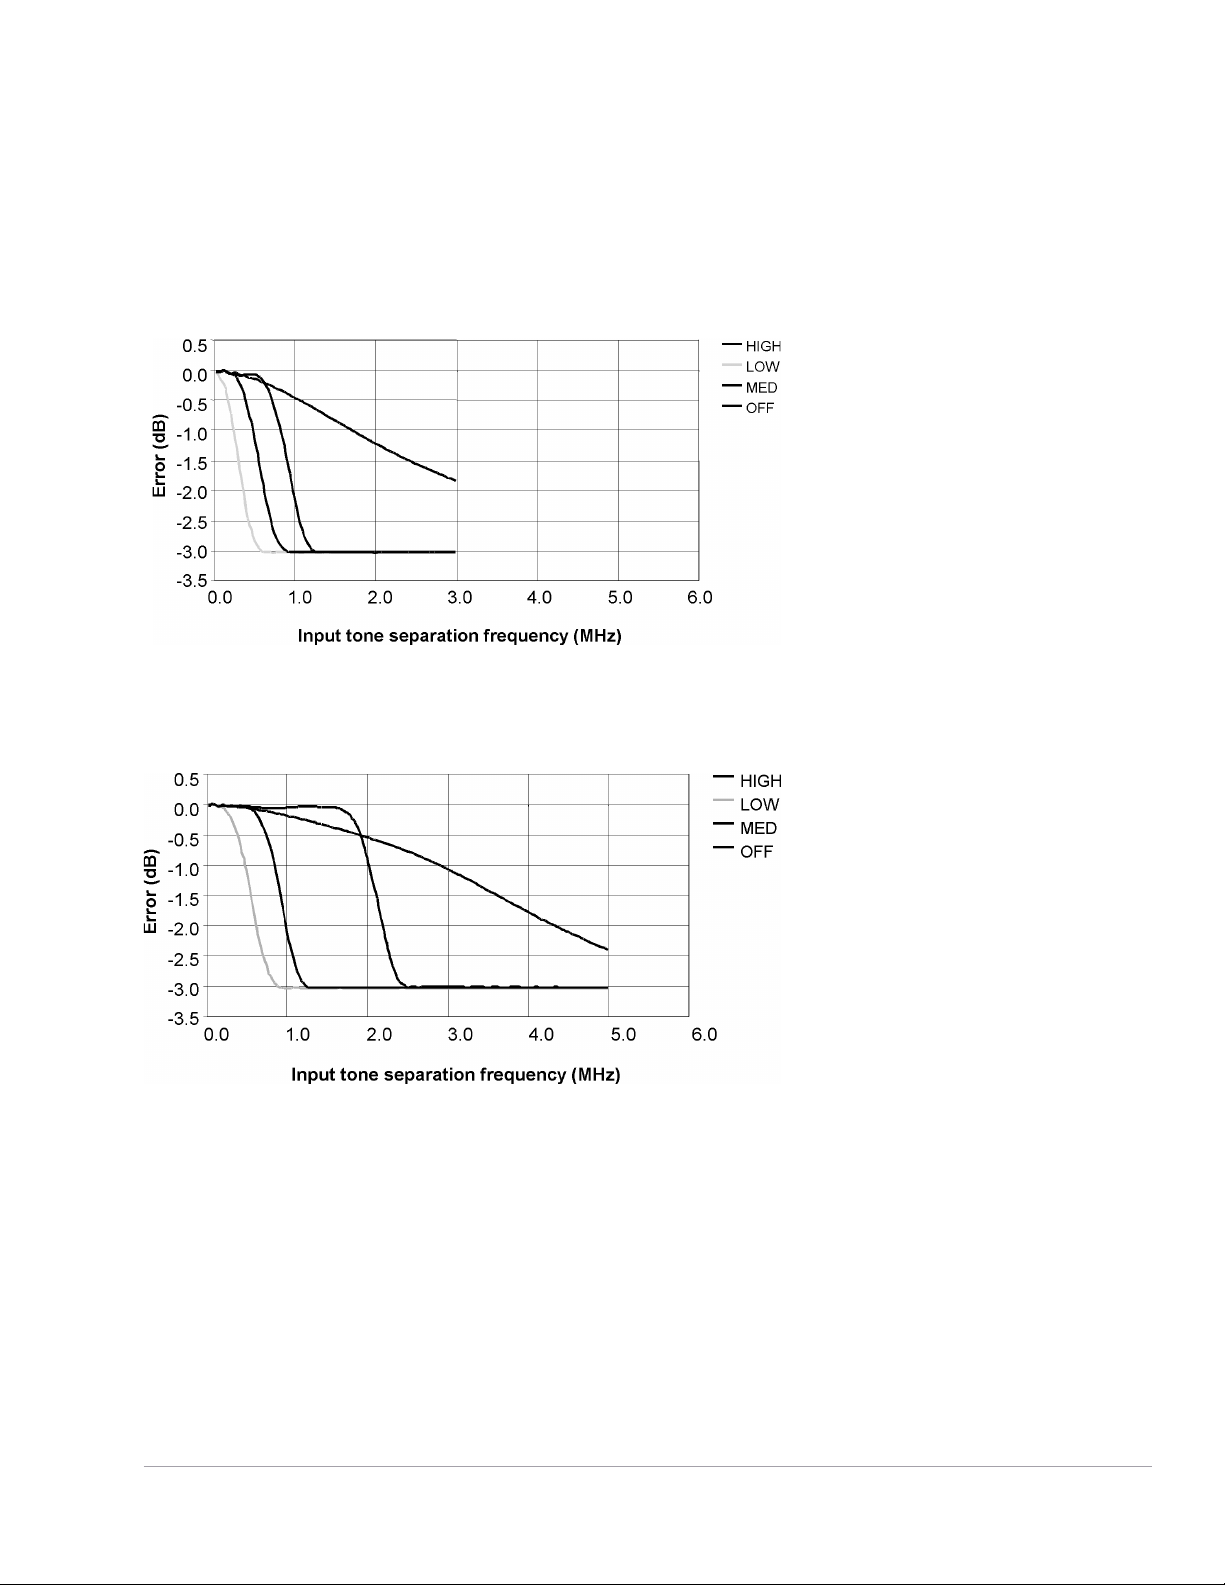
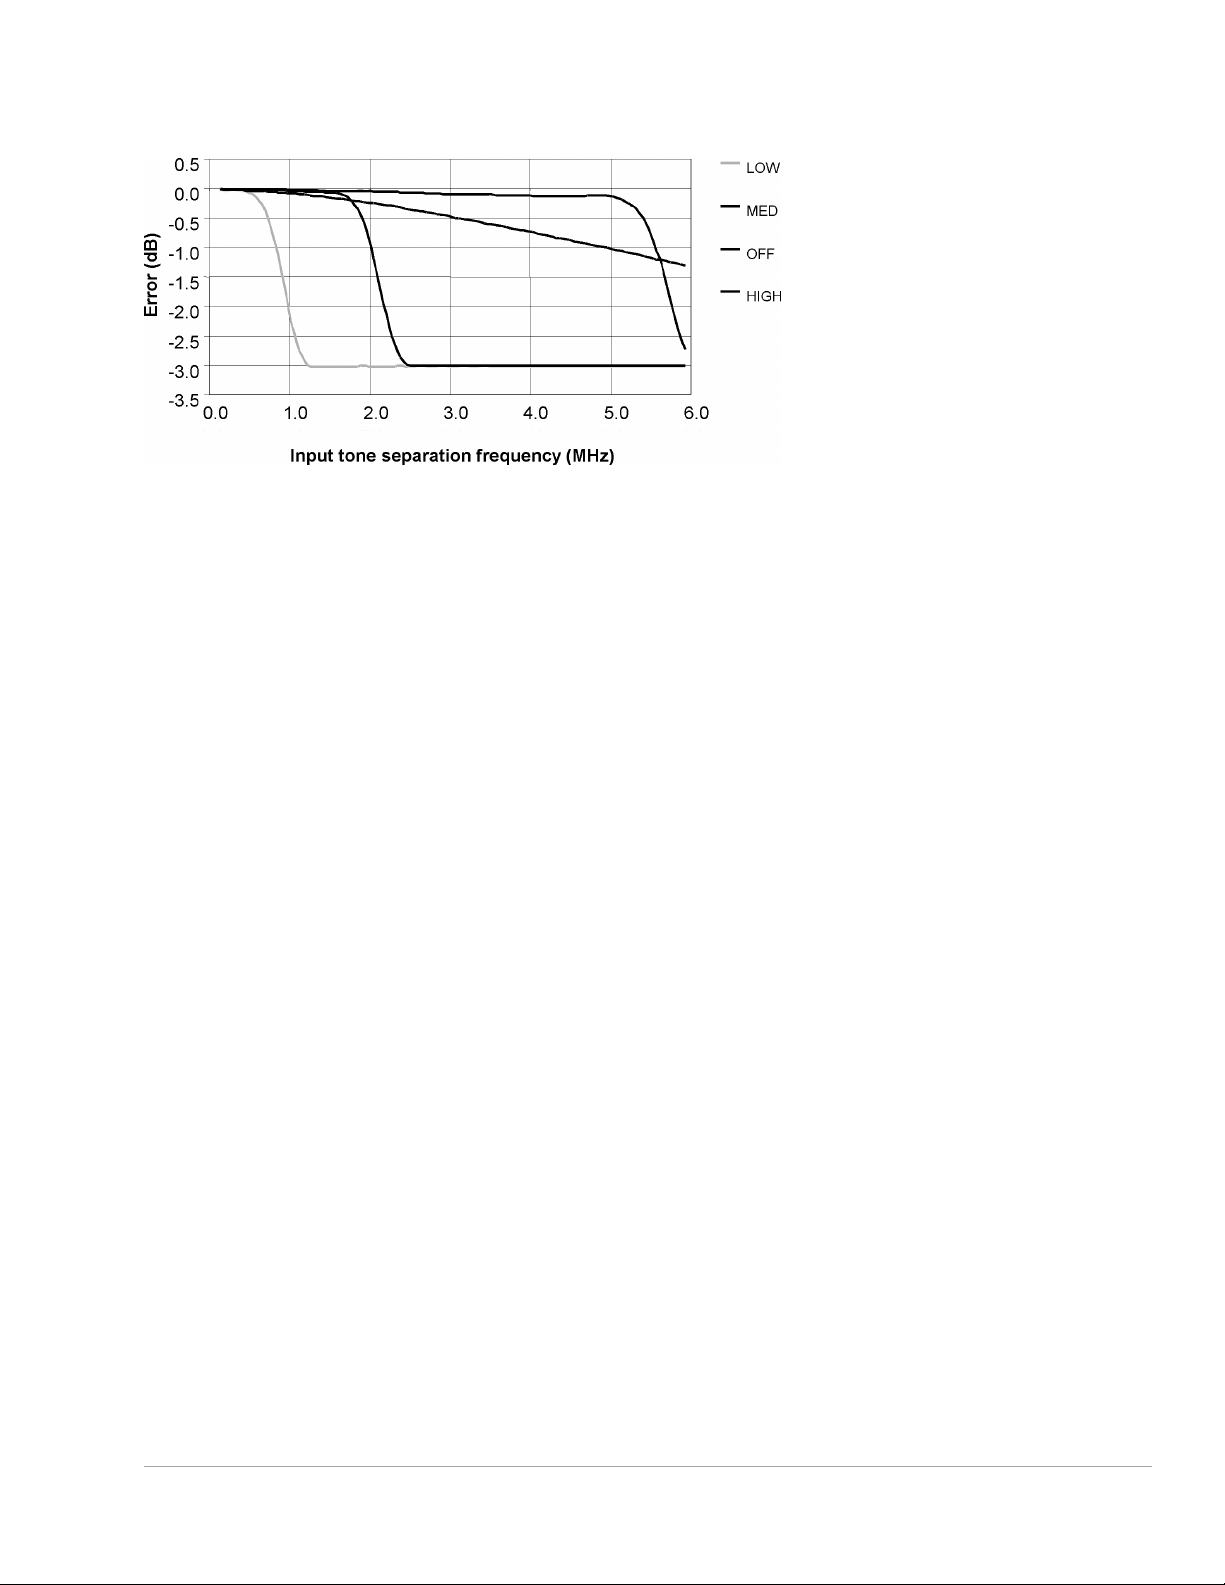
The peak flatness is the flatness of a peak-to-average ratio measurement for various tone- separations
for an equal magnitude two-tone RF input. Figures 6, 7 and 8 refer to the relative error in peak-to-
average measurement as the tone separation is varied. The measurements were performed at –10 dBm
average power using an E9288A sensor cable (1.5 m).
Figure 6. E9321A and E9325A Error in peak-to-average measurements for a two-tone input (high, medium, low and
off filters).
Figure 7. E9322A and E9326A error in peak-to-average measurements for a two-tone input (high, medium, low and
off filters).
Find us at www.keysight.com Page 15
Figure 8. E9323A and E9327A error in peak-to-average measurements for a two-tone input (high, medium, low and
off filters).
Calibration Factor (CF) and Reflection Coefficient (Rho)
Calibration Factor and Reflection Coefficient data are provided at frequency intervals on a data sheet
included with the power sensor. This data is unique to each sensor. If you have more than one sensor,
match the serial number on the data sheet with the serial number of the power sensor you are using.
The CF corrects for the frequency response of the sensor. The EPM-P series power meter automatically
reads the CF data stored in the sensor and uses it to make corrections.
For power levels greater than 0 dBm, add to the calibration factor uncertainty specification:
•
± 0.1%/dB (for E9321A and E9325A sensors),
•
± 0.15%/dB (for E9322A and E9326A sensors) and
•
± 0.2%/dB (for E9323A and E9327A sensors)
Reflection Coefficient (Rho) relates to the SWR according to the formula:
•
SWR = (1 + Rho)/(1 – Rho)
Maximum relative uncertainties of the CF data are listed in Table 7. The uncertainty analysis for the
calibration of the sensors was done in accordance with the ISO Guide. The uncertainty data, reported
on the calibration certificate, is the expanded uncertainty with a 95% confidence level and a coverage
factor of 2.

Find us at www.keysight.com Page 16
Table 7. Calibration factor relative uncertainty at 0.1 mW (–10 dBm).
Frequency Uncertainty (%) (25 ± 10 °C)
1
Uncertainty (%) (0 to 55 °C)
1
50 MHz
Reference
Reference
100 MHz
1.8
2.0
300 MHz
1.8
2.0
500 MHz
1.8
2.0
800 MHz
1.8
2.0
1.0 GHz
2.1
2.3
1.2 GHz
2.1
2.3
1.5 GHz
2.1
2.3
2.0 GHz
2.1
2.3
3.0 GHz
2.1
2.3
4.0 GHz
2.1
2.3
5.0 GHz
2.1
2.3
6.0 GHz
2.1
2.3
7.0 GHz
2.3
2.5
8.0 GHz
2.3
2.5
9.0 GHz
2.3
2.5
10.0 GHz
2.3
2.5
11.0 GHz
2.3
2.5
12.0 GHz
2.3
2.5
12.4 GHz
2.3
2.5
13.0 GHz
2.3
2.5
14.0 GHz
2.5
2.8
15.0 GHz
2.5
2.8
16.0 GHz
2.5
2.8
17.0 GHz
2.5
2.8
18.0 GHz
2.5
2.8
1
The characterized calibration factor should not deviate between periodic calibrations by more than the specified maximum uncertainty in the table.
Compliance is confirmed by the relative deviation (
|
1
−
2
|
1
∗ 100) being less than or equal to √2 times the specified maximum uncertainty. √2∗
with a reference calibration factor of 100%.