DEK高级培训资料.pdf - 第229页
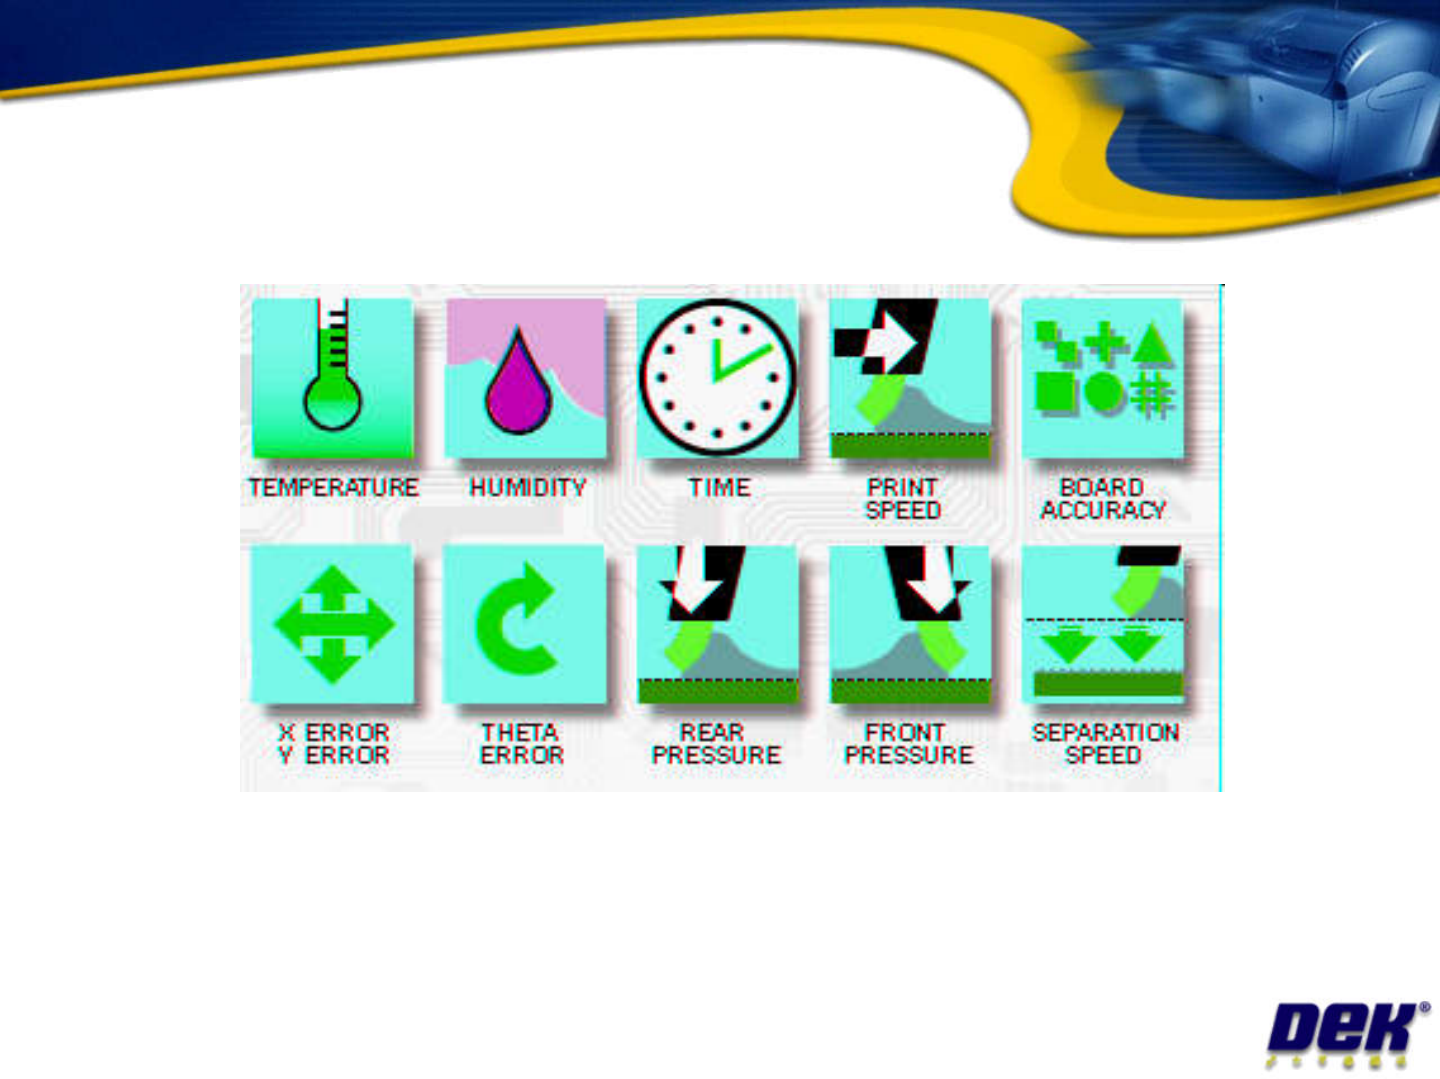
Statistical Process Control Issue 2: July 2007 • Edit outputs in product file • Edit limits in product file
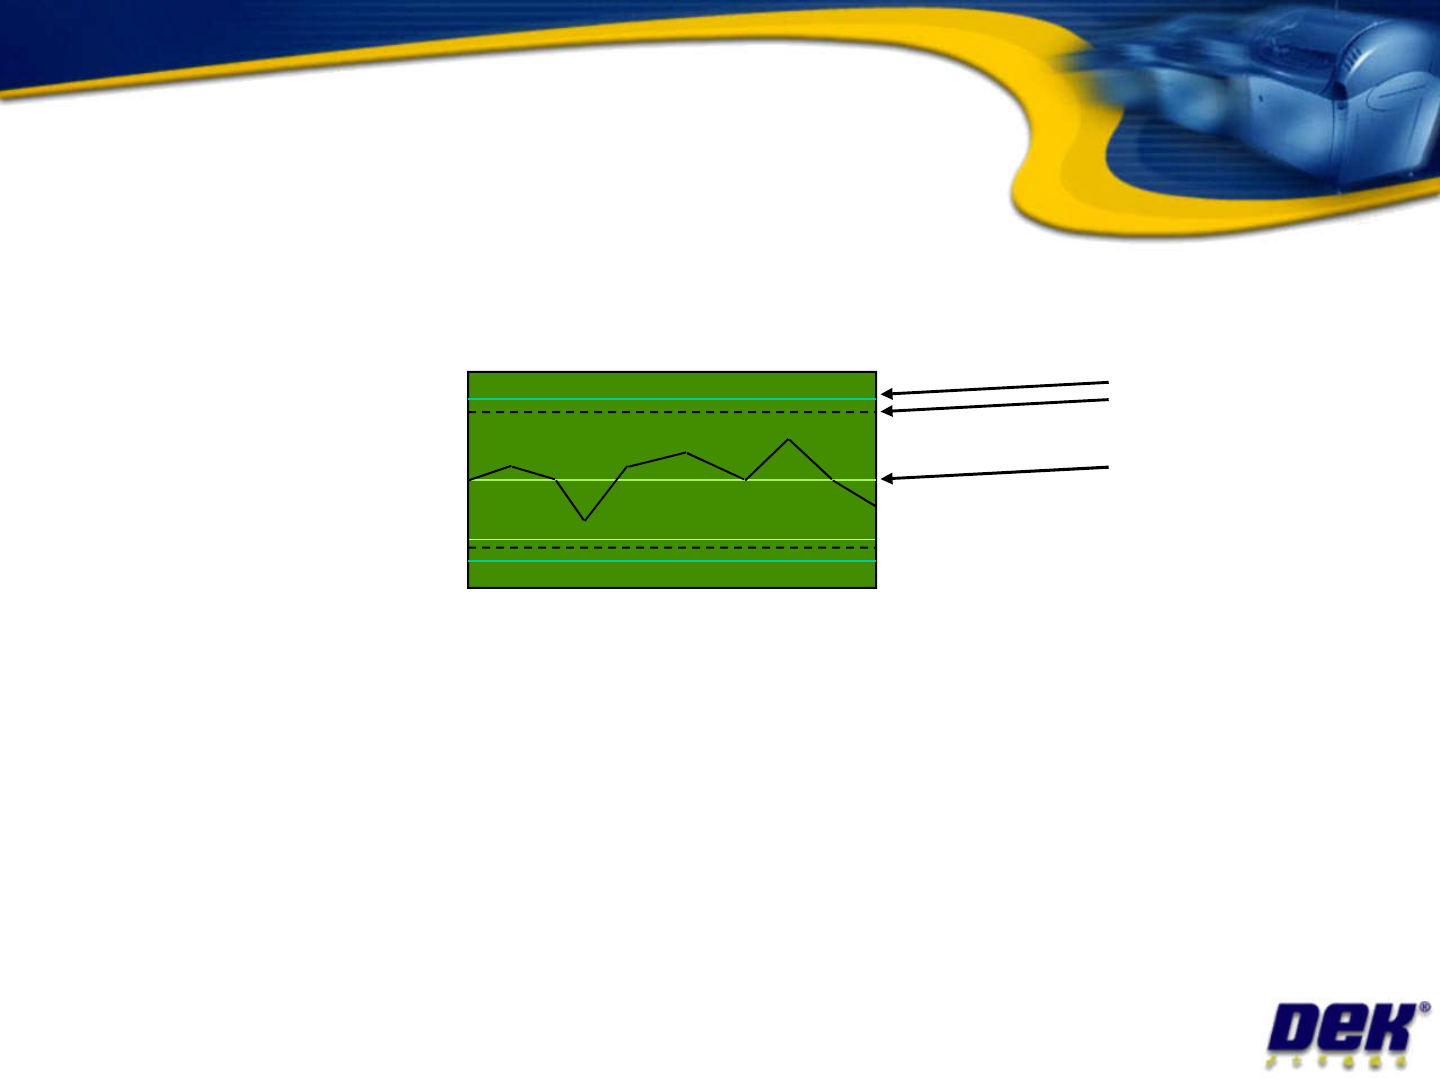
Name the arrowed parts of the real time plot shown below?
Quick quiz 2
Issue 2: July 2007
The real time graphs turn to red whenever the data exceeds the
control limit? True or false?
If control limits and tolerances are created by the user and it is not
required that the dek printer overwrites them, how is this achieved?
Statistical Process Control
Issue 2: July 2007
•
Edit outputs in product file
•
Edit limits in product file
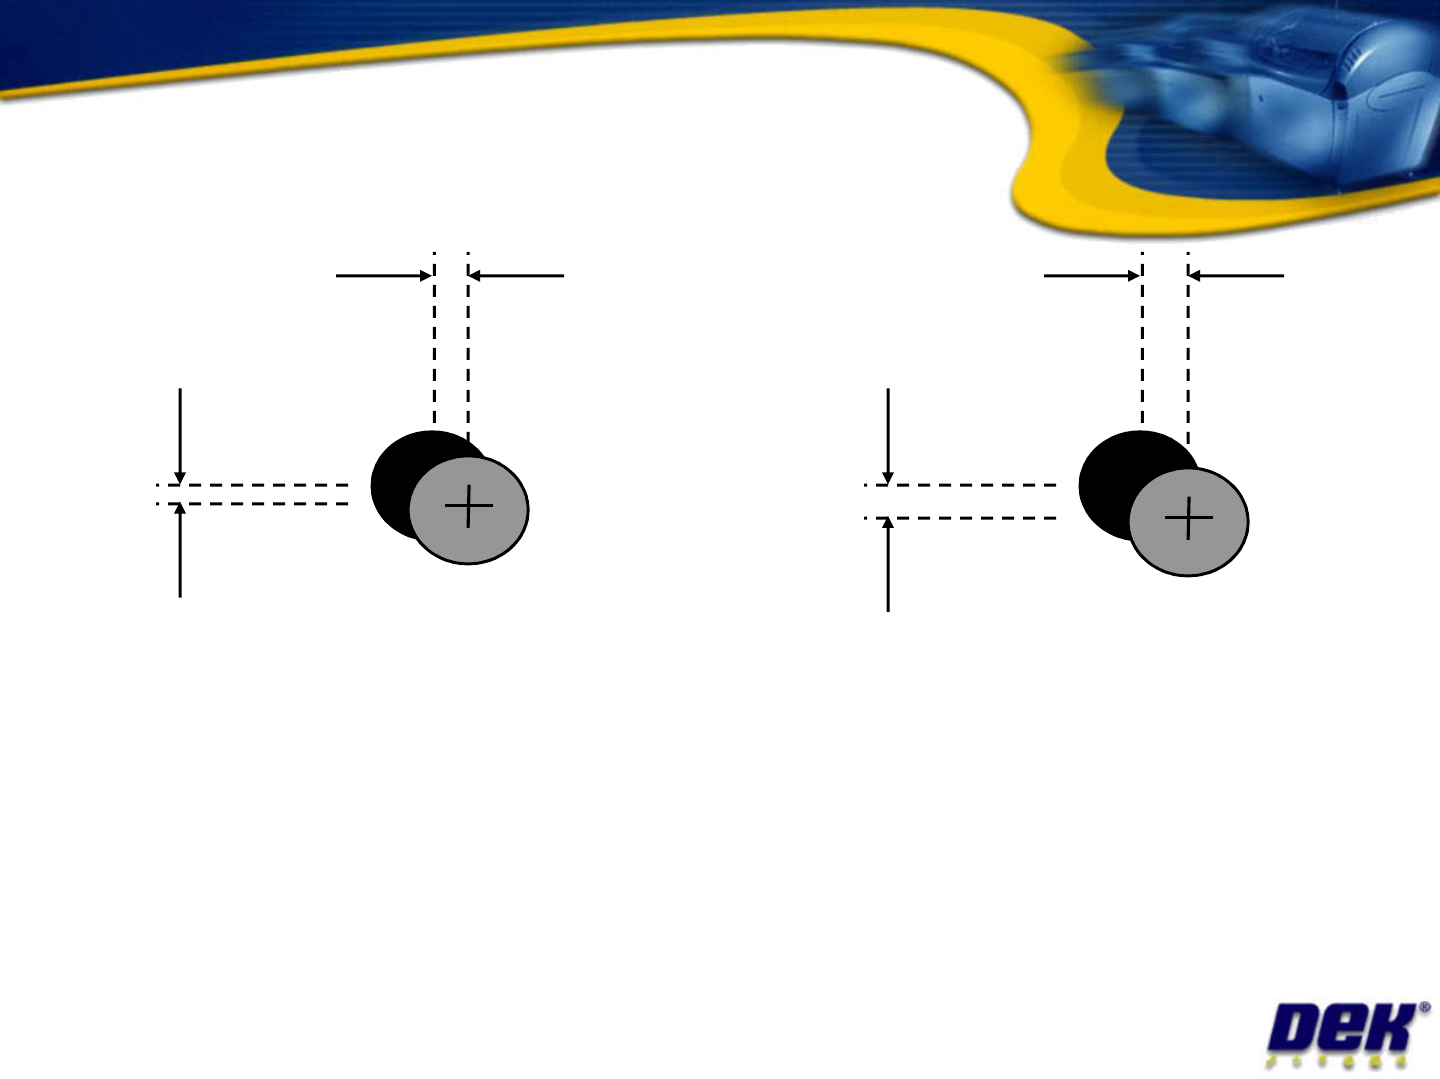
X ALIGN ERROR X ALIGN ERROR
Data alignment error
Issue 2: July 2007
Y ALIGN ERROR Y ALIGN ERROR
FIDUCIAL 1 FIDUCIAL 2
Note: This information for spc is output just before the
print stroke but after the alignment process, and/or just
after the print stroke.