OperatorManual.pdf - 第41页
The two butto ns on the bottom of t he display have the following functions: z Record/Stop - This button directs the profiler to start or stop collecting data. A plot of the active profile thermocouple temperatur e readi…
Oven profiling
Use the profiler(s)
From software version 07.00 on, the XPM software has built-in support to connect to 3-rd party software
packages.
Currently, the thermal profiling software of ECD and KIC have a communication compatibility with the XPM
software. Thermal profiling software in general gives you a powerful tool to setup and optimize your product
profiles. Both the KIC and ECD products can also predict product profiles using their profilers. With the XPM
communication compatiblity the predicted product profile will automatically be changed in the oven .
Go to the main menu and select
[Profile]
.
A submenu will appear with the following choices:
Use theVitronics-Soltec profiler This is the built-in XPM profiler
Use the ECD profiler
Use the KIC profiler
PROFILING OPTIONS - KIC, ECD, & VITRONICS-SOLTEC PROGRAM
The Vitronics Soltec Oven Control Program ver 7.0 is delivered with the software necessary to operate three
different Profiling methods within the Program.
Those methods are:
1: Vitronics Soltec Program Profiler
2: ECD (Electronic Controls Design M.O.L.E.® )
3: KIC (KIC 2000 Thermal Profler ® )
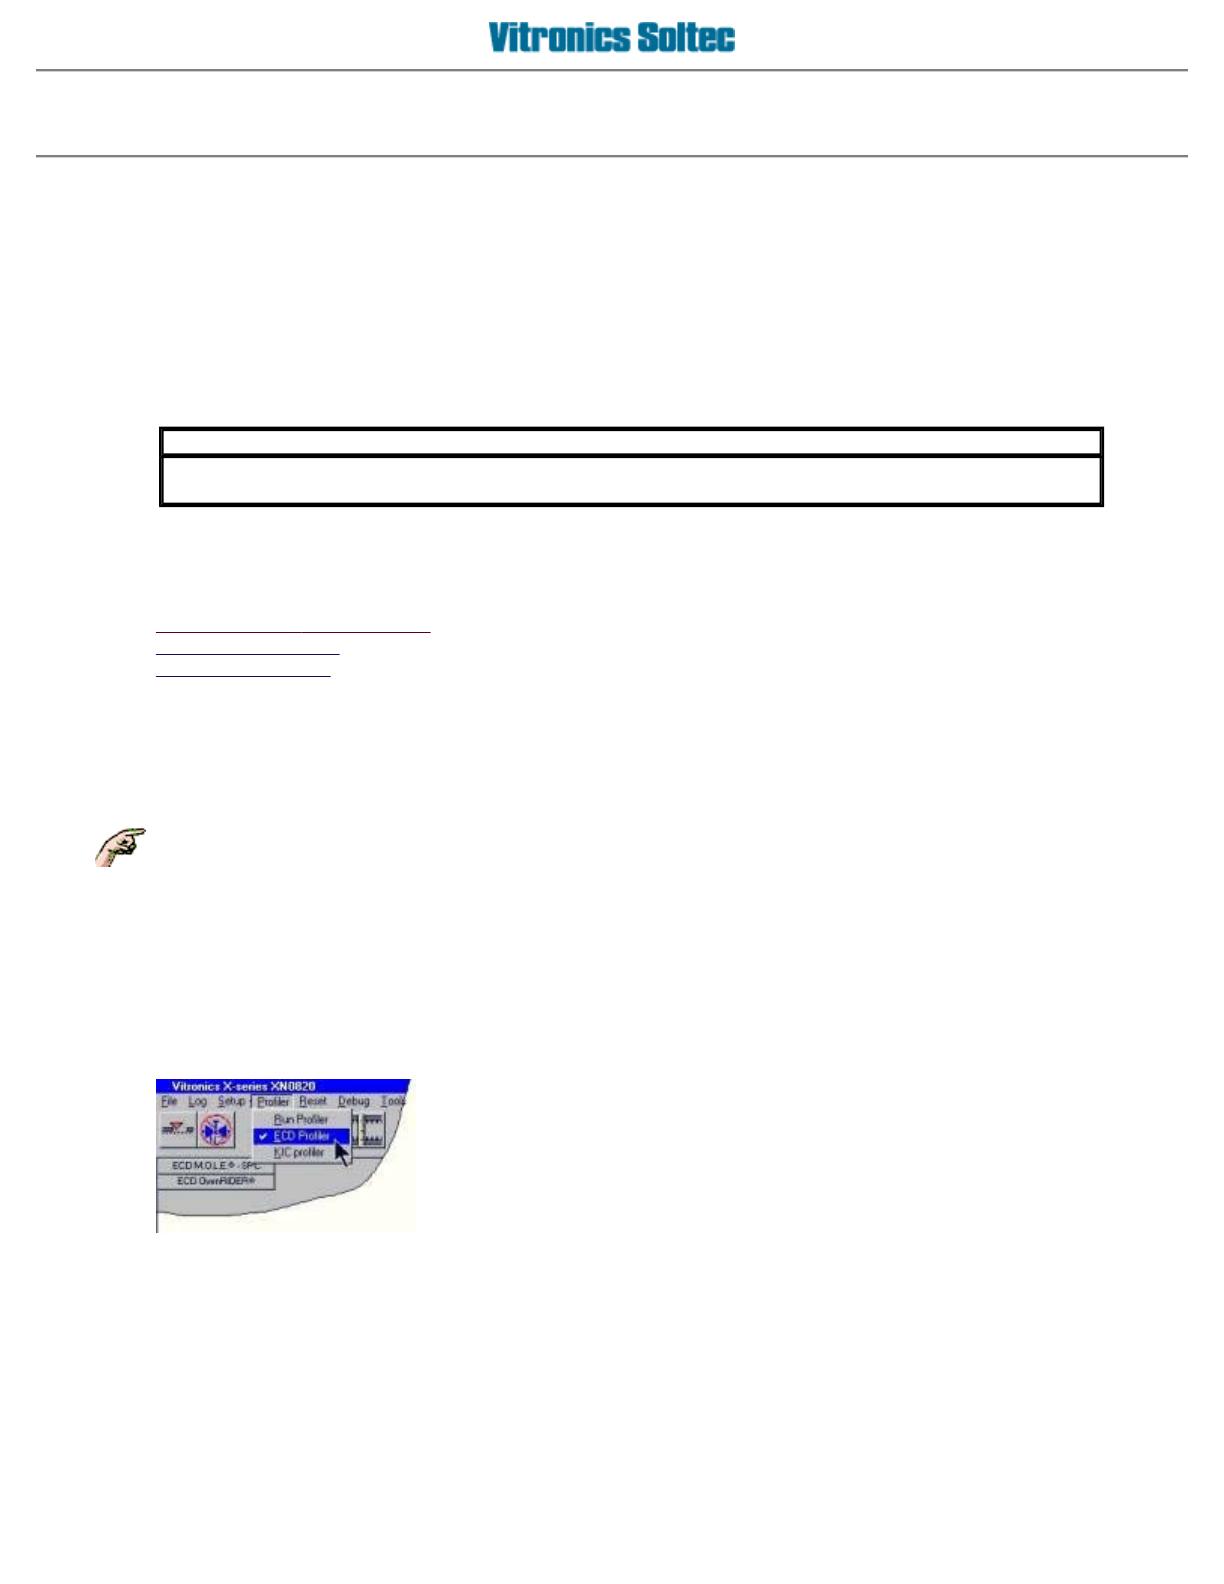
Select
PROFILER
from the Pull-down Menu,
IMPORTANT
The provided software of ECD and KIC have only limited functionallity without their profiling hardware
available.
Each method requires specific hardware NOT supplied with the Vitronics Soltec oven.
And choose a profiler to run the
VITRONICS SOLTEC
,
ECD or KIC Profiler
Operator manual 39 August 2003
Vitronics Soltec profiler
Use the Vitronics Soltec profiler
Go to the main menu and select
[Profile][Vitronics-Soltec Profiler]
.
z
File
{
Open File
- Retrieves and displays previously
saved profiles.
{
Save
- Saves a profile that was created to a file.
{
Print
- Prints a profile with the following options
Print plot and slope data
Print plot data
Print slope data table
{
Exit
- Exit the profiler program
z
View
{
View slope graph
- Displays the calculated slopes
per oven zone
{
View plot data
- Displays a list of temperature
readings derived from the profile thermocouples
z
Tools
{
Settings
- Displays a tabbed window with the
following functions
Band - an overview of the layout of the oven
Graph parameters - changes the
appearence of the graph, like displaying a
grid etc.
Tip: Increase the major tick setting of an
axis if the axis data headings overlap or
appear crowded on the axis display.
Change the major tick setting on the X-axis
from 20 to 50 ticks when running slow
conveyor speeds (under 12IPM) with long
oven models.
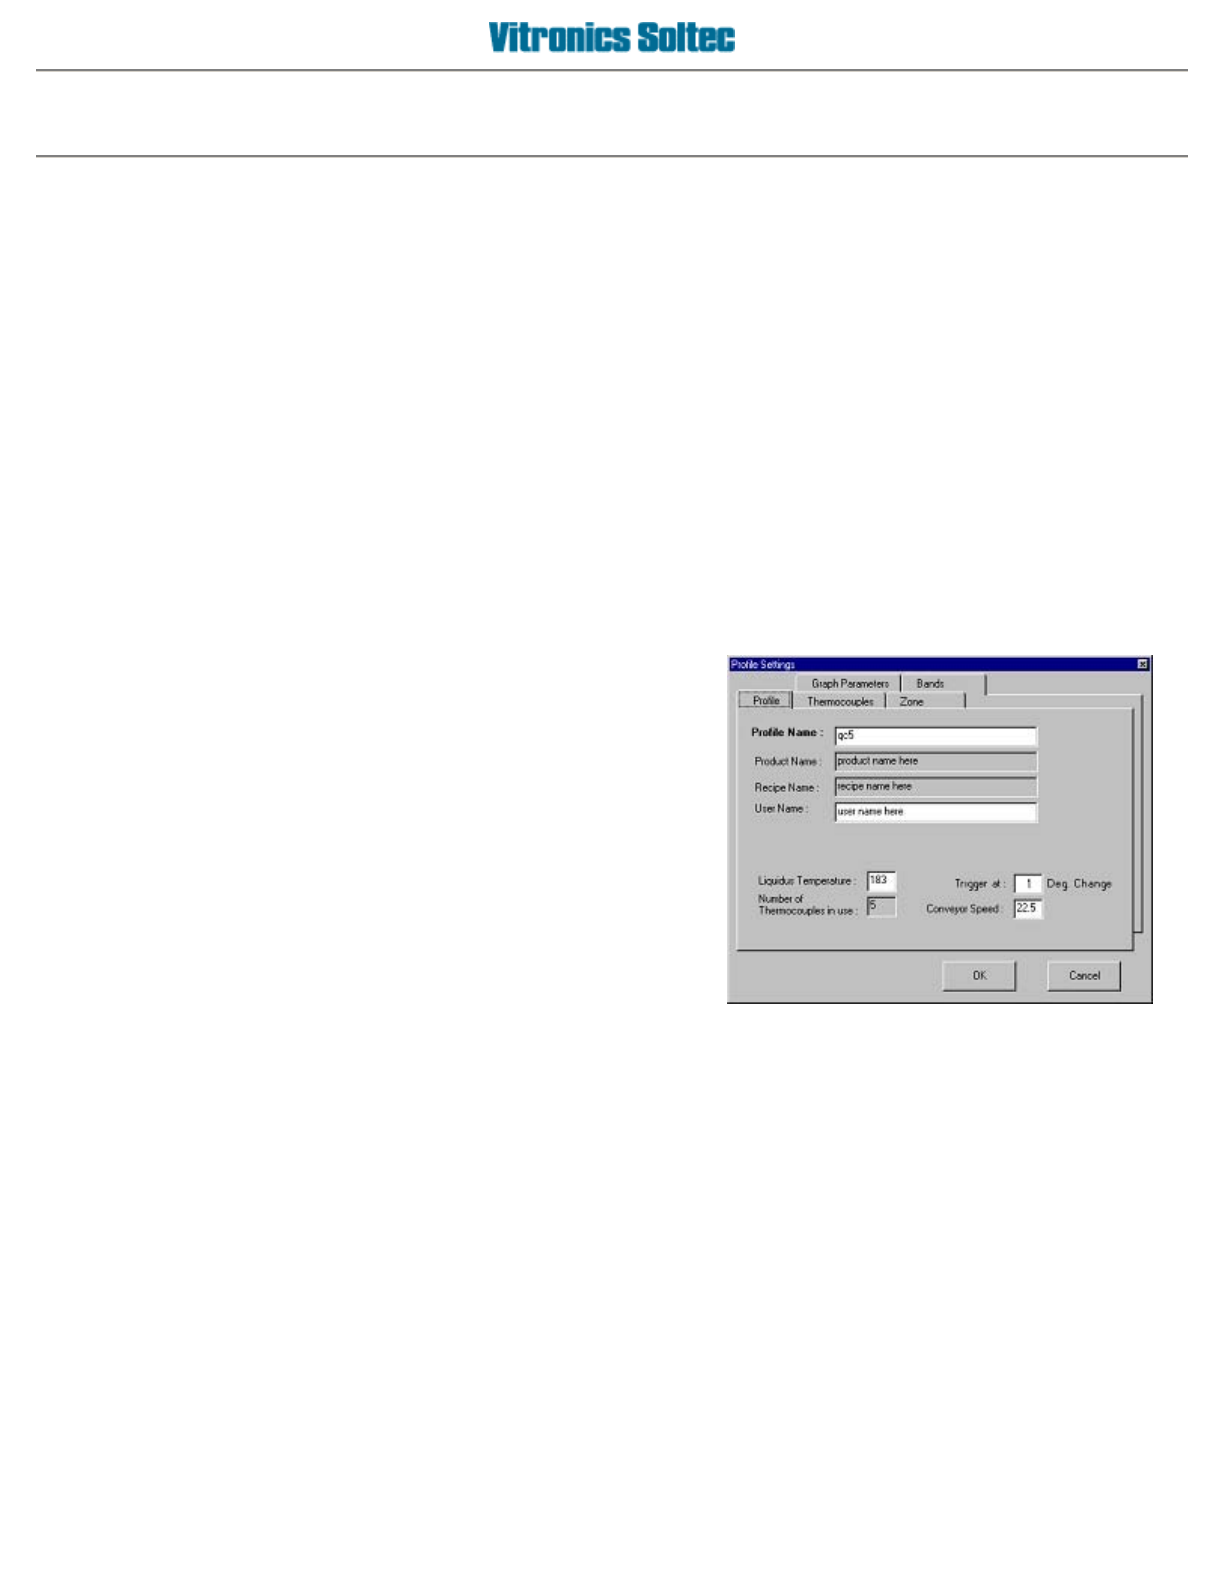
Profile - enter information about the profile,
like a name etc.
Thermocouples - select which of the 5
profile thermocouples to use when creating
a new profile, and enter text to describe the
physical board location of each profile
thermocouple
Zone info - displays an overview of the set
points of all the oven zones
z
Help
{
How do I..
- Displays this help file
{
About
- Displays a window, with software version
information of the profiler program
Operator manual 40 August 2003
The two buttons on the bottom of the display have the following functions:
z
Record/Stop
- This button directs the profiler to start or stop collecting data. A plot of the active
profile thermocouple temperature readings is displayed when data collection is started. Data
collection automatically stops when the board being profiled travels out the off-load end of the oven,
and a ready message is displayed to indicate that the profile has completed. The moment the data
collection automatically stops is determined by the oven length and the conveyor speed.
z
Legend
- This button opens a display window containing general information about the current
profile. The information in this window is meaningful after a profile is created or after loading a
previously saved profile.
When a profile is ready or complete it can be saved to a database file, by selecting
[file][Save]
.
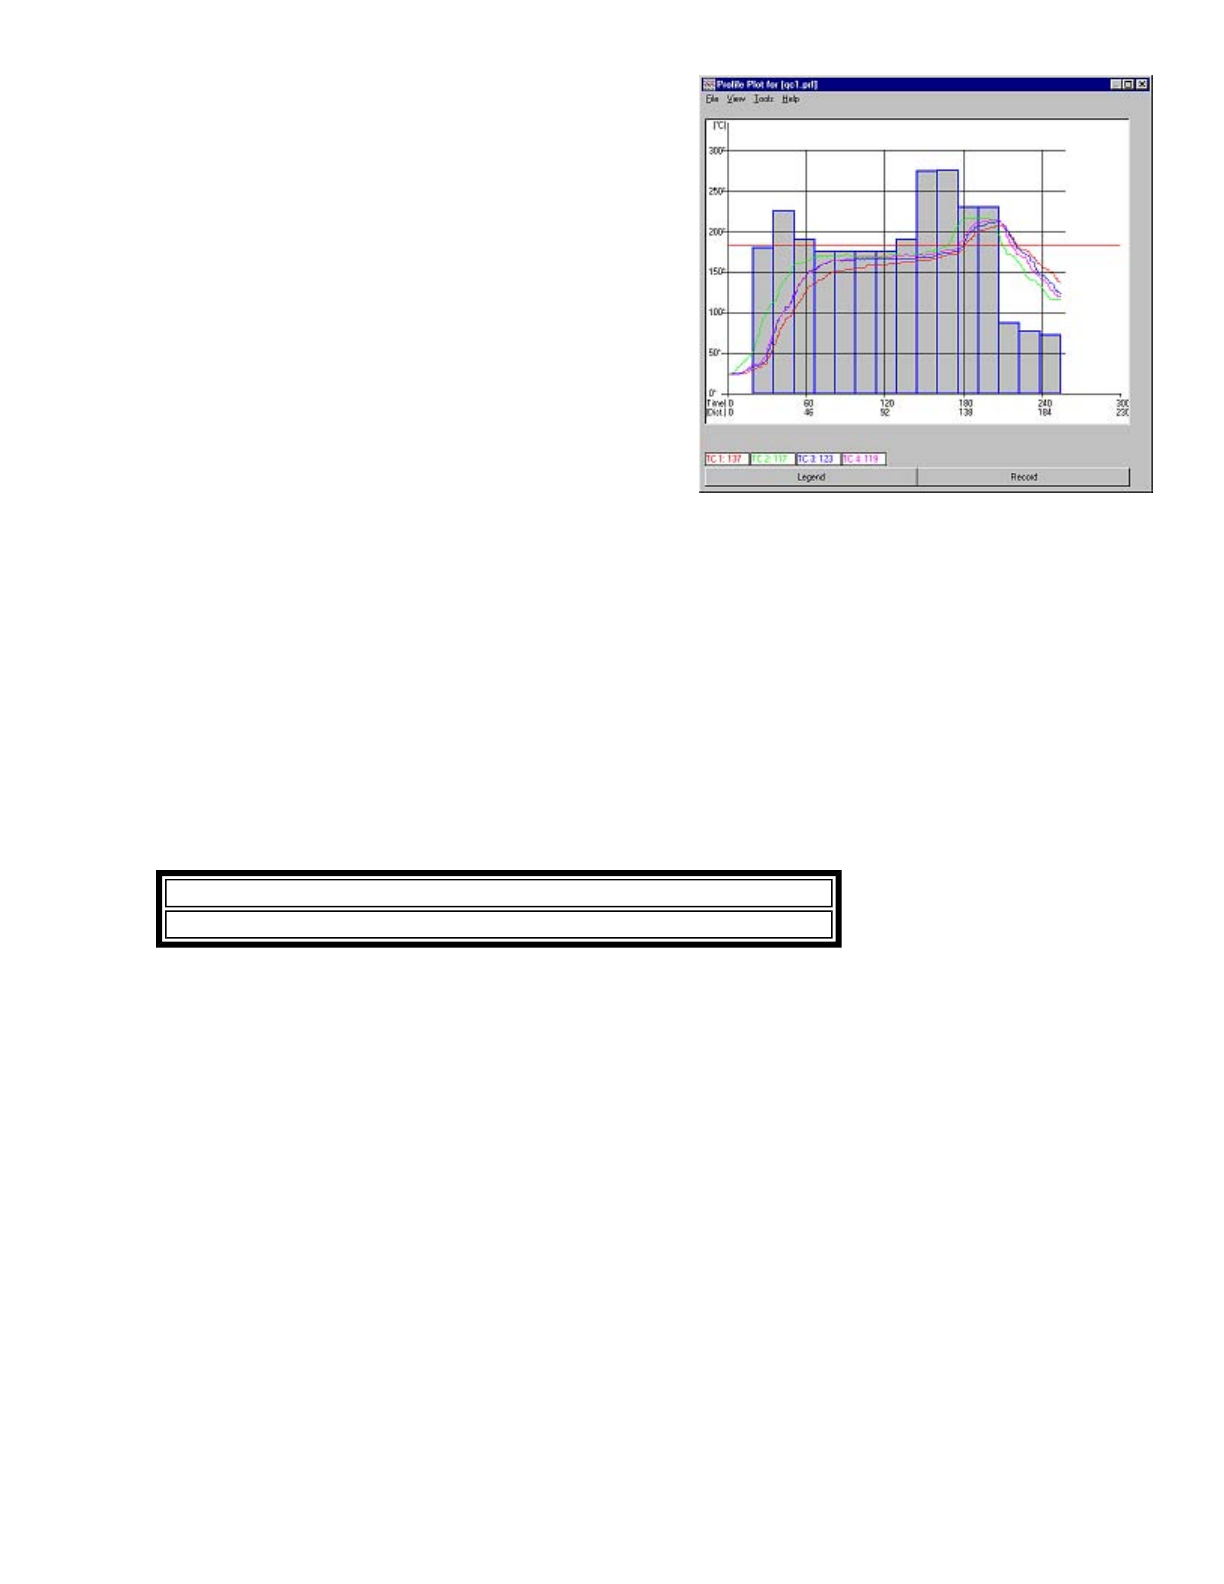
A
graph is displayed with the length of the oven on the X-
axis, and oven zone temperatures on the Y-axis. The
estimated time that the board being profiled will be in the
oven is also displayed on the X-axis, which is calculated from
the current conveyor speed.
Oven zone temperature settings are represented by bars in
the graph. A red line in the graph indicates the liquidus
temperature set by the user. The current temperature
readings from the profile thermocouples are displayed below
the graph.
IMPORTANT
files are only allowed to be saved in the directory specified by the program.
Operator manual 41 August 2003