s26030829.pdf - 第12页
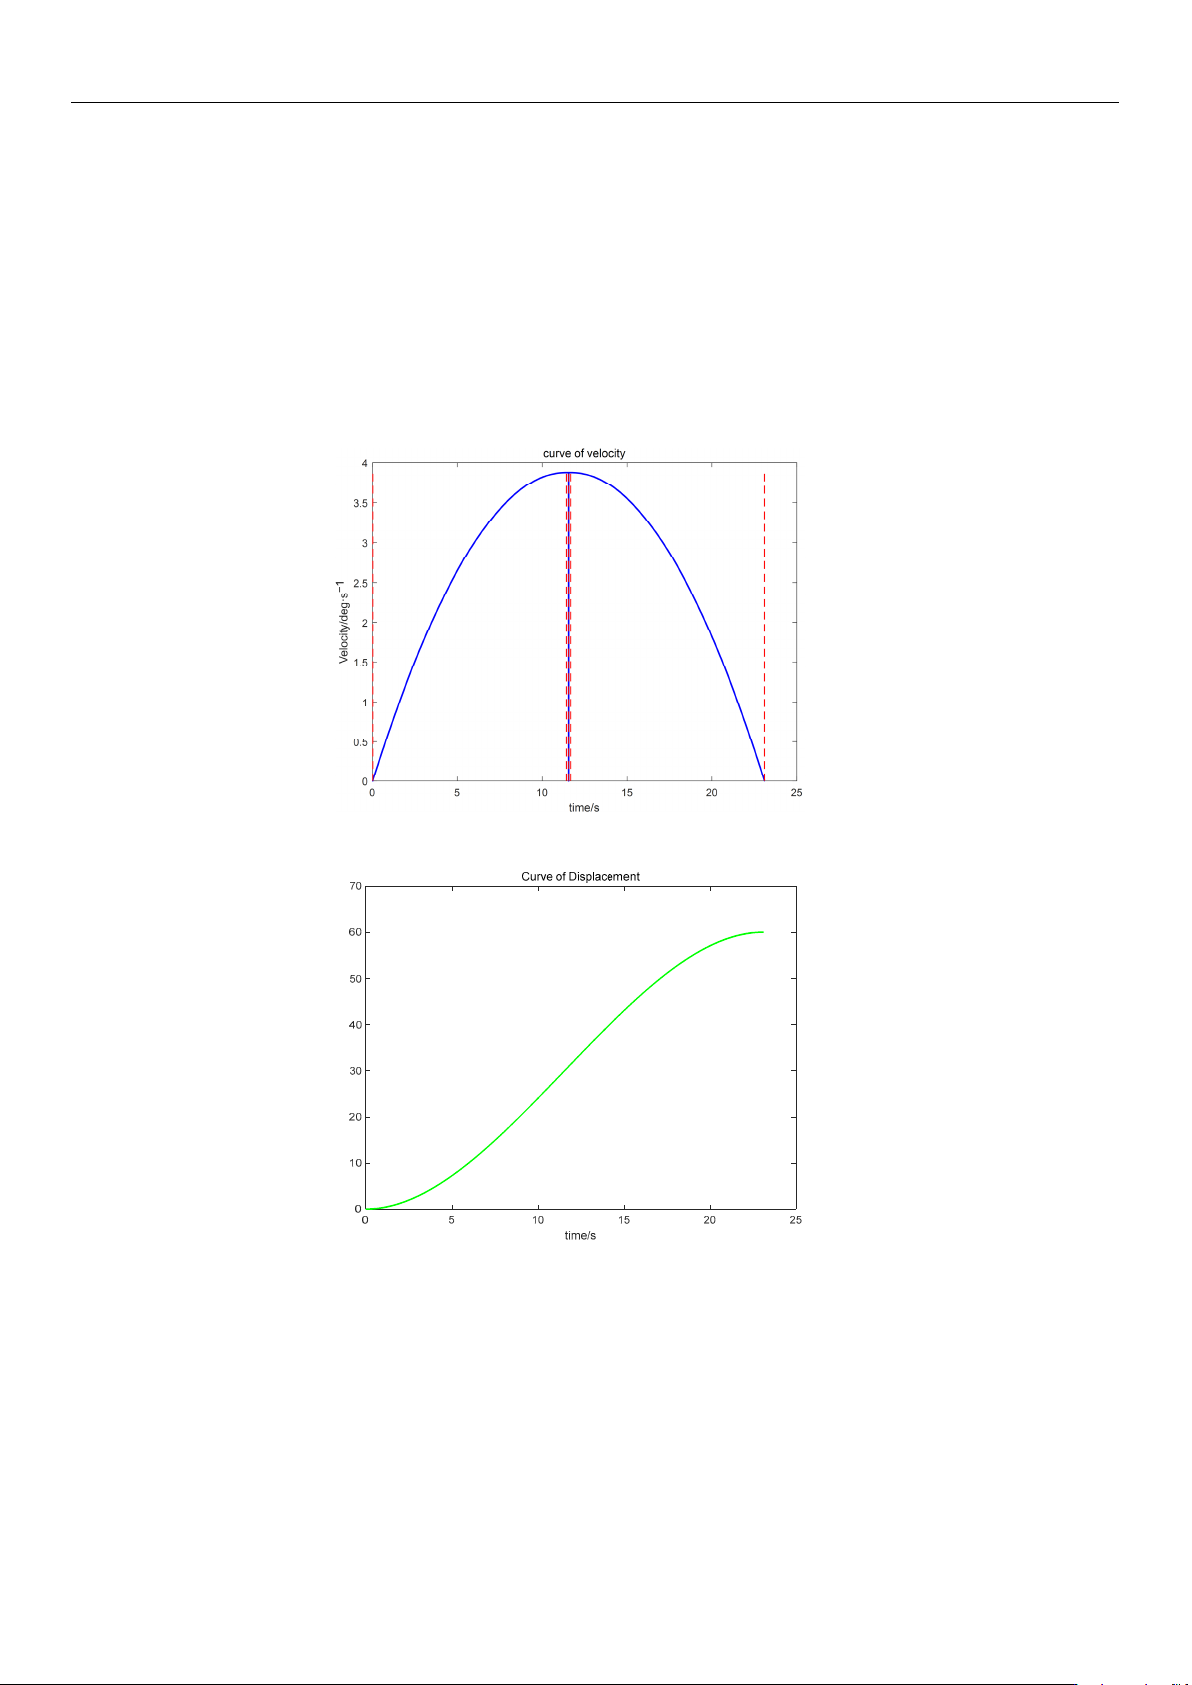
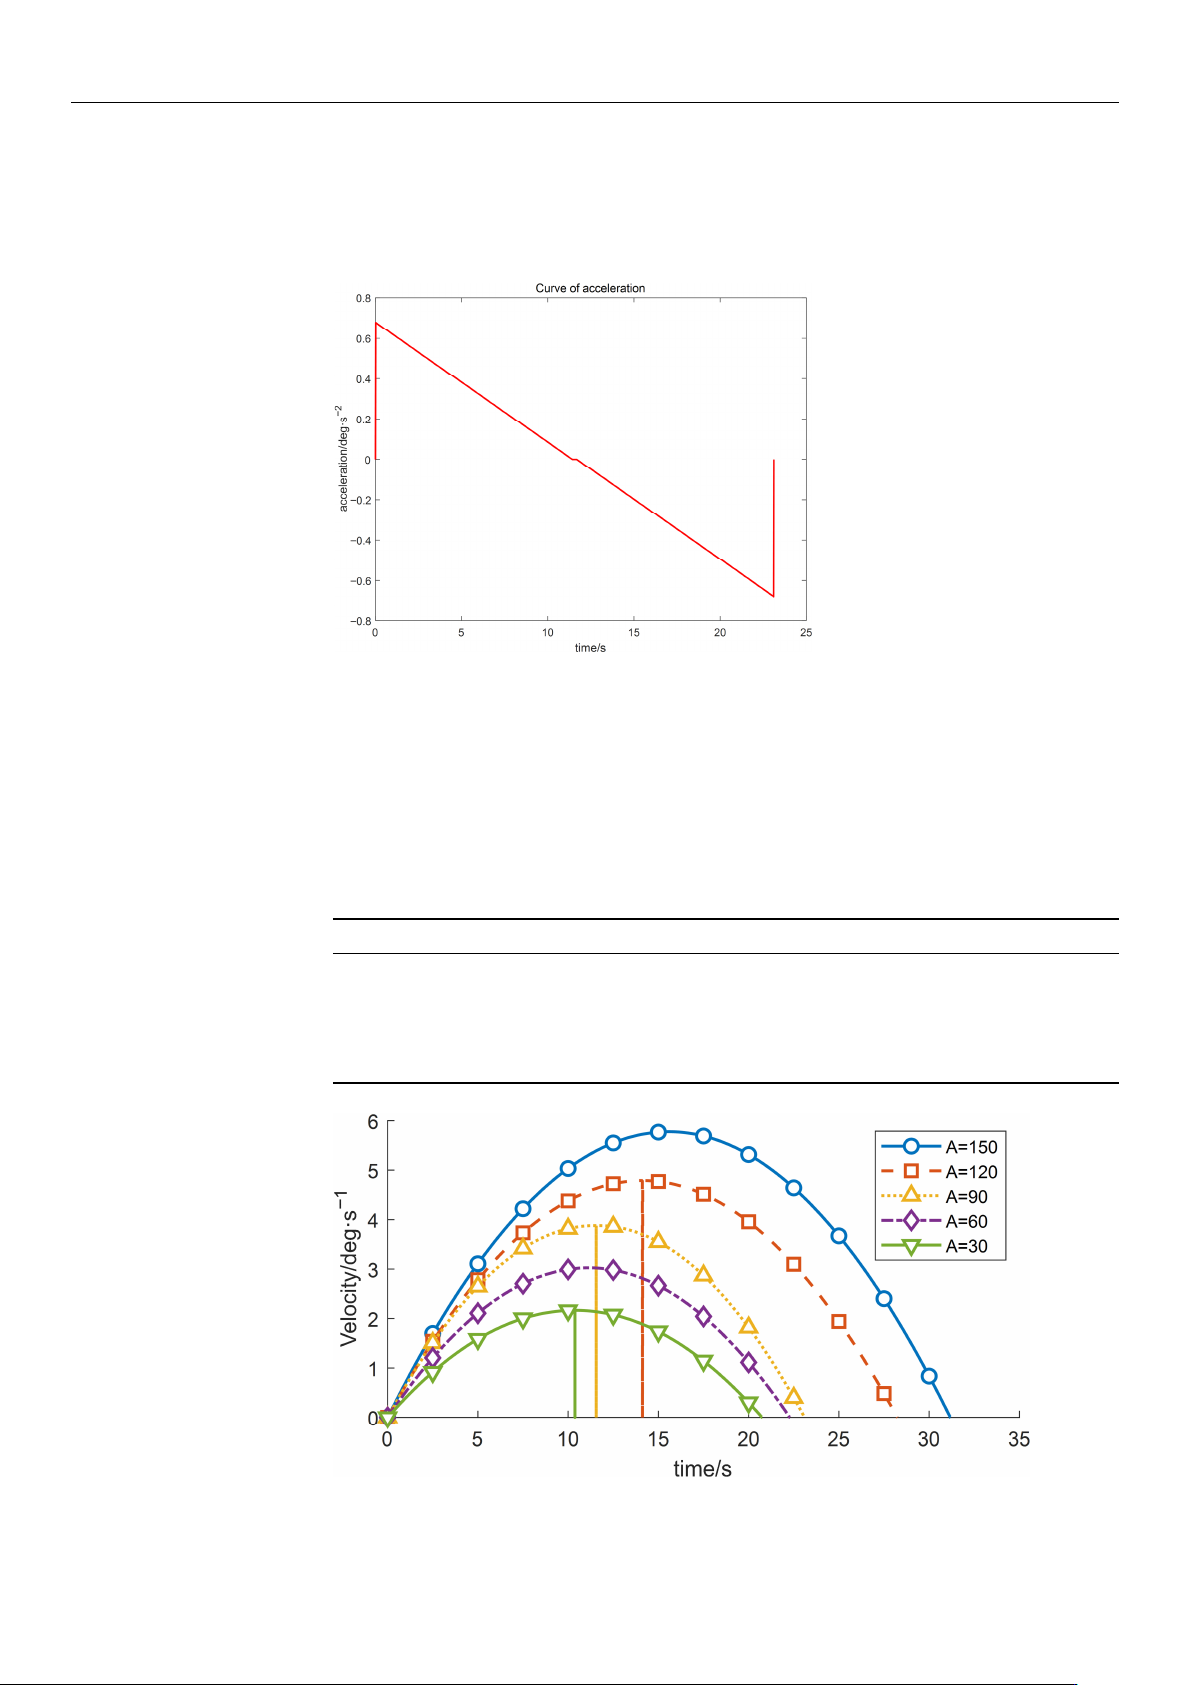
Sensors 2026 , 26 , 829 12 of 21 parameters is shown in Figur e 5 . Overall, the profile is relatively smooth, with no abrupt changes in velocity . Moreover , as indicated by the displacement curve in Figure 6 and the acc…
Sensors 2026, 26, 829
11 of 21
(2) Establish the relationship between t
1
, t
2
, and total time t
3
, and use the central dif-
ference method to derive the acceleration of the forearm. Construct an energy cost function.
By combining this function with the displacement equation and assigning weight values, a
composite multi-objective function is obtained. Through global search by the exploration
group and local optimization by the utilization group, the current optimal solution is
determined. If the maximum preset number of iterations is reached, the iteration stops.
(3) Using the proposed GGO-based optimization under the prescribed constraints,
the optimal switching times t
1
and t
2
were determined. The resulting kinematic profiles
(velocity, displacement, acceleration, and jerk versus time) were then generated in MATLAB
for subsequent analysis, as presented in Figures 5–7.
Figure 5. Velocity trajectory planning profile.
Position/deg
Figure 6. Displacement–time trajectory profile.
The simulation results indicate that the proposed polynomial interpolation–based
trajectory planning method enables the manipulator’s angular velocity to vary continu-
ously and smoothly throughout the entire motion. This significantly mitigates mechanical
vibration and impact induced by abrupt velocity variations, thereby helping to reduce os-
cillations of the end-effector. Moreover, the method imposes a lower computational burden
on the control system, and the acceleration variation can be interpreted more intuitively
substituting the optimal solution t
3
into the energy cost function, the optimal vibration
energy index under the prescribed weight constraint can be obtained. The double-parabola–
trapezoidal velocity planning profile derived from the Graylag Goose Optimization (GGO)
https://doi.org/10.3390/s26030829
Sensors 2026, 26, 829
12 of 21
parameters is shown in Figure 5. Overall, the profile is relatively smooth, with no abrupt
changes in velocity. Moreover, as indicated by the displacement curve in Figure 6 and
the acceleration curve in Figure 7, the angular variation is gradual, and the acceleration
exhibits no pronounced fluctuations.
Figure 7. Acceleration–time profile.
5. Comparison Under Different Initial Input Conditions
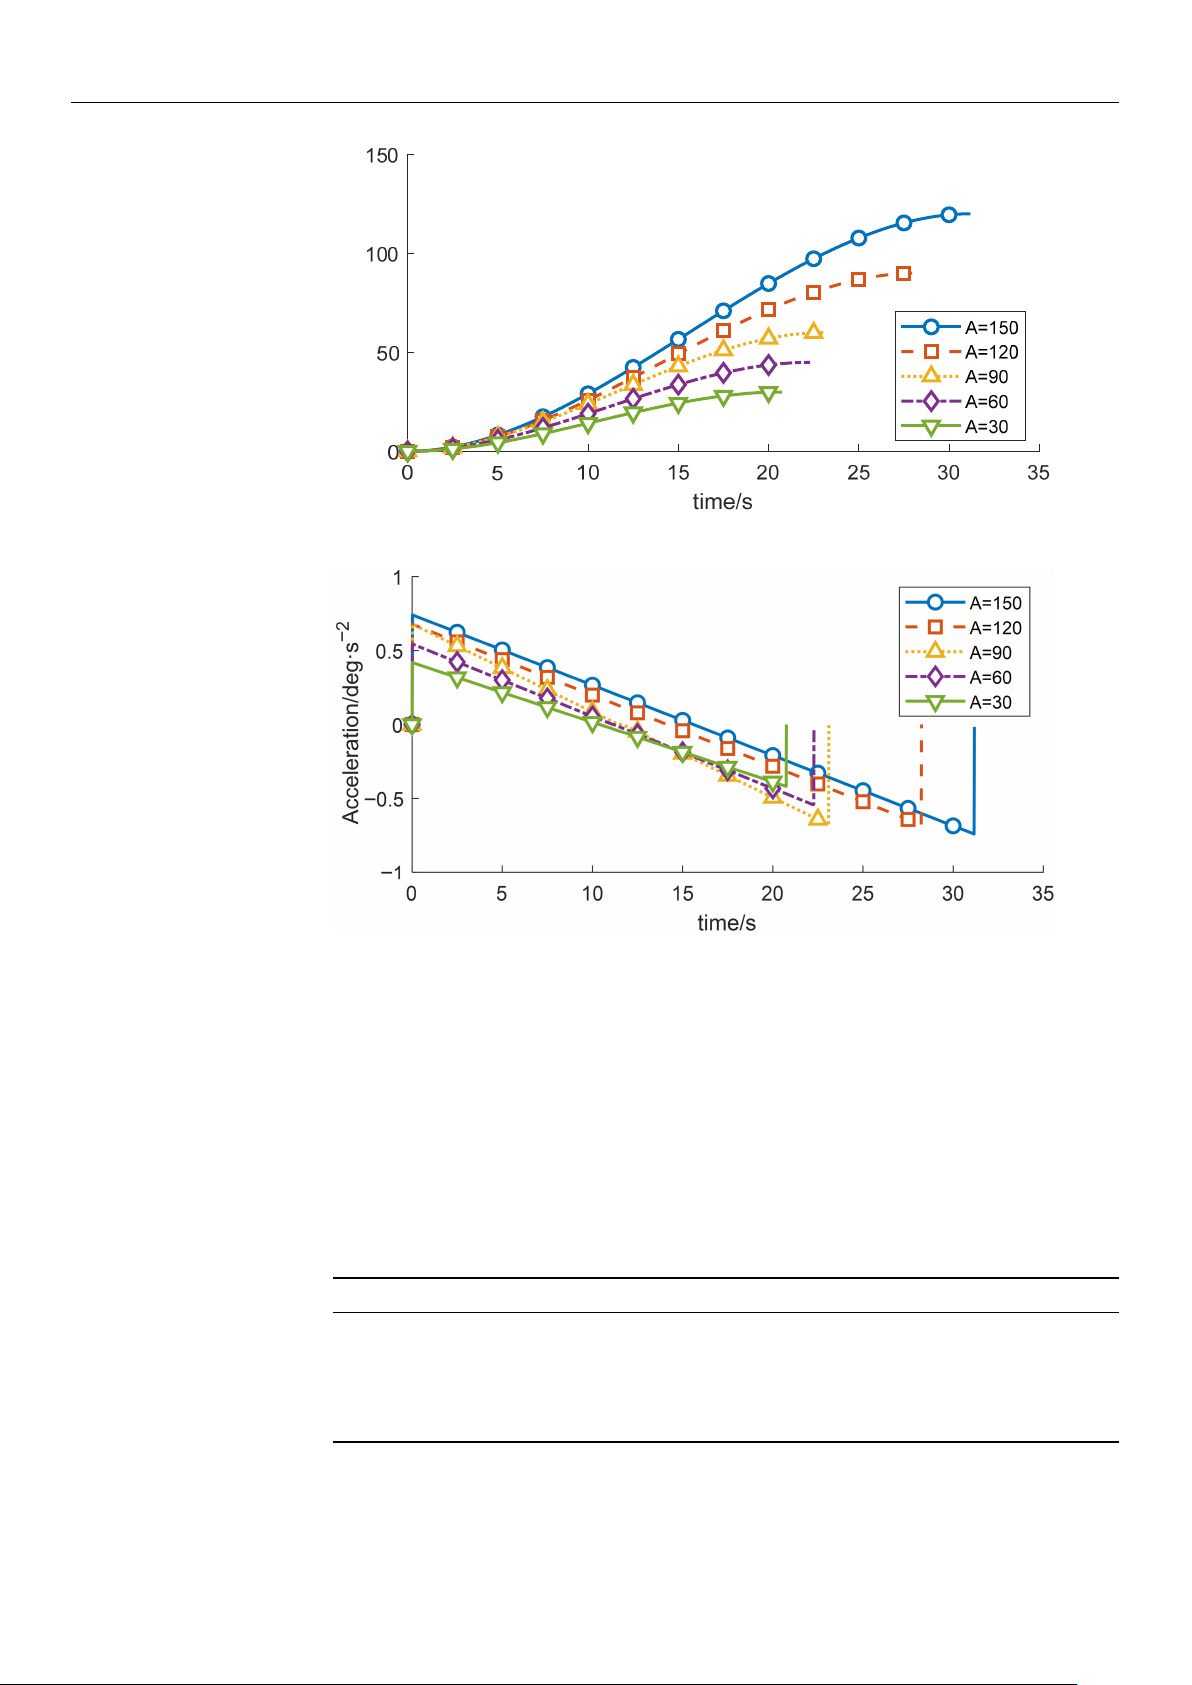
(1) By modifying the motion range of the wafer-transfer manipulator, i.e., varying the
angular displacement A, the corresponding trajectories and the residual vibration energy
can be rapidly fitted through iterative computation. With all other conditions unchanged,
the experimental results are summarized in Table 5 and Figures 8–10.
Table 5. Variation in Objective Function Values of Wafer Transfer Robot Arm at Different Displacements.
Displacement Runtime Vibration Energy Index E
vib
150 16.8 347.8261
120 13.8 347.8261
90 9.633 339.394
60 7.083 166.957
30 6.033 164.882
Figure 8. Velocity-time profiles for different planned displacements.
https://doi.org/10.3390/s26030829
Sensors 2026, 26, 829
13 of 21
Displacement/deg
Figure 9. Displacement-time profiles for different planned displacements.
Figure 10. Acceleration-time profiles for different planned displacements.
As indicated in Table 5, the residual vibration energy is strongly influenced by the total
angular displacement. When the angular change increases from 60
◦
to 90
◦
, the residual
vibration energy rises by 103.28%. Therefore, constraining the forearm angular variation to
within 60
◦
can significantly suppress vibrations induced by the flexible joint.
(2) To investigate the influence of the start-up acceleration on the motion performance
and vibration characteristics of the wafer-transfer manipulator, comparative experiments
were conducted by varying the start-up acceleration a while keeping the other control
parameters constant. The results are listed in Table 6 and Figures 11–13.
Table 6. Variation in Objective Function Values of Wafer Transfer Robot Arm at Different Startup Acceleration.
Startup Acceleration Runtime Vibration Energy Index E
vib
−5 12.6952 32.8125
10 13.9619 131.2500
20 8.2476 525.0000
40 5.6347 2149.8891
80 2.0144 9029.1039
https://doi.org/10.3390/s26030829