s26030829.pdf - 第16页
Sensors 2026 , 26 , 829 16 of 21 Figure 16. Acceleration–time profiles for dif ferent time weight. T able 7 shows that the sensitivity of both the total operation time and the vibration energy index to w1 is relatively lo…
Sensors 2026, 26, 829
15 of 21
a start-up acceleration of approximately a
≈
20 deg/s
2
can be regarded as a compromise
range that balances operation time and vibration mitigation, and this range is advantageous
for subsequent optimization and analysis.
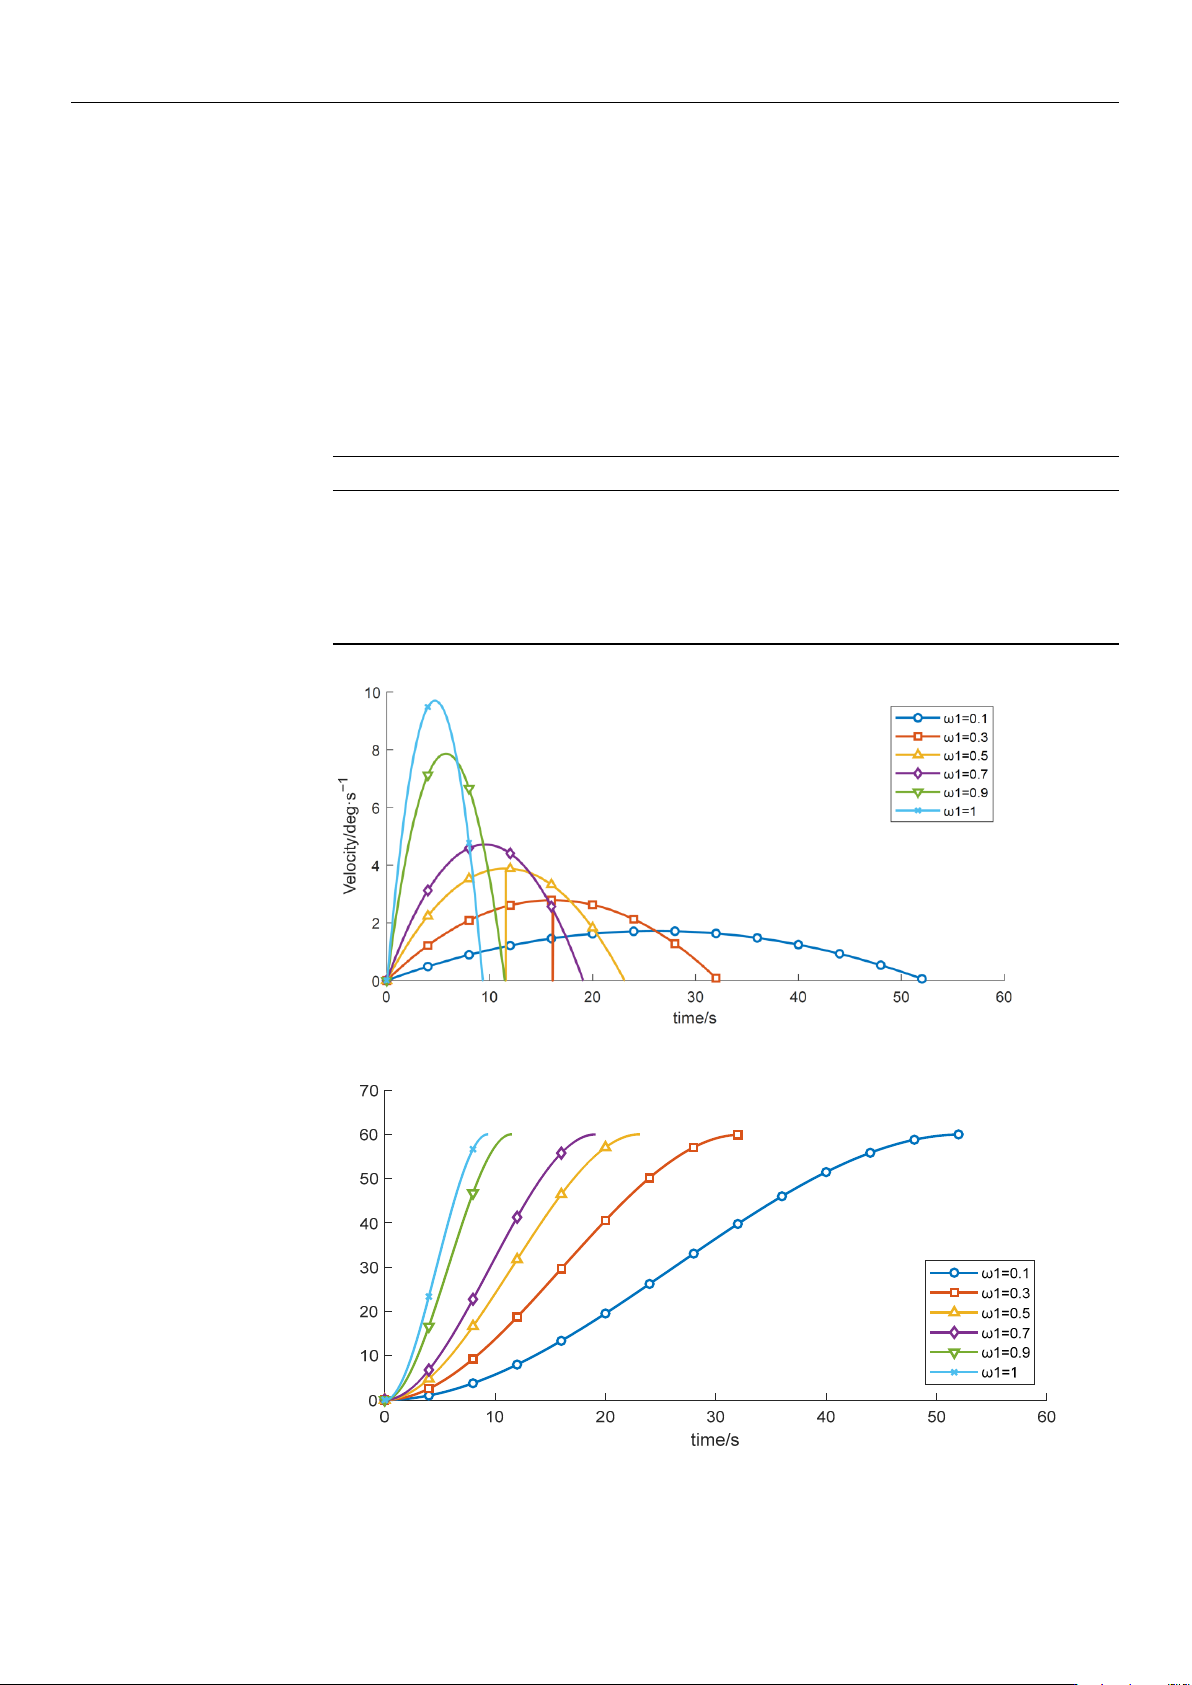
(3) With the other control parameters unchanged, comparative experiments were
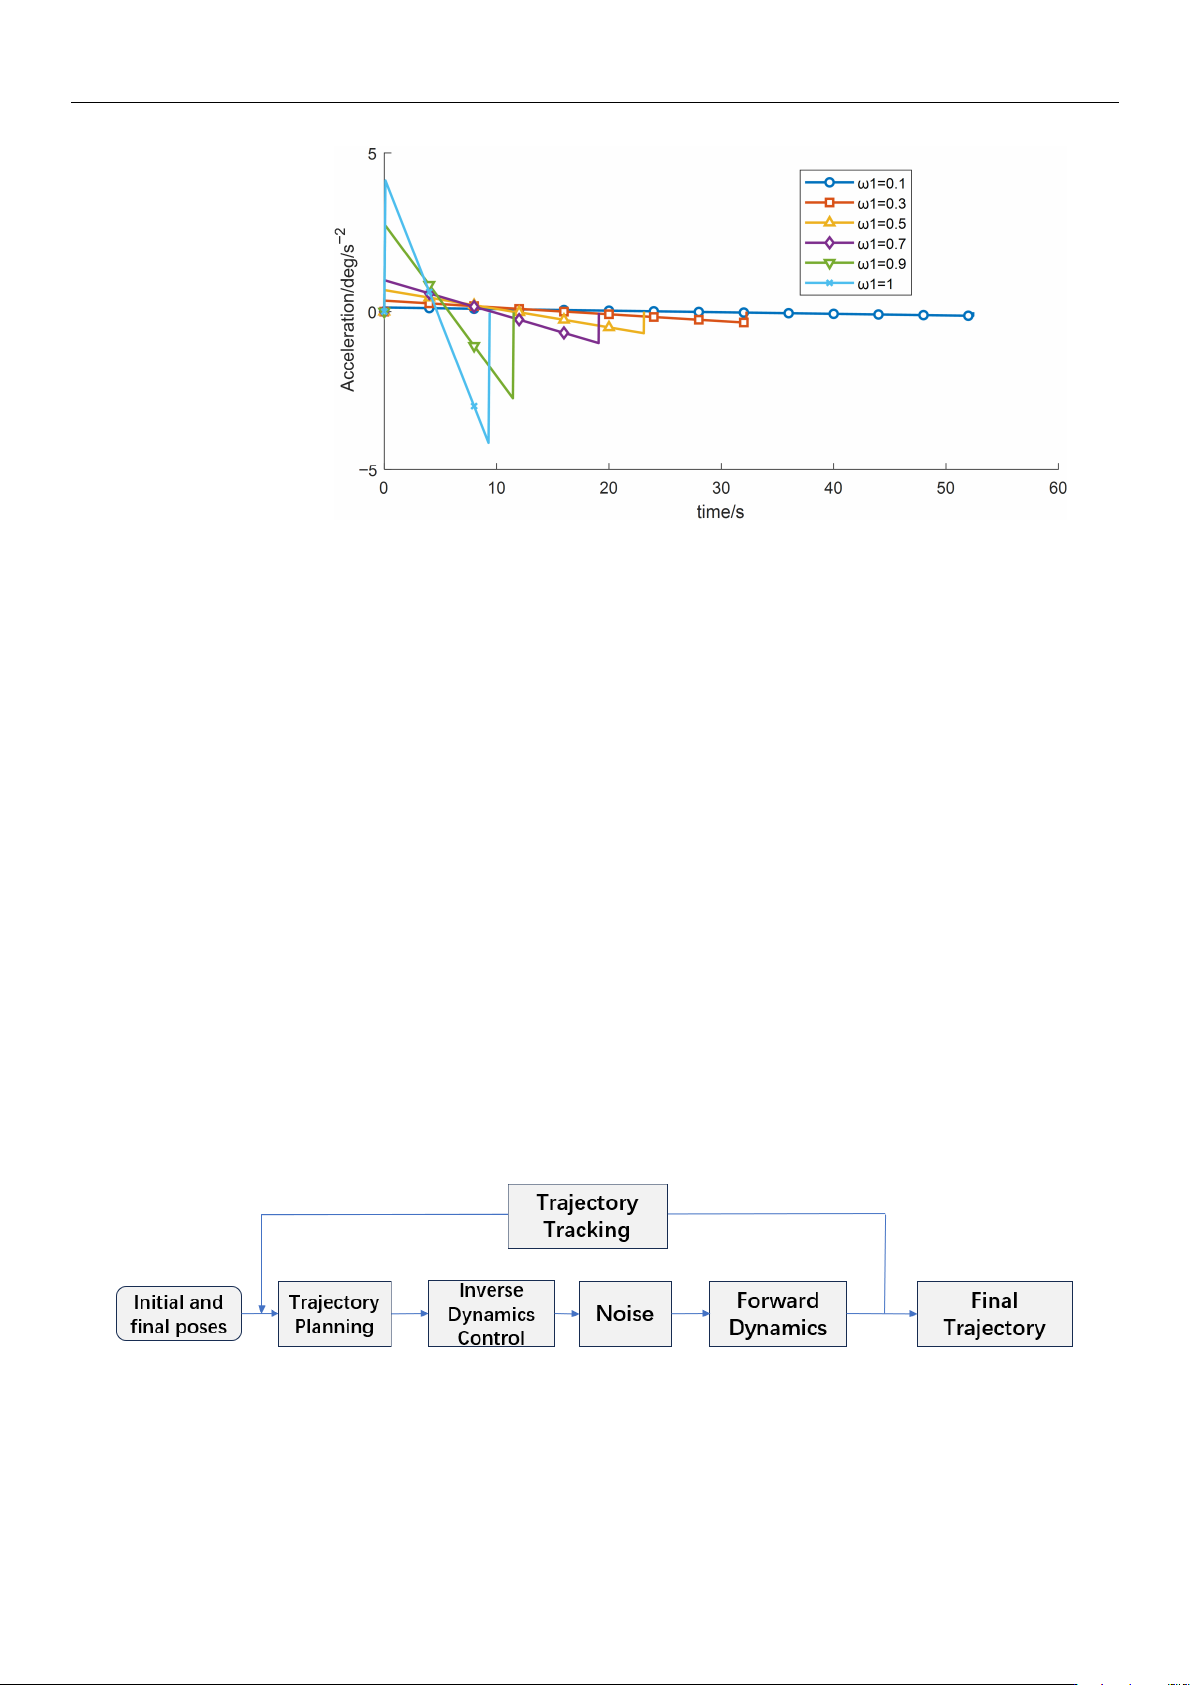
performed by varying the time-weighting factor w1, the results are shown in Table 7
and Figures 14–16. The experimental data indicate that, under the given constraints and
operating conditions, increasing w1 gradually reduces the total time obtained from the
objective function. When w1 > 0.9, the trajectory duration decreases markedly, while the
vibration energy index increases sharply.
Table 7. Variation in Objective Function Values of Wafer Transfer Robot Arm at Different Time Weight.
Time Weight Runtime Vibration Energy Index E
vib
0.1 22.0667 165.5172
0.3 22.0666 165.5172
0.5 21.4938 170.589
0.7 19.583 190.022
0.9 16.1414 239.1657
1.0 4.1635 69,522.553
Figure 14. Velocity-time profiles for different time weight.
Displacement/deg
Figure 15. Displacement–time profiles for different start acceleration time weight.
https://doi.org/10.3390/s26030829
Sensors 2026, 26, 829
16 of 21
Figure 16. Acceleration–time profiles for different time weight.
Table 7 shows that the sensitivity of both the total operation time and the vibration
energy index to w1 is relatively low, and the current optimization results therefore lie in an
approximately flat Pareto region. Overall, although increasing the time weight reduces the
operation time, it may induce higher vibration energy, implying greater instability and/or
energy consumption.
6. Simulation Analysis Based on Simulink
In this study, a Simulink-based trajectory simulation platform was Established. The
optimal trajectory parameters obtained from the optimization algorithm were imported
into the platform to simulate and evaluate the manipulator’s stability under external
disturbances. The external disturbance shown in Figure 17 is modeled as a bounded random
torque applied to the joint actuator to emulate unmodeled dynamics and environmental
perturbations in wafer-handling operations. The disturbance is defined as:
τ
d
(t) = τ
max
ξ(t), ξ(t) ∈ [−0.1, 0.1] (20)
where
ξ
(t) is a zero-mean bounded random process and
τ
max
denotes the disturbance
bound. In the Simulink implementation,
ξ
(t) is generated using a random source (e.g., a
band-limited noise or uniform random sequence) and then constrained by saturation to
ensure |
τ
d
(t)|
≤ τ
max
. This bounded setting provides a physically meaningful robustness
test while avoiding unrealistically large excitation.
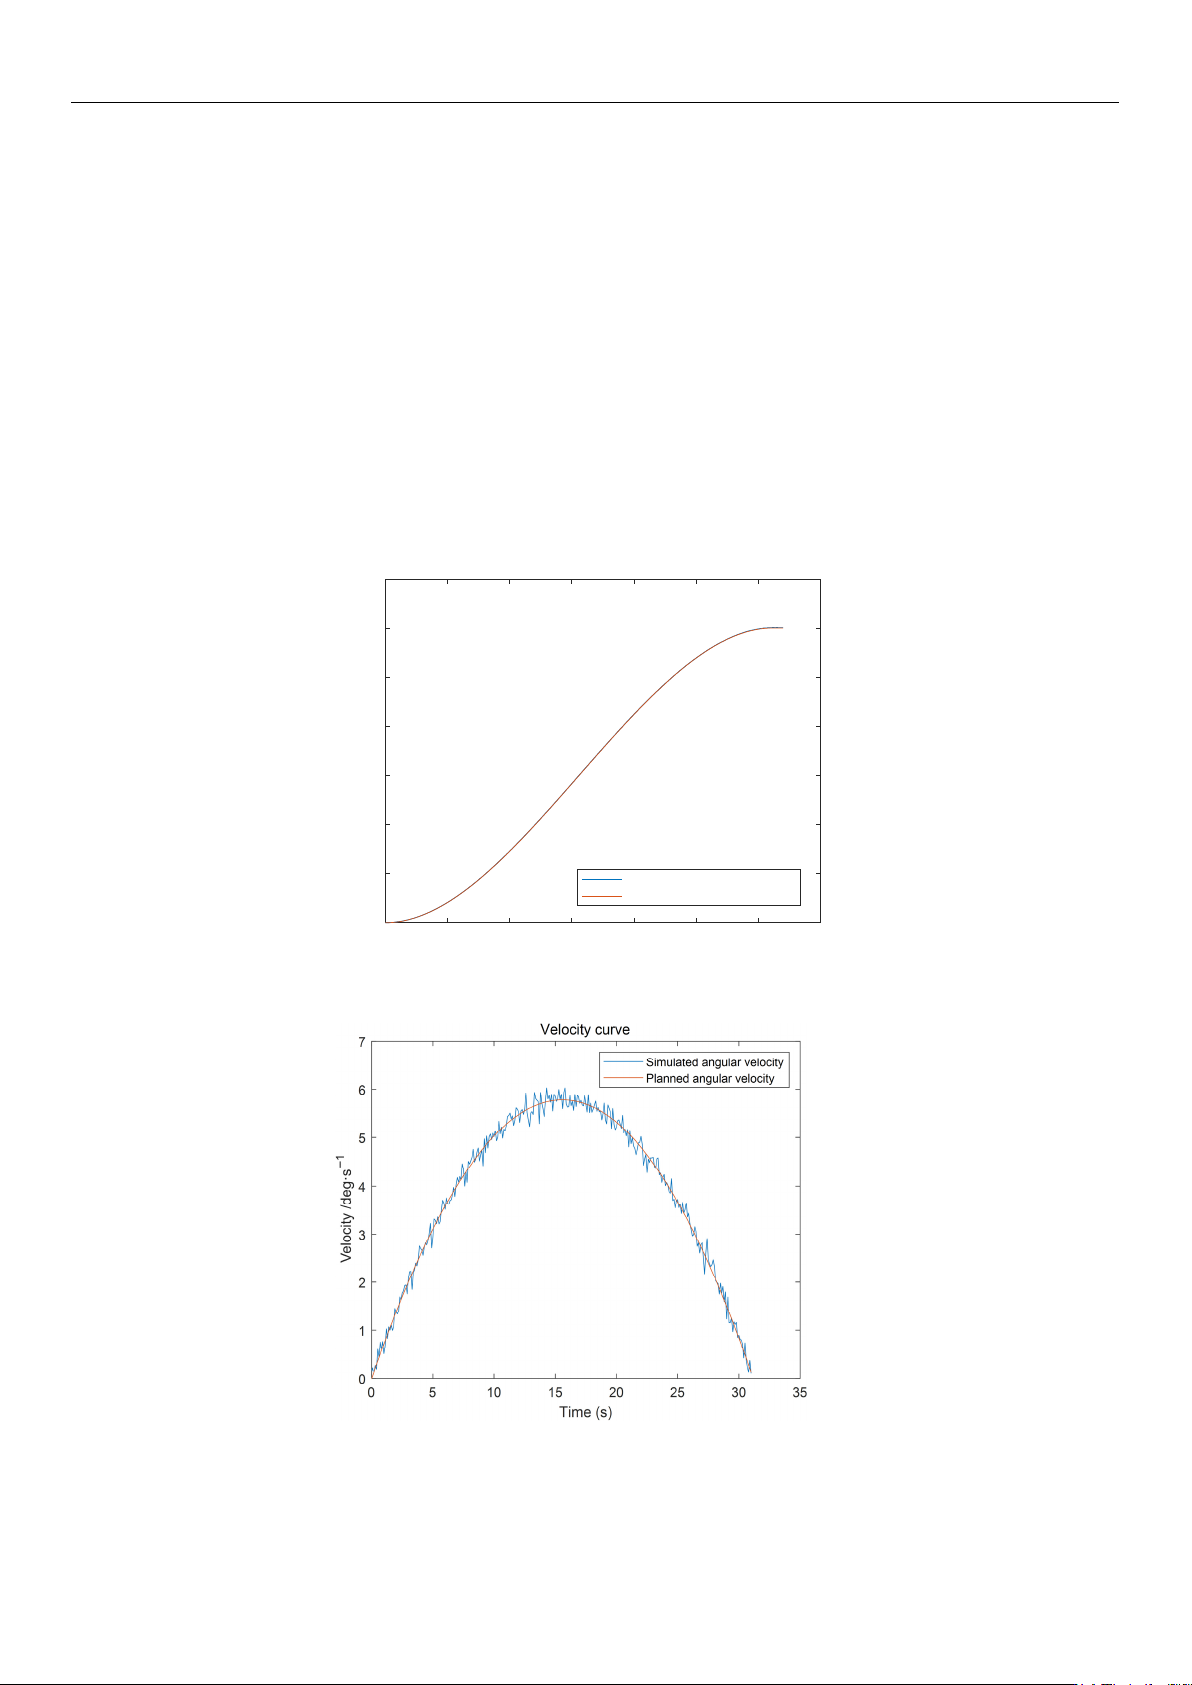
Figure 17. Robotic Arm Simulation System Flowchart.
This represents unmodeled dynamics and external perturbations typically encountered
in industrial wafer-handling environments.
To control the robot motion, the Simulink control program first initializes the system
by setting the manipulator coordinates to the prescribed initial state [
39
]. Based on the
planned trajectory parameters obtained from the preceding simulations, a smooth-function
https://doi.org/10.3390/s26030829
Sensors 2026, 26, 829
17 of 21
output module is constructed to generate the reference profiles of the joint angle, angular
velocity, and angular acceleration. Meanwhile, a random disturbance module is connected
externally to provide an excitation torque, which is applied as the external input torque
τ
to
the dynamic planning module. A closed-loop control function is then established according
to the governing dynamic equations. The output angular acceleration is integrated twice to
obtain the simulated angular velocity and angular displacement, and the resulting data
are exported to spreadsheets. Furthermore, inverse kinematics is employed to inversely
infer the effect of the external disturbance and back-calculate the corresponding driving
torque, thereby completing the closed-loop simulation test module [
40
]. In this study,
angular displacement, angular velocity, angular acceleration, and joint torque are adopted
as evaluation metrics to assess the time-planning performance and vibration-suppression
capability of the wafer-transfer robot using the Simulink test platform. The integrated
simulation platform is executed, and the Scope outputs are exported to the workspace via
the To Workspace function, yielding the simulation results shown in Figures 18–20.
0 5 10 15 20 25 30 35
Time (s)
0
20
40
60
80
100
120
140
Displacement/deg
displacement curv
e
Simulated angular displacement
Planned angular displacement
Figure 18. Robotic Arm Displacement Curve.
Figure 19. Robotic Arm Velocity Curve.
https://doi.org/10.3390/s26030829