s26030829.pdf - 第6页
Sensors 2026 , 26 , 829 6 of 21 velocity at time t 2 . If t = t 4 , the speed begins to decelerate until it r eaches 0 at t 6 , achieving a smooth stop. The trajectory expression is given in Equation (8). . q = …

Sensors 2026, 26, 829
5 of 21
Then the total kinetic energy of the robotic arm is:
T = T
1
+ T
2
=
1
2
m
1
v
2
c1
+
1
2
I
1
.
q
2
1
+
1
2
m
2
v
2
c2
+
1
2
I
2
(
.
q
1
+
.
q
2
)
2
(2)
I
1
and I
2
represent the moments of inertia of the link about its center of mass. Since
both the upper arm and forearm rotate around their joints, the moments of inertia of the
upper arm and forearm are:
I
1
=
1
3
m
1
l
2
1
, I
2
=
1
3
m
2
l
2
2
(3)
The Lagrange function of the robotic arm is:
L = T − V =
1
2
(I
1
+ m
2
l
2
1
+ I
2
)
.
θ
2
1
+
1
2
I
2
.
θ
2
2
+ I
2
.
θ
1
.
θ
2
+ m
2
l
1
l
c2
.
θ
1
(
.
θ
1
+
.
θ
2
) cos θ
2
−
1
2
k(θ
2
− θ
o
)
2
(4)
Based on the Lagrange function, the Lagrange equations are further applied to each
generalized coordinate.
The Lagrange dynamic equation of the lower arm is:
d
dt
∂L
∂
.
q
1
!
−
∂L
∂q
1
= τ
1
(5)
The Lagrange dynamic equation of the upper arm is:
d
dt
∂L
∂
.
q
2
!
−
∂L
∂q
2
= τ
2
(6)
The dynamic model of the wafer transfer robot system is:
"
τ
1
τ
2
#
=
"
M
11
M
12
M
21
M
22
#"
..
q
1
..
q
2
#
+
"
C
11
C
12
C
12
C
22
#"
.
q
1
.
q
2
#
+
"
0
k(q
2
− θ)
#
(7)
In Equation (7), the stiffness term k(q
2
− θ
) represents the restoring torque induced
by the elastic deformation of the flexible transmission and is applied to the corresponding
joint equation.
3. Vibration Suppression Trajectory Planning for Robotic Arms Based on
Graylag Goose Algorithm
Existing robot trajectory planning methods include cubic and quintic polynomial
trajectory planning algorithms [
32
–
34
], T-shaped and S-shaped acceleration-deceleration
trajectory planning algorithms, and B-spline trajectory planning algorithms. During the
operation of a wafer handling manipulator, the start and end positions are known, while
the motion states during the process are unknown. This study uses a cubic polynomial
interpolation method to plan the motion trajectory [
35
]. This method combines the low
impact and high stability of S-shaped trajectory planning with the low computational
load of T-curve planning. It is easy to program and debug, has high reliability, and can
avoid sudden changes in acceleration, thereby effectively suppressing vibrations at the
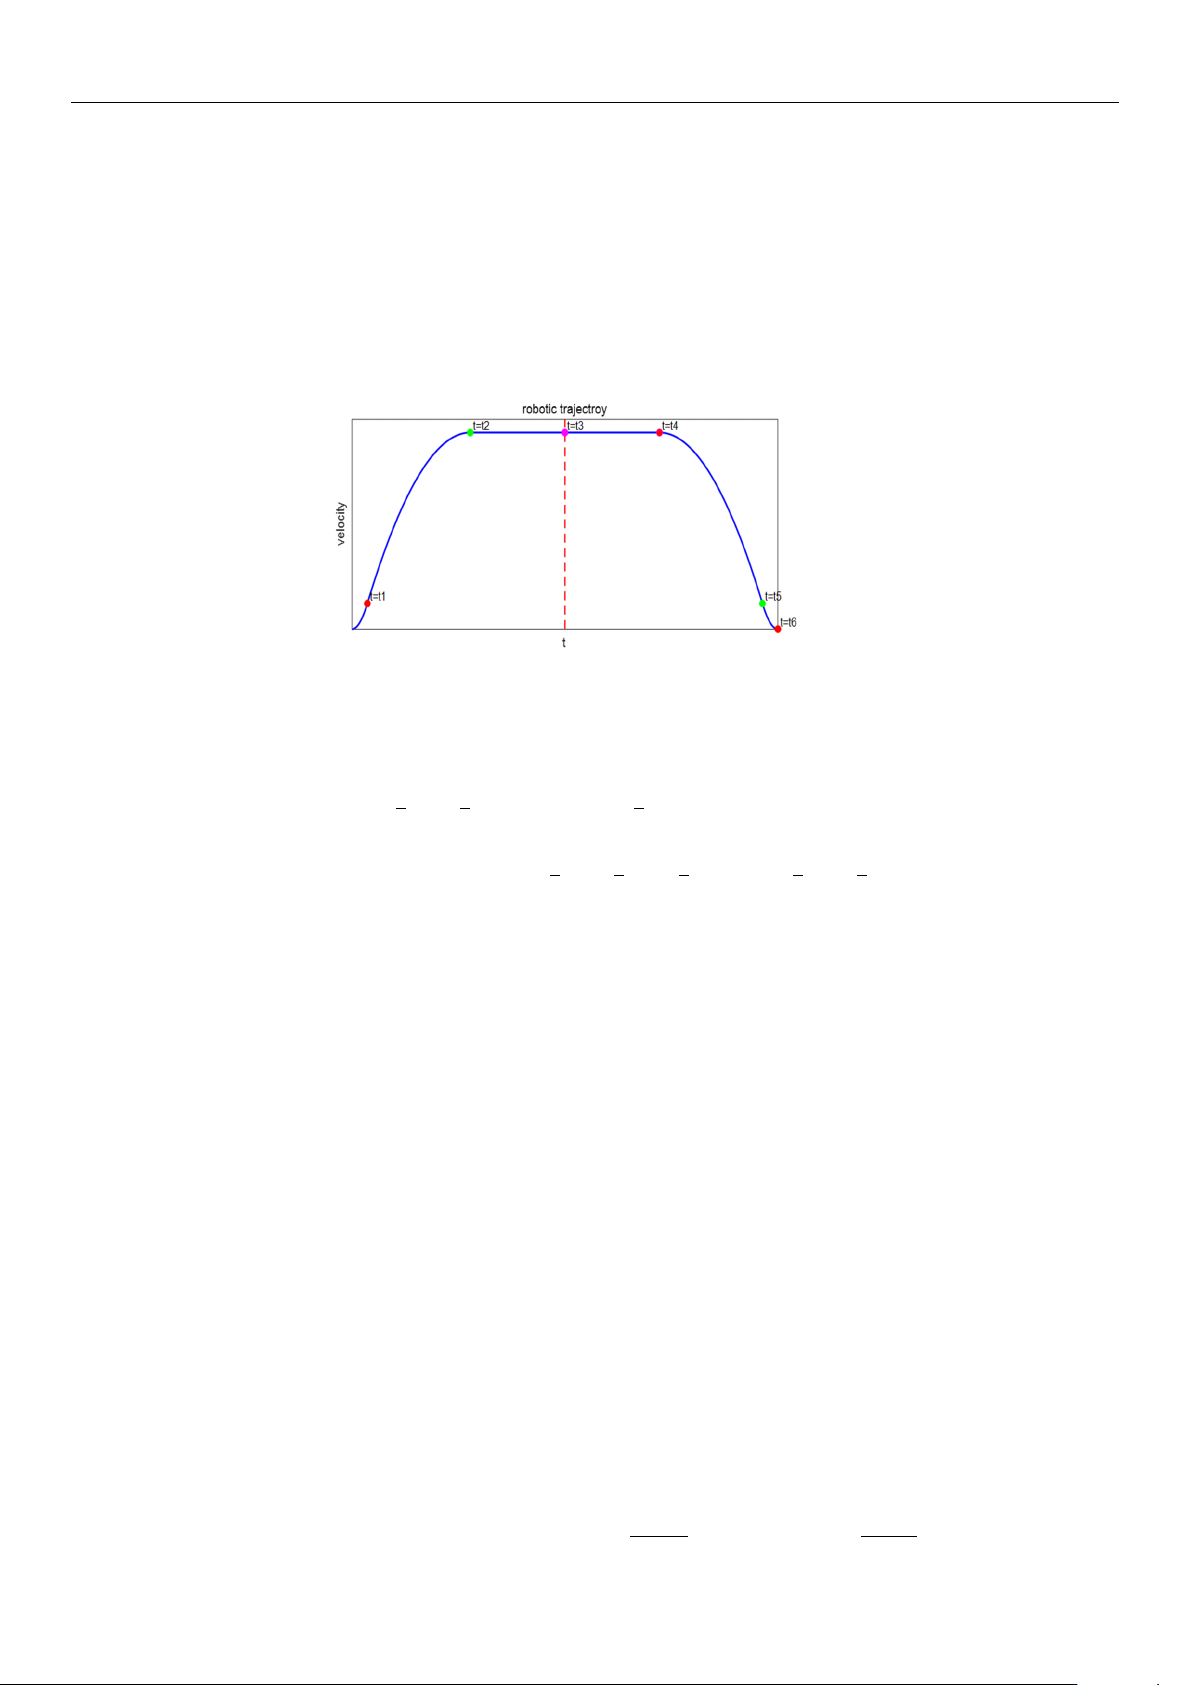
manipulator’s end. As shown in Figure 2, the polynomial trapezoidal interpolation curve
trajectory is defined over the interval (0, t
6
). The robotic arm first experiences smooth
startup acceleration, the acceleration decreases beginning at time t
1
, and reaches constant
https://doi.org/10.3390/s26030829
Sensors 2026, 26, 829
6 of 21
velocity at time t
2
. If t = t
4
, the speed begins to decelerate until it reaches 0 at t
6
, achieving a
smooth stop. The trajectory expression is given in Equation (8).
.
q =
at
2
, 0 < t < t
1
bt
2
+ ct + d, t
1
< t < t
2
bt
2
2
+ ct
2
+ d, t
2
< t < t
4
b
′
t
2
+ c
′
t + d
′
, t
4
< t < t
5
a(t − 2t
3
)
2
, t
5
< t < t
6
(8)
Figure 2. Velocity planning S-shaped curve.
Let the angular displacement of the wafer transport robotic arm be A, then its dis-
placement equation can be expressed in Equation (9).
2
3
at
3
1
+
2
3
bt
3
2
+ ct
2
2
+ 2dt
2
−
2
3
bt
3
1
− ct
2
1
− 2dt
1
+ 2(t
3
− t
2
)(bt
2
2
+ ct
2
+ d) = A (9)
P =
1
3
at
3
1
+
1
3
bt
3
2
+
1
2
ct
2
2
+ dt
2
−
1
3
bt
3
1
−
1
2
ct
2
1
− dt
1
(10)
Q = bt
2
2
+ ct
2
+ d (11)
For the convenience of deriving the formula, we replace part of the polynomial in the
displacement formula with P and Q, as shown in Equations (10) and (11).
The rate of change in jerk directly affects the efficiency of these energy losses, espe-
cially during the initial impact or rapid change stages. In a vibration system, the integral
over time of the square of the jerk reflects the residual vibration energy of the system
during rapid start-stop processes. To quantitatively evaluate vibration suppression per-
formance, Equation (12) defines the residual vibration energy as the time integral of the
squared jerk. Since jerk represents the rate of change in acceleration, minimizing this index
effectively suppresses high-frequency excitation and residual oscillations during rapid
start–stop motions.
In this study, the planned velocity profile is designed to be symmetric with respect
to the mid-time instant t
3
. As a result, the jerk-related vibration energy contributed by
the second half of the motion [t
3
, t
6
] is identical to that of the first half [t
0
, t
3
]. Therefore,
for conciseness, Equation (12) evaluates the vibration energy over [t
0
, t
3
], and the total
vibration energy over the complete motion interval [t
0
, t
6
] can be obtained.
E
vib
=
Z
t
3
0
(
...
q (t))
2
dt (12)
The multi-objective optimization function is:
Min
(
F(t
1
, t
2
) = ω
1
t
2
+
30 − P
Q
+ ω
2
"
4a
2
t
1
+ 4
at
1
t
1
− t
2
2
(t
2
− t
1
)
#)
(13)
https://doi.org/10.3390/s26030829

Sensors 2026, 26, 829
7 of 21
Optimization is the process of finding the best solution to a problem among all possible
alternatives [
36
–
38
]. The Graylag Goose Optimization (GGO) algorithm, as an emerging
metaheuristic algorithm, is inspired by the intelligent behaviors of gray geese during long-
distance migration, such as efficient formation flying, cooperative resting, and dynamic
leadership. The algorithm simulates mechanisms like “leader goose switching,” “flock
following,” and “energy conservation,” enabling a finer balance between convergence
accuracy and optimization speed.
The Graylag Goose Optimization (GGO) algorithm consists of two stages: global
exploration and local optimization. Based on the constraints of the objective function,
a fitness function is defined. After setting the population size, all randomly generated
individuals enter the initial exploration group. The population is then sorted according to
fitness values, and the top N solutions in terms of fitness are defined as the exploitation
group, while the remaining poorer solutions form the exploration group. Individuals that
meet the fitness function criteria are assigned to the “exploitation group,” whereas those
that do not are given high penalty values and re-enter the exploration group to search for
solutions. The initial parameters of the population are shown in Table 3.
Table 3. Origin Parameter of graylag goose population.
Parameter Value
Population size/N 50
Maximum number of iterations/M 200
Minimum time interval/δ 0.1
First, randomly generate N arbitrary solutions. The individual position update strategy
of the Graylag Goose Optimization Algorithm is divided into two parts: global search by
the exploration group and local optimization by the exploitation group. If an individual’s
value does not meet the requirements of the fitness function, assign a high penalty value to
that individual.
Explore group global search:
Strategy 1: Move toward the global best solution X
best
.
x
new
= x
best
− A ·
|
C · x
best
− x
|
(14)
A = 2
(
1 − iter/MaxIter
)
· r
1
+ (1 − iter/MaxIter), C = 2r
2
(15)
The r
1
and r
2
is random Vector
Strategy 2: Guided by Three Random Geese.
x
new
= ω
1
x
r1
+ zω
2
(x
r2
− x
r3
) + (1 − z)ω
3
(
x − x
r1
)
(16)
Partial optimization by the development team
Strategy 1: The three-sentinel geese seek the average value, where the sentinel geese
individuals are selected from the three best solutions in the group based on fitness.
x
new
=
1
3
(
x
s1
+ x
s2
+ x
s3
)
(17)
Strategy 2: Perturbation Near the Current Optimal Solution.
x
new
= x + 0.5(1 + z)ω(x − x
best
) (18)
https://doi.org/10.3390/s26030829