IPC-4556 印制板化学镍钯浸金(ENEPIG)规范ENG.pdf - 第62页
Metallographic Cross-Ssectional Analysis A number of the non-tested solderball solder joints for each coupon were ran- domly selected for metallographic cross-sectional analysis. The purpose of the analysis was to determ…
Table A7-4 SAC305 Solderball Shear Test Results Coupon Set 1 (grams)
Table A7-5 SAC305 Solderball Shear Test Results Coupon Set 2 (grams)
January 2013 IPC-4556
51
Sample 6
2786.7
2725.4
2638.6|
2548.6
2671.8
2639.5
2530.3
2541.8
2507.2|
1611.5
2520.14|
Average
Std Dev
331.9375
Sample 16
1586.9|
2398.1
2597.7
1948.5
2306.4
1714.9
2581.2
2425.4
2225.9
2198.3333|
367.41668|
Sample 17
2208.4|
2398.2
2006.1
2583.8|
2684
1774.1
1347.6
1385.8
1869.4
1967.5
2354.4|
2604
2239.4
2057.4
25073
2059.4
2491.9
2292.8
2328.1
4709
2081.525
529.90524
Sample 18
2522.4
2450.3
2191.5
2673.8
2474.7|
2497.8
2304.3
2500.7
2221
1512.5
1425.7
2252.2455
412.21435
Sample 19
2310.1
2445.4
2413
2844.2
1687.4
2629.3
1510.9
1801.7
2756.1
1318.3
Sample 1
2532.1
1382.3
2171.64
546.8967
1461.6
2295.6
1406.8
2630|
1557.9
2790.9
1570|
2103.4|
Average
Std Dev
1973.06
557.7766
Sample 2
1412.4|
1194.4
1456.6
1425.9
2015.3
1278.7
1303.5
1556.9|
1572.6
1539.4|
1267.1
1192.4|
1355.3
1707.3
2289
1224.5
1771.9
1756.6|
1839.3|
1534.689
299.5225
Sample 3
2172.4|
2417.3|
2582.5
2599.9
2508
2798.2
1827.1
2413.5
2402.9
2369
1193.9
2570.1|
1714.9
2165.4
1887.2
1944.1
2194.2]
1426|
1627.9
1782.1
2129.83
436.0656
Sample 4
2729.9
2859.2|
2752.3|
2660.4|
2691
1842.6
2549.9
2434|
2690.9
2618.3
2124.6
2069.7|
1615.4
1709.2|
2501.6|
2334.9
1537.9
2449.1
1510|
1706.8|
Sample 5
1807
1991.8
2235.7
1982.9
2203
1653.7
2113.1
2345
2180
1899.2|
2269.385
460.6777
2041.14
213.892
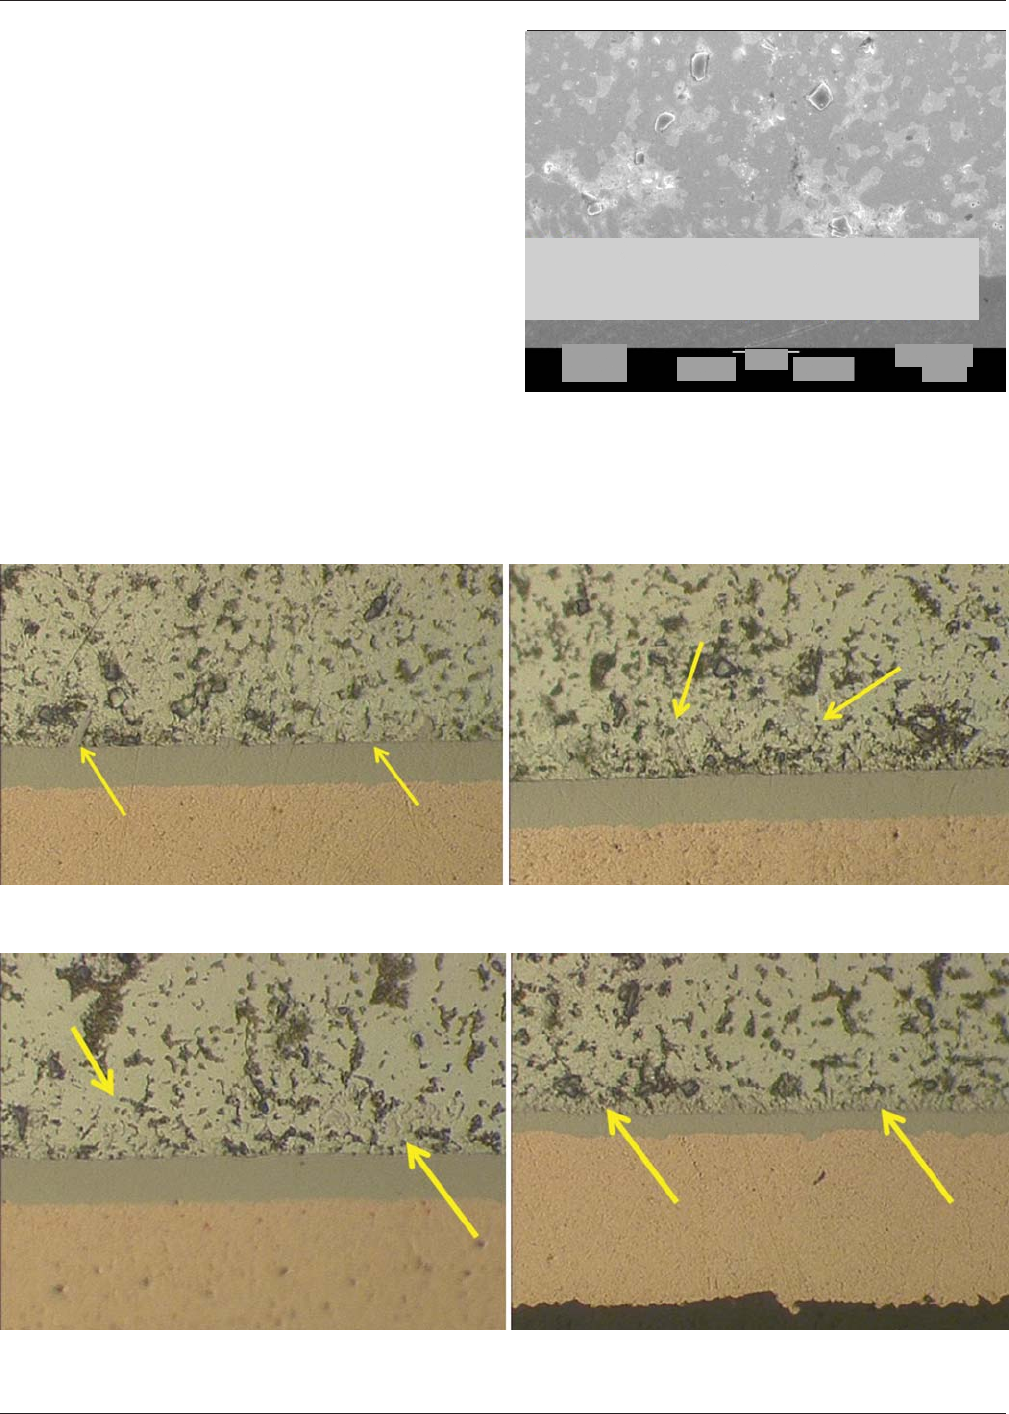
Metallographic Cross-Ssectional Analysis A number of the
non-tested solderball solder joints for each coupon were ran-
domly selected for metallographic cross-sectional analysis.
The purpose of the analysis was to determine if any of the sol-
der joints contained the palladium/tin intermetallic (IMC)
phase PdSn4, which has been shown to cause embrittlement
and degradation of solder joint integrity [1]. The PdSn
4
IMC
structure is a blocky, angular phase in the scanning electron
microscopy (SEM) image of a Sample 19 Sn63Pb37 solder
joint with arrows indicating the PdSn
4
IMC phase illustrated
in Figure A7-4. The Sn63Pb37 solder joints contained more of
the PdSn
4
IMC structure than the SAC305 solder joints. The
difference in the resulting microstructure between the solder
processes is due to the fact that the higher SAC305 reflow
temperature and greater tin composition percentage of the
SAC305 alloy allows for better distribution of the palladium
within the solder microstructure rather than forming the
PdSn4 IMC phase. The thickest palladium plating (Sample
19) also contained the most PdSn
4
IMC phase. Figure A7-5 through Figure A7-16 illustrate typical solder joint microstruc-
tures observed for each of the test coupons for both the Sn63Pb37 and SAC305 solder joints. The arrows shown in the Fig-
ures point to some of the observed PdSn4 IMC phase contained in the solder joints.
Figure A7-4 Sn63Pb37 Test Coupon 19 – 1690X Magnifica-
tion SEM View
Figure A7-5 Sn63Pb37 Test Coupons1&2–Test Coupon 1 (left view) and Test Coupon 2 (right view) are both cross-sections at 500X
magnification.
Figure A7-6 Sn63Pb37 Test Coupons3&4–Test Coupon 3 (left view) and Test Coupon 4 (right view) are both cross-sections at 500X
magnification.
IPC-4556 January 2013
52
0产17777
D:4,738×
P:1,698×
19 DEC 111
48088
18 m
15.B kV AMRAY
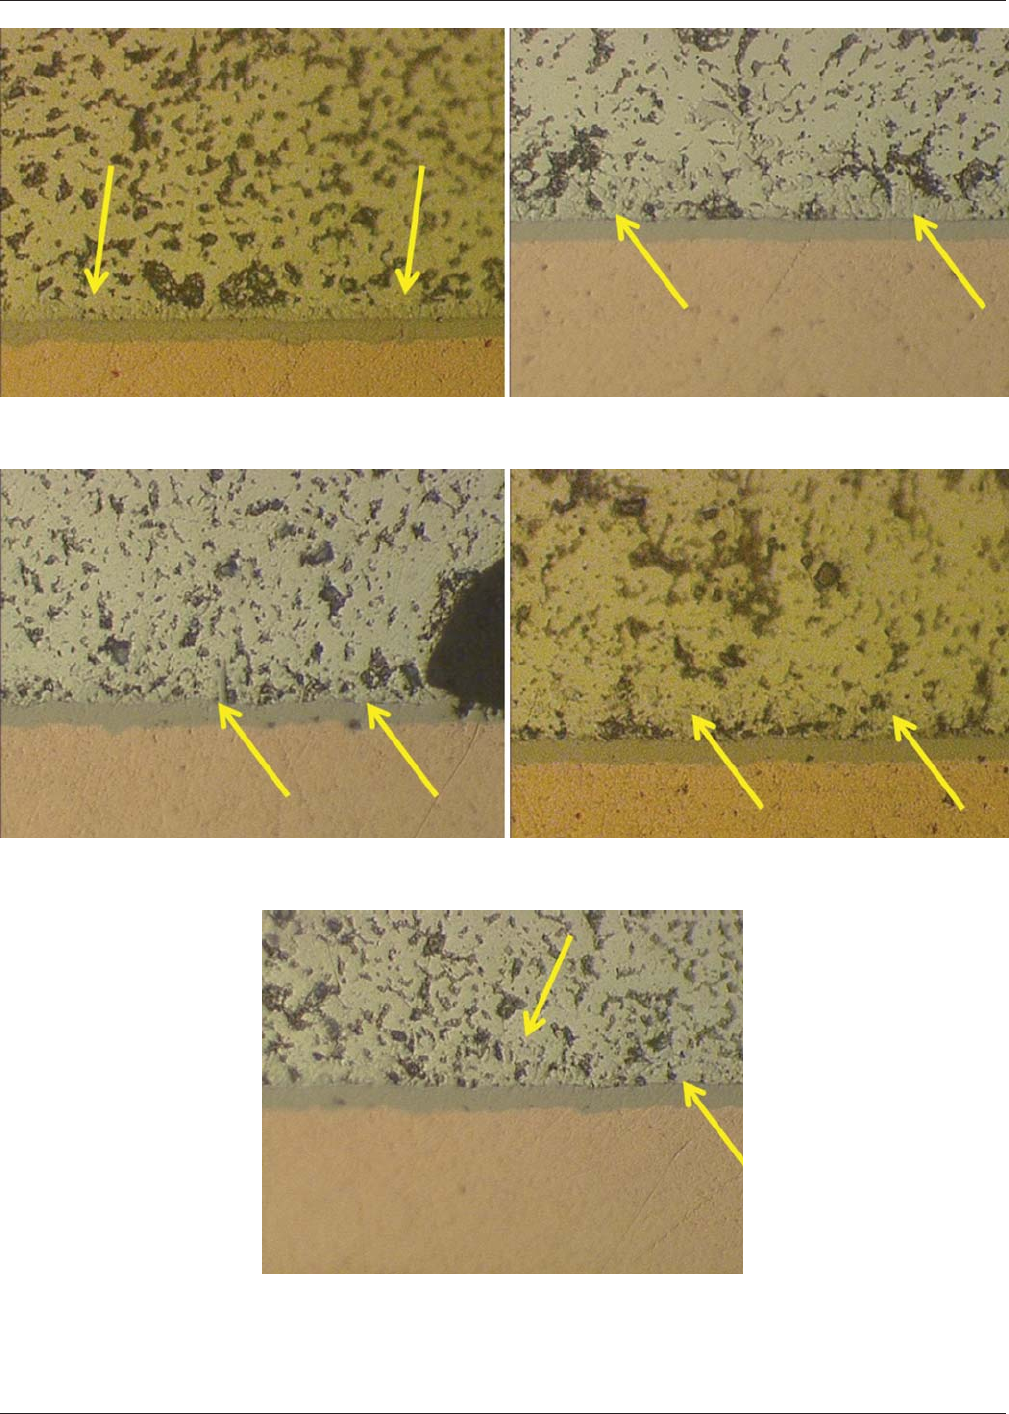
Figure A7-7 Sn63Pb37 Test Coupons5&6–Test Coupon 5 (left view) and Test Coupon 6 (right view) are both cross-sections at 500X
magnification.
Figure A7-8 Sn63Pb37 Test Coupons7&8–Test Coupon 7 (left view) and Test Coupon 8 (right view) are both cross-sections at 500X
magnification.
Figure A7-9 Sn63Pb37 Test Coupon 18 – 500X magnification
cross-section view.
January 2013 IPC-4556
53