IPC9850_Surface Mount Equipment Characterization.pdf - 第25页
IPC-9850 Official Proposal May 2001 25 Suppliers may include procedures to measure placements with the placement machine itself. This is acceptable for a particular placement machine as long as that particular machine (n…

IPC-9850
Official Proposal
May 2001
24
4.2.9 Preventative Maintenance (PM) Time
This is the amount of time required for preventative maintenance as specified by the machine supplier. This metric
will be based on the maintenance routines that are required each year in order to keep the machine in a warranted
condition and how long those routines take for a 6000 hour period.
Calculation Method Multiply the amount of time required for each PM procedure by the number of times it is
required in 6000 hours and add these up for a grand total.
4.2.10 Mispick Rate (in PPM) This is the frequency with which a component was not picked or picked incorrectly,
even if recovery handled the problem. Mispicks include both pickup failures and vision failures, but excludes
components exhaust.
Pickup defects will be handled in a manner similar to placement defects. Pickup defects are categorized as vacuum
failures or vision failures. While many suppliers have various auto-recovery routines that prevent a pickup defect
from resulting in a missing component placement defect, this type of defect has still been deemed worthy of tracking
and reporting due to its impact on the assembly process. Pickup defects cause a reduction in net CPH and the
unnecessary rejection and scrapping of good parts.
The number of mispicks that occur during the 4400 part placements made to determine placement defect rate will be
recorded on Form IPC-9850-F2. The number of pickup defects made during this process for the past 20 machines
will be reported, from which a point estimate for pickup defects in PPM can be made.
Measurement Procedure Clear the Mispick counters in the machine. Empty the reject bin. Record the relative
humidity. Run the attribute defect test (place 4,400 components). Record the vacuum failure, and vision failure
counter values. Examine the components found in the reject bin and count the defective components.
Calculation Method The total pickup attempts minus total number of placements minus the number of defective
components divided by total pickup attempts minus defective components, multiplied by one million to obtain ppm.
Mispick Rate =1,000,000 * (Total Pickup Attempts)- (Total Number of Placements) –(Number of Defective Components)
(Total Pickup Attempts) –(Number of Defective Components)
4.3 Reporting Sites This is the number of machine sites included in the reliability metric calculations.
4.3.1 Number of Machines This is the number of individual machines included in the reliability metric calculations.
4.3.2 Total Number of Placements This is the number of individual machine placements included in the reliability
metric calculations.
4.3.3 Total Pickup Attempts This is the number of times the nozzles attempted to pick components.
5 Measurement Capability Verification –Form IPC-9850-F3
Form IPC-9850-F3 functions as a tool for demonstrating the measurement capability of the measurement equipment
used to generate the parameter values for the Placement Performance Metric (form IPC-9850-F1). The measurement
capability information presented on the form shall be gathered and reported according to this standard, and shall
reflect the performance of the measurement equipment used in the machine performance analysis. The reported
information should be acquired no more than 90 days prior to the machine performance study.
The parameters of this metric shall evaluate the measurement system’s ability to accurately measure the test
vehicles produced during the machine performance evaluation analysis in a repeatable and reproducible manner.
This evaluation shall be made for each component type and yields results about the measurement capabilities of the
CMM along the same axes as reported by the placement performance metric. exceed The specification limits
reported in the performance reporting form shall never be smaller than the larger of the GR&R and accuracy CMM
specification limits per component type. Suppliers that add additional component types to the Placement
Performance Metric shall also report their measurement capabilities for the same component types.

IPC-9850
Official Proposal
May 2001
25
Suppliers may include procedures to measure placements with the placement machine itself. This is acceptable for a
particular placement machine as long as that particular machine (not just a sample machine from that particular
model type) passes the gauge requirements laid out in this section which determine whether or not its measurement
capability is acceptable.
5.1 Gauge Repeatability and Reproducibility Capability
This verification procedure determines the CMM's ability to repeat and reproduce the component location and
rotation mounted onto the PVP. This evaluation shall be made for each component type.
While multiple GR&R methodologies are available, this standard uses the traditional average-range method and
recommends the use of the spreadsheet discussed in Appendix H. The results are reported in terms of the upper and
lower specification limits that yield a precision-to-tolerance ratio of better than 25%.
Although a precision-to-tolerance (P/T) ratio of less than 20% is usually considered acceptable, 25% is utilized in
this standard to accommodate existing CMM machines. However this reduced P/T ratio specification if somewhat
offset by the fact that the analysis is performed using a more stringent requirement of six sigma (+/-3 sigma or
99.7%) versus the customary value of 5.15 sigma (+/- 2.575 sigma or 99%) recommended by the Automotive
Industry Action Group (AIAG).
Measurement Procedure Obtain a single glass verification panel with a specific part type populated according to the
procedures described in the machine placement performance metric, Section 3. Measure the populated PVP three
consecutive times. The PVP is to be completely removed and replaced from the CMM for each run. Only 36
components need to be measured for each run. Appendix F outlines the component locations for the specific
component panel layout. After the three measurements are obtained the CMM must be shutdown and restarted.
The same PVP plate shall be subjected to two additional measurement cycles (two more sets of 3 measurements)
using an identical procedure. At least two operators should be utilized to obtain the three sets of data. The entire
GR&R evaluation shall be performed in a time period no longer than it takes to perform the measurement of the
consecutive four PVPs for the placement performance evaluation.
For the SOIC-16 and 1608C components, the center of the component shall be measured using the lead outline and
component outline, respectively. The same measurement procedure applies to the PVP populated with slugs.
However, since the CMM utilizes the fiducial markings on all glass slugs, regardless of the specific component
image, it is only necessary to evaluate the CMM’s ability to measure the slugs using the fiducial markings and not
individually for the QFP and BGA component types. Appendix D provides suggested methods for measurement
methods.
5.2 Accuracy Capability
This verification procedure determines the Optical CMM's ability to accurately measure the placement of
components on the glass verification panel. This is accomplished by evaluating the CMM’s ability to measure the
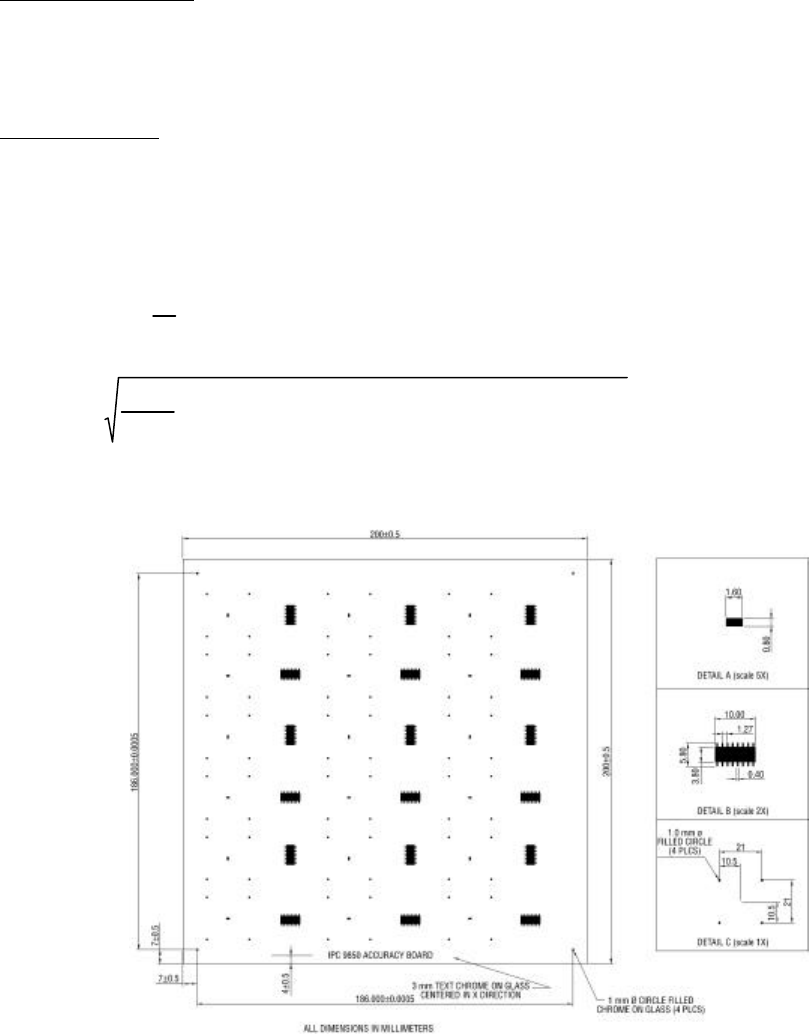
NIST certified glass verification panel specified in Figure 5-1. This accuracy verification panel (AVP) was designed
to evaluate the CMM’s ability to measure three component types required for compliance with Section 3.
To evaluate the measurement capabilities of the 1608C and SOIC-16 components, their images have been etched
onto the AVP. Since slugs are utilized for the QFP and BGA components, only slug fiducials marking are etched
onto the AVP. Some of the etched images are translated and rotated from their specified CAD location, in order to
test the CMM’s ability to measure components with measurement error. Some of the 1608C and SOIC-16
component images on the AVP are translated in a range of + 50 micrometers, and rotated in a range of +3º range.
Some of the four fiducial image sets will be translated in a range of + 25 micrometers, and rotated in a range of +1º
range. The ‘CMM Accuracy Eval.xls’ file provides an instruction guide and a sample CMM accuracy evaluation
spreadsheet.
This methodology is implemented using a measurement program on the CMM, which searches for the components
on the glass panel at their CAD locations. These CAD locations are the centers of the components as if no
translation or rotations were applied to the images on the glass panel. The CAD locations of the images can be found
in Appendix F. The CMM measurement results are compared to the locations and rotations of the component images
IPC-9850
Official Proposal
May 2001
26
provided by the NIST certification for the unique glass panel utilized. The closer the CMM measurement values are
to the certified locations the better the measurement capability of the CMM.
The results are reported in terms of the upper and lower specification limits that yield process capability indexes
equal to 2.0. See Appendix B for discussion.
Measurement Procedure Measure the center location and orientation of the component images on the certified
accuracy verification panel a single time. Measure the center location and orientation of each group of four fiducials
that represent the slug component types. Use the same image analysis procedures that are utilized for the Placement
Performance Metric evaluation. Appendix D provides a guide for the proper methods of measuring the center
locations of the components.
Calculation Method Subtract the CMM measured image locations from the NIST certified image locations along the
X, Y and θ axes, for each of the 1608C, SOIC-16, and slug features. This provides a distribution of the measurement
errors of the CMM. Use these distributions to calculate the average and standard deviation for each axis. Calculate
the process specification limits for each axis using the following equations, when Cpk = 2.0. See Appendix B for a
discussion of these equations.
SL=3*SD
Error
*Cpk+|Avg
Error
|
where Avg
Error
,
∑
=
−=
18
1
)(
18
1
i
ii
ocationCertifiedLcationMeasuredLo
and SD
Error
,
2
18
1
)(
118
1
i
i
i
ocationCertifiedLcationMeasuredLo −
−
∑
=
,
Figure 5-1 Accuracy Verification Panel