IPC9850_Surface Mount Equipment Characterization.pdf - 第43页
IPC-9850 Official Proposal May 2001 43 Appendix D Suggested Methodologies for Measuring Components using an Optical CMM D-1 Introduction In the IPC-9850 standard the following components are used to prove the accuracy of…

IPC-9850
Official Proposal
May 2001
42
10. The glass plate should be re-measured at some time period after the first measurement. It is recommended that
the glass plate be re-measured for comparison at worst case intervals at which are expected by the user. The worst
case scenario would be the longest period at which would be expected to elapse between placement and
measurement. As a minimum, two hours should elapse between the first measurement and re-measurement.
II. Other re-measurements can be taken after simulating movement conditions or temperature changes.
12. Some adhesives are capable of being re-used. If this is planned for the application, Ns same series of tests should
be repeated for each re-use of the adhesive to establish the frequency at which the adhesive should be re-applied.
The obvious best case would be to re-apply after each test. As a reminder, poor adhesive will only worsen end
results.
13. Measurements should be compared from the initial measurement to all subsequent measurements to look for
changes or movement of parts after placement.
14. For the adhesive to be acceptable, the maximum movement that can be observed between the initial
measurement and re-measurements should be a maximum of two (2) microns.
C-5 Results / Summary
Poor adhesive, improper application of adhesive, poor measurement re-use of adhesive and many other factors affect
test results for machine capability measurement. By following these guidelines, only better results can be obtained.
Failure to do so may degrade the perceived performance of a placement machine.
IPC-9850
Official Proposal
May 2001
43
Appendix D
Suggested Methodologies for Measuring Components using an Optical CMM
D-1 Introduction
In the IPC-9850 standard the following components are used to prove the accuracy of placement machines:
• Glass QFP-100, QFP-208
• Glass BGA-228
• Real 1608C
• Real SOIC16
However it is not described how those components must be measured on the CMM machine. The center of the
components can be constructed in different ways. Every method has its own accuracy.
This report investigates the different methods to measure the components and the sensitivity of the estimate of the
center location of the component to measuring and component variances.
Finally a recommendation is given how the components should be measured.
D-2 Slugs (glass components)
The glass QFP-100, QFP-208 and BGA-228 are provided with 4 fiducials, one at each corner of the component.
There are several ways to construct the center and the angle of the component using 2 or all 4 fiducials.
D-2.1 Methods to measure the X- and Y-location of the slug
The different methods to measure the center location of the component are described below.
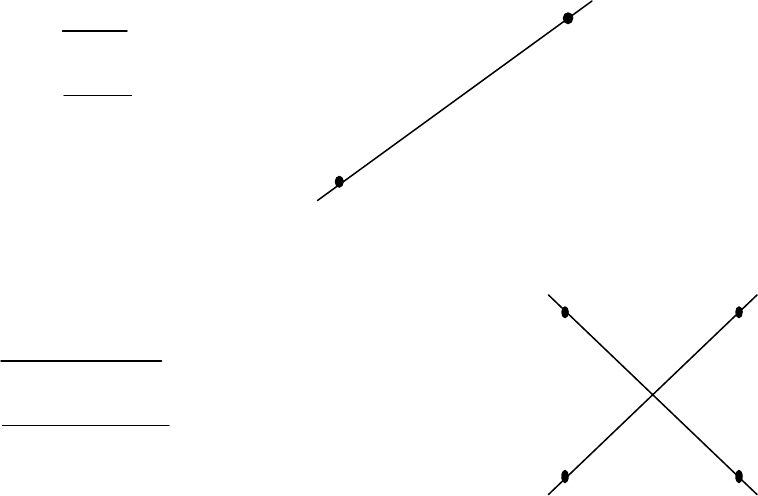
D-2.1.1 Using 2 fiducials
Measure two diagonal fiducials and take the average x and y
D-2.1.2 Using 4 fiducials
Method 1
Measure all fiducials and take the average x and y:
4
4
4321
4321
yyyy
y
xxxx
x
component
component
+++
=
+++
=
Method 2
Take the intersection point of two diagonal lines through the fiducials
D-2.2 Methods to measure the angle of the slug
2
2
21
21
yy
y
xx
x
component
component
+
=
+
=
IPC-9850
Official Proposal
May 2001
44
The different methods to measure the angle of the component are described below.
D-2.2.1 Using 2 diagonal fiducials
Take the angle of the line through the 2 diagonal fiducials and subtract the nominal angle (in this case the
component is square so the nominal angle is 45 degrees).
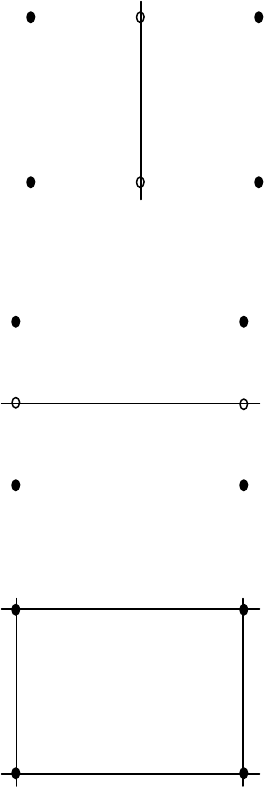
D-2.2.2 Using 4 fiducials
Method 1
Take the average of the angle of the two diagonal lines through the fiducials
Method 2
Take the angle of the line through the vertical midpoints minus 90 degrees:
Method 3
Take the angle of the line through the horizontal midpoints:
Method 4
Take the average angle of all “sides” of the component:
Method 5: Take the average of the angles of method 2 and 3
D-2.3 Simulation
By simulating measurement errors on the X- and Y-locations of the fiducials, the sensitivity of the methods above is
determined.
The measurement errors on the fiducials are assumed to be distributed with a standard deviation of 0.0005 mm.
Then 1000 measurements are simulated (using MS Excel). With those measurements, the x, y, and theta locations of