IPC9850_Surface Mount Equipment Characterization.pdf - 第39页
IPC-9850 Official Proposal May 2001 39 Appendix A: Capability Indexes. Cp can be computed when a process specification limit is stated : s 6 SpecLimit Lower imit UpperSpecL ⋅ − = Cp For a process with target of zero, the…
IPC-9850
Official Proposal
May 2001
38
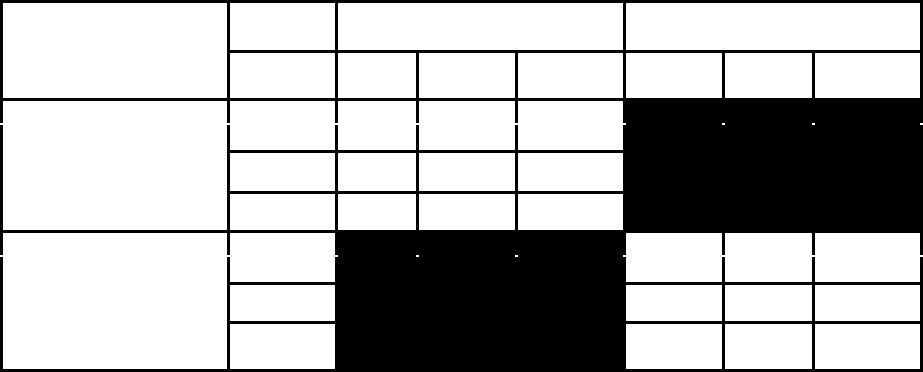
CMM Capability to Evaluate Metric Parameters
IPC-9850-F3
Machine
Axis
Repeatability & Reproducibility,
GR&R Limits
1
Accuracy, Spec. Limits
1
Date of GR&R Study
__________
Glass
Slugs
2
1608 Cap SOIC-16
Glass
Slugs
2
1608
Cap
SOIC-16
X,
micrometers
Y,
micrometers
Placement Verification
Glass Panel
θ, deg
X,
micrometers
Y,
micrometers
Measurement Capability
Glass Panel
θ, deg
Note 1: To be valid, reported Spec. Limits in form IPC-9850-F1 must not exceed worse case Spec. Limits of the CMM
capability per component type.
Note 2: Since the CMM utilizes the fiducial markings on all glass slugs, regardless of the specific component image, it is only
necessary to evaluate the CMM’s ability to measure the slugs using the fiducial markings.
Form 9850-F3 CMM Capability, issue date
IPC-9850
Official Proposal
May 2001
39
Appendix A: Capability Indexes.
Cp can be computed when a process specification limit is stated:
s
6
SpecLimitLower imitUpperSpecL
⋅
−
=Cp
For a process with target of zero, the upper and lower specs have the same magnitude, the equation can be rewritten
as:
s
3
imitUpperSpecL
⋅
=Cp
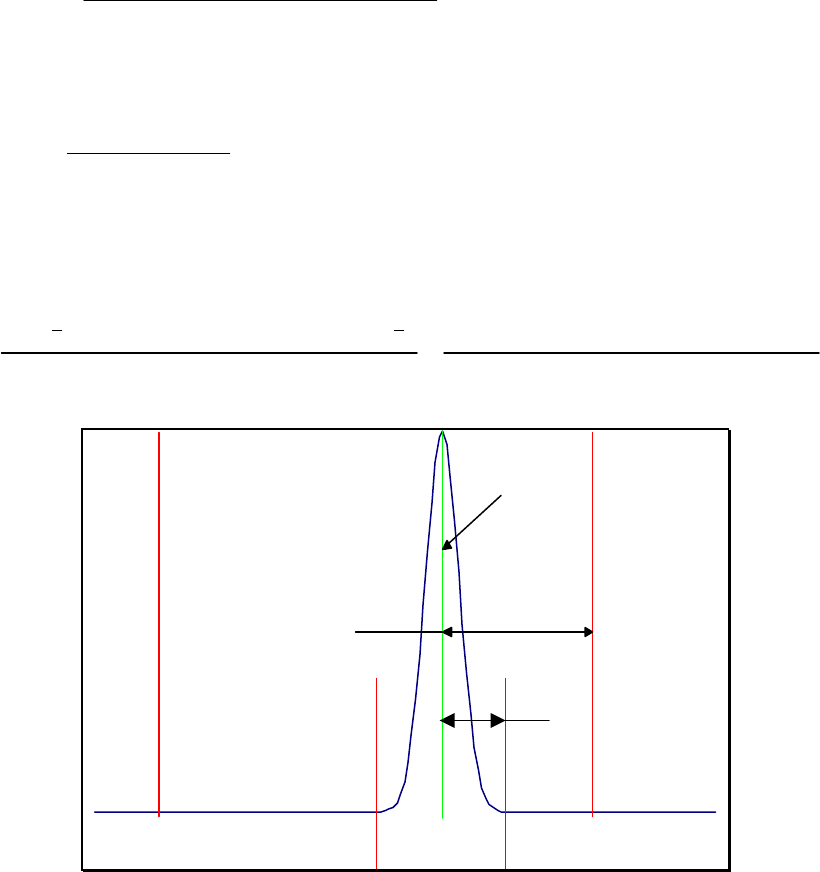
Cpk quantifies how many sets of 3 standard deviations lie (fit) between the process mean and the closest
specification limit. Cpk is intended for use with distributions that are normal or near normal, and is valuable because
it can be used to quantify the number of placements per million that will occur outside of the specification limits due
to the lack of accuracy or repeatability of the placement machine.
(
)
Cpk
min x Lower Spec Limit , Upper Spec Limit x
3 s
Distance between the mean and the nearest spec
3 s
=
− −
⋅
=
⋅
where s = the standard deviation of the sample.
-4
-
3.
75
-
3.
-
3.
25
-3
-
2.
75
-
2.
-
2.
25
-2
-
1.
75
-
1.
-
1.
25
-1
-
0.
75
-
0.
-
0.
25
-
1.
42
1E
-
0.
25
0.
5
0.
75
1
1.
25
1.
5
1.
75
2
2.
25
2.
5
2.
75
3
3.
25
3.
5
3.
75
4
Mean
LSL
USL
Cpk Numerator
Cpk Denominator
Figure A-1, title
For a centered process the Specification Limits (SL) are obtained by using the following equation, where SD is the
standard deviation and Avg is the average of the data set.
IPC-9850
Official Proposal
May 2001
40
Appendix B: Specification Limits for Cpk Values
Definitions:
Process Spread = Standard Deviation of Data Set = SD
Process Mean Average of Data Set = Avg
Process Target = Target
Upper Specification Limit =USL
Lower Specification Limit =LSL
For a centered process Target =0 and thus USL=LSL
Define Specification Limit for a Centered Process = SL = USL=-1*LSL.
Define Specification Width SW = USL-LSL, thus for a Centered Process
SW=SL-(-1*SL)= 2*SL
Define a General Process Capability Index Cp and Cpk as
Cp= SW/(6*SD)
and
Cpk=Cp*(1-K)
Where,
K= (Target-Avg)/(SW/2)
For a centered Process
Cp=2*SL/(6*SD)=SL/(3*SD)
Cpk=(SL/(3*SD))*(1-K) Where K=(0-Avg)/(2*SL/2))=-Avg/SL
Substituting for Cp and K in the Cpk expression yields
Cpk=(SL/(3*SD))*(1--Avg/SL)=SL/(3*SD)+SL*Avg/(3*SD*SL)=SL/(3*SD)+Avg/(3*SD)
Solving for the SL in the Cpk expression yields
SL=3*SD*(Cpk-Avg/(3*SD))=3*SD*Cpk+|Avg|
Example:
X Average=-9.7 micrometers
X Std Dev = 15.9 micrometers
Y Average = 7.6 micrometers
Y Std Dev = 21.7 micrometers
Thus for a Cpk of 2 the SL for the X-axis is
SL=3*15.9*2+|9.7|=105 micrometers
And the SL for the Y-axis is 122 micrometers.