DEK高级培训资料.pdf - 第208页
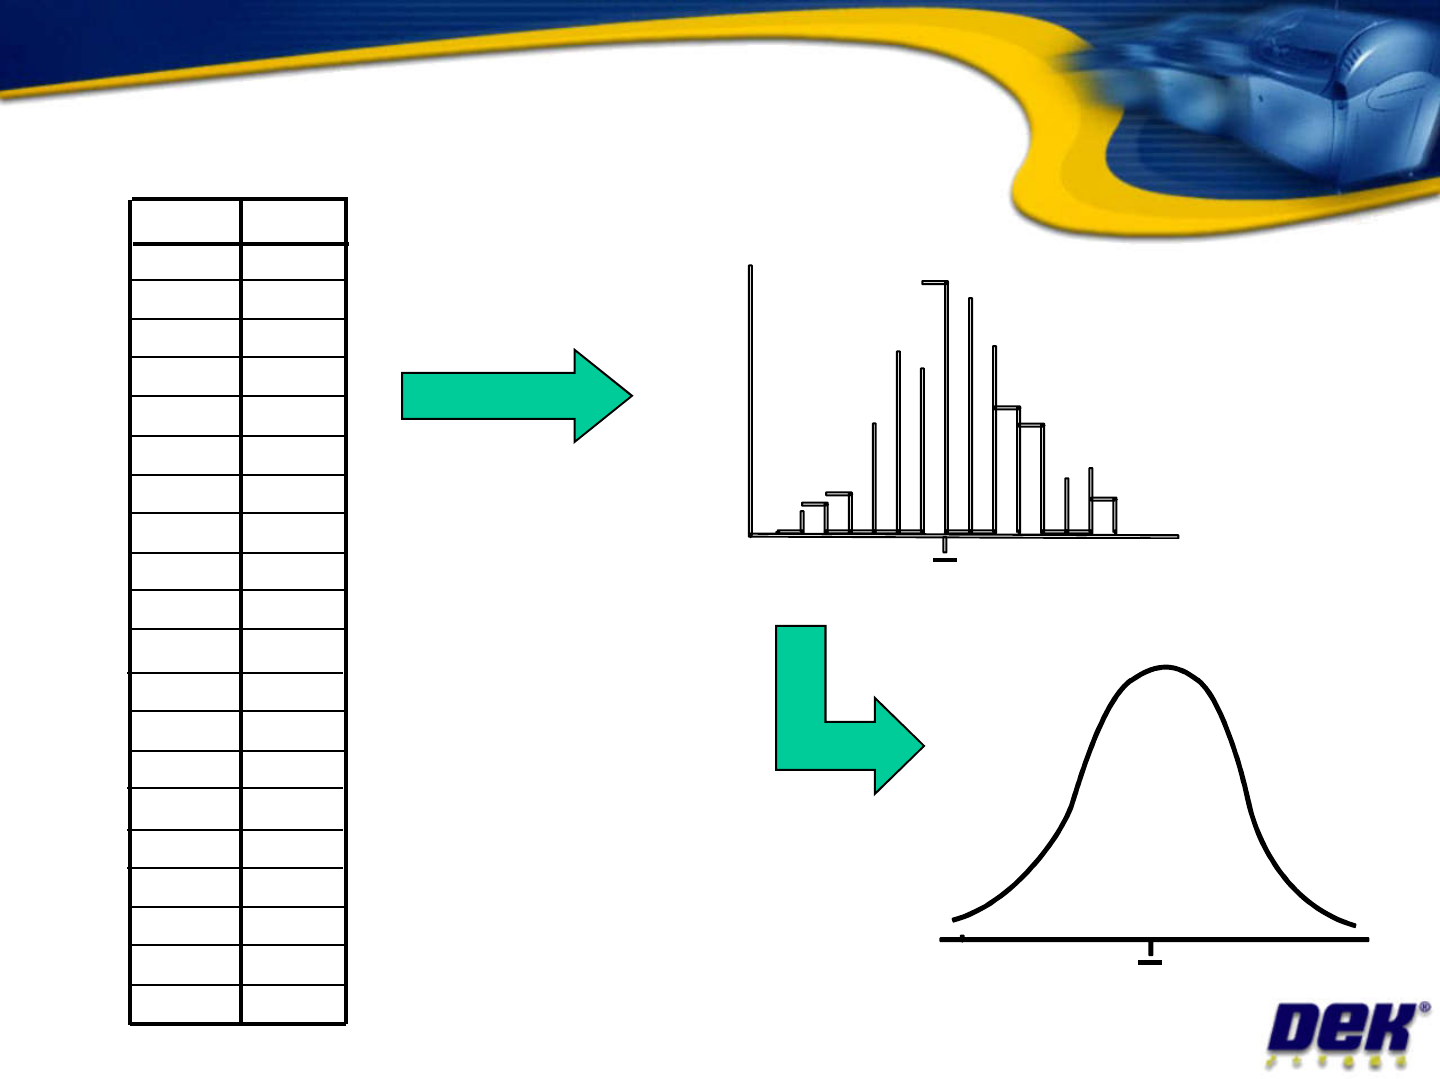
X Y -0.0055 -0.0055 -0.0024 0.0077 -0.0013 -0.0105 -0.0025 0.0043 -0.0008 -0.0071 -0.0002 0.0064 -0.0028 -0.0068 -0.0019 0.0065 Normal Distrib ution Plot the data o n a graph Issue 2: July 2007 x x -0.0070 -0.0112 0.0097…

σ
= Standard Deviation
σ (Greek lower case Sigma) is used to symbolize the deviation from the
mean (average) of any distribution
σ indicates how well a process is performing. A low σ value indicates that
most of the values are close to the target
It is mathematically proven that if the sampled data is ‘normally distributed’
Issue 2: July 2007
It is mathematically proven that if the sampled data is ‘normally distributed’
then
• 68% certainty of all data lies between +/– 1 σ
• 95% certainty of all data lies between +/– 2 σ
• 99.7% certainty of all data lies between +/– 3 σ
• 99.9999998% certainty of all data lies between +/– 6 σ
How can this be? ….
X Y
-0.0055
-0.0055
-0.0024
0.0077
-0.0013
-0.0105
-0.0025
0.0043
-0.0008
-0.0071
-0.0002
0.0064
-0.0028
-0.0068
-0.0019
0.0065
Normal Distribution
Plot the data on
a graph
Issue 2: July 2007
x
x
-0.0070
-0.0112
0.0097
-0.0023
-0.0087
0.0084
-0.0081
0.0075
-0.0102
-0.0077
-0.0013
-0.0019
0.0065
-0.0036
0.0015
0.0053
0.0005
-0.0019
-0.0049
-0.0030
-0.0022
-0.0038
-0.0006
-0.0040
-0.0004
0.0039
a graph
As more data is
added - this shape
starts to appear
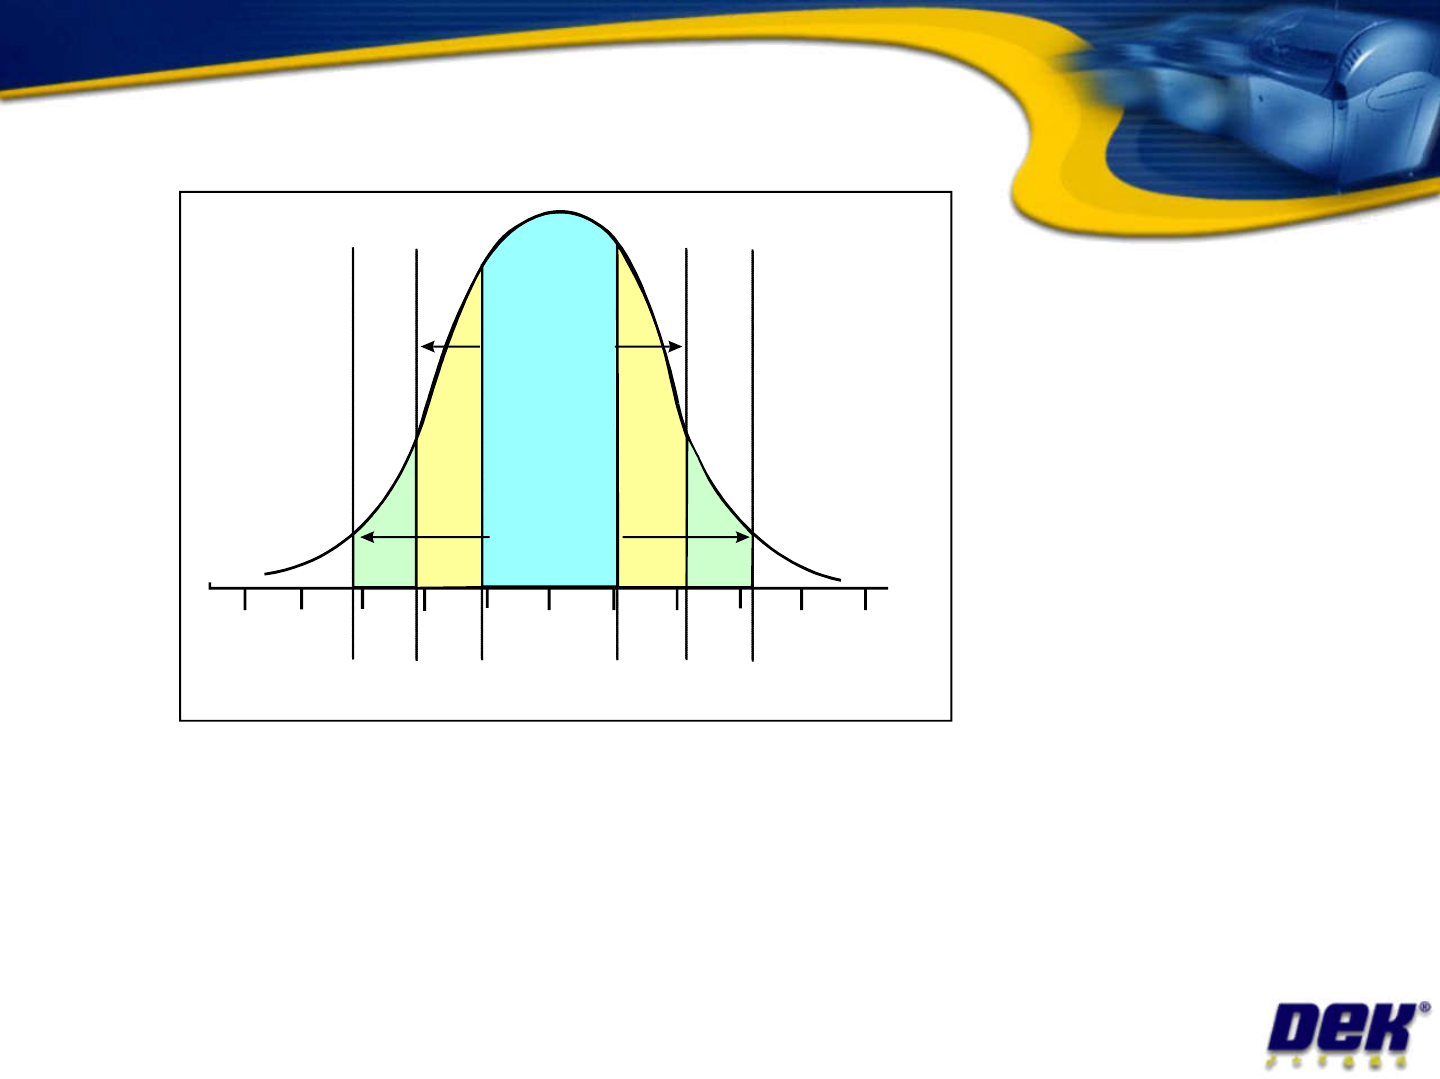
68%
95%
99.7%
Normal Distribution Curve
Issue 2: July 2007
99.7%
3 32 21
1
0
• Most organisations use +/- 3 σ as the sample size
• This is referred to as the ‘Process Width’
• We can now use this value to calculate the
accuracy and repeatability of a process