00197496-01_UM_SiClusterMultiline_DE_EN.pdf - 第161页
How to Perform Multiline Clustering 5.6.2 Results of the Job Optimization Cluster Job Op timization Results SIPLACE SiCluster Multiline SIPLACE SiCluster Multiline 161 5.6.2 5 . 6 . 2 R e s u lt s o f t h e J o b O p t i…

How to Perform Multiline Clustering
Cluster Job Optimization Results 5.6.1 Results of the Cluster Job Optimization - Line KPIs
160 SIPLACE SiCluster Multiline SIPLACE SiCluster Multiline
(6) Display: Gathering the results for all jobs
Cycle Time[s] Shows the time needed to place the boards in the recipes for this cluster job
(without taking into account the number of boards).
Ideal Cycle Time [s] Shows the time needed to place the boards in the recipes for this cluster job.
The ideal cycle time for each recipe is added together (without taking into ac-
count the number of boards).
Cycle time/ideal cycle
time [%]
The quotient specifies by which percentage the cycle time deviates from the
ideal cycle time of the cluster job. This value enables you to estimate the pro-
duction time loss caused by formation of a family setup for this cluster job.
Parameter Description
Jobs Shows the number of all jobs in the multi cluster job.
Recipes Shows the number of all recipes in the multi cluster job.
Quantity Shows the total number of all boards in all recipes in the cluster job.
Production Time
[h:m:s]
Shows the calculated production time needed to produce all jobs in the cluster
job.
Ideal production time
[h:m:s]
Shows the calculated ideal production time for all jobs in the cluster job. The
ideal cycle time for each recipe is multiplied by the number of boards.
Effective production
time [h:m:s]
This shows the calculated effective production time needed to produce all jobs
in the cluster job. The recipe cycle time defined in the SiCluster parameters is
taken into account. This means that this value is taken into account for each
recipe which has a lower cycle time that the minimum recipe cycle time.
Ideal effective produc-
tion time [h:m:s]
Shows the calculated ideal effective production time for all jobs in the cluster
job.
The minimum recipe cycle time specified at Optimization Parameters => Clus-
ter Parameters will be taken into account. This means that this value is taken
into account for each recipe which has a lower ideal cycle time than the mini-
mum recipe cycle time.
Cycle Time[s] This shows the time needed to place the recipes for all jobs in this cluster job
(without taking into account the number of boards).
Ideal Cycle Time [s] This shows the time needed to place the recipes for all jobs in this cluster job.
The ideal cycle time for each recipe is added together (without taking into ac-
count the number of boards).
Cycle time/ideal cycle
time [%]
The quotient specifies by which percentage the cycle time deviates from the
ideal cycle time of the cluster job. This value enables you to estimate the pro-
duction time loss caused by formation of a family setup for this cluster job.
Parameter Description
How to Perform Multiline Clustering
5.6.2 Results of the Job Optimization Cluster Job Optimization Results
SIPLACE SiCluster Multiline SIPLACE SiCluster Multiline 161
5.6.2
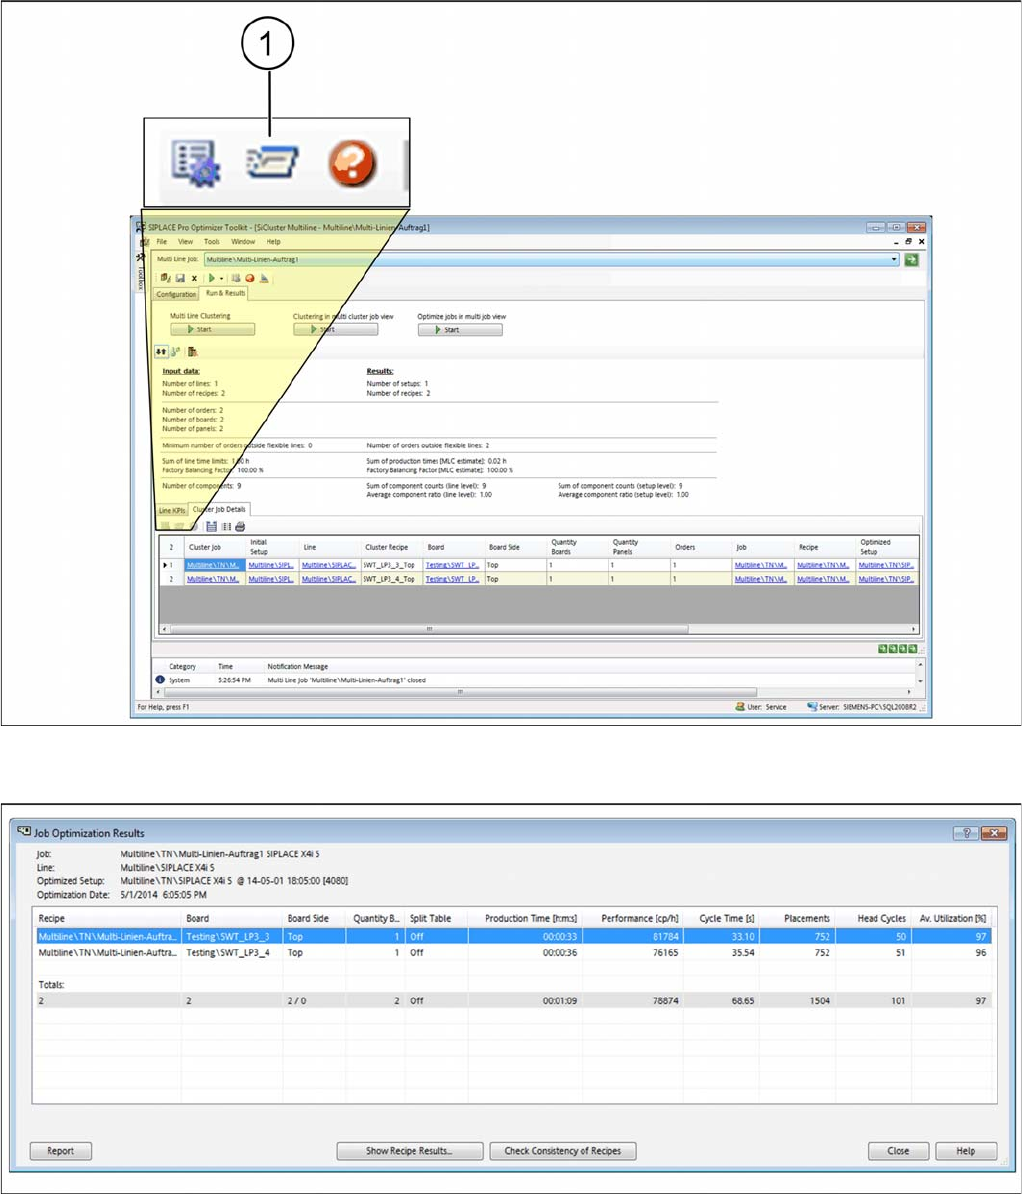
5.6.2 Results of the Job Optimization
Results of the Job Optimization
► Go to Run & Results and select the Cluster Job Details tab.
► Mark a job in the table and select the icon (1).
Tab: cluster job detail - show job optimization results
⇨ The Job - Optimization Results dialog box will open.
Dialog box: job - optimization results
⇨ The calculated optimization results for the selected job will be shown.

How to Perform Multiline Clustering
Cluster Job Optimization Results 5.6.2 Results of the Job Optimization
162 SIPLACE SiCluster Multiline SIPLACE SiCluster Multiline
Display:
Table:
Buttons:
Parameter Description
Job Shows the path and the name of the job.
Line Shows the path and the name of the line.
Optimized Setup Shows the path and the name of the setup generated during optimization (op-
timized setup).
Optimization Date Shows the date on which the optimization was run.
Parameter Description
Recipe Shows the path and the name of all recipes in the job.
Board Shows the name of the board for this recipe.
Board side Shows the board side (top/bottom).
Number of Boards Shows the number of boards to be produced.
Split Table Shows whether the table is split (split table mode).
Production Time
[h:m:s]
Shows the time calculated in which this recipe can be produced.
Performance [CPH] Shows the components placed for this recipe per hour.
Cycle Time[s] Shows the time needed to place this board.
Placements Shows the number of placement performed for this recipe.
Head Cycles Shows the number of head cycles for this board. A head cycle is the process
during which the placement head is picked up once and then placed.
Average utilization Shows the average line utilization during production of this board.
Totals The total amount is shown for the individual parameters of the recipes shown.
For example, the number of placement positions for all recipes in this job is cal-
culated and shown.
Exception: the average value for all recipes in this cluster job is calculated and
shown for the parameters Performance and Average Utilization.
The top and bottom sides of the board (X/Y) are shown. The first item is the
number of top sides and the second item is the number of bottom sides.
Button Description
Report You will see the results in the Report Manager, from where the report can be
printed.
Show Recipe
Results…
You will be shown the optimization results for the individual recipes and the
nozzle configuration.
NOTICE!
See also the SIPLACE Pro Online Help.
Check Consistency of
Recipes
Check whether the results shown are still up to date (consistent). This means,
whether data (components, nozzles etc.) have been changed since the last op-
timization run, in which case the results shown will no longer match the current
data. During the check, a notification will be issued as soon as the first incon-
sistency is found. The data can be checked and reoptimized using this notifi-
cation.