s25061872.pdf - 第13页
Sensors 2025 , 25 , 1872 13 of 24 but also provides theoretical support for the stable performance of the algorithm in un- known scenarios. 2.4.5. ISO Algorithm Steps The flow chart of the ISO algorithm, which illustrates…

Sensors 2025, 25, 1872
12 of 24
commonly used in machine learning, which is known as Bayesian optimization. The
Gaussian process mainly includes Gaussian process regression and an acquisition function.
First, it establishes prior knowledge of the global behavior of the objective function
through a Gaussian process. The mean vector and covariance matrix involved in the
prior distribution are shown in Equations (23) and (24). Subsequently, using the observed
objective function to obtain values at different input points, this prior knowledge is up-
dated to form a posterior distribution. The posterior mean and variance are given by
Equations (25) and (26).
Then, the improved collection function is expected to consider
the current best observations and the posterior distribution of the Gaussian process to
determine the next evaluation point. The collection function used in this study is expected
to improve equation shown in (27). In short, this method of guiding the search based on
existing knowledge can avoid many useless attempts.
µ
0
=
[
µ
0
(x
1
), . . . , µ
0
(x
k
)
]
T
(23)
∑
0
=
∑
0
(x
1
, x
1
) ···
∑
0
(x
1
, x
k
)
.
.
.
.
.
.
.
.
.
∑
0
(x
k
, x
1
) ···
∑
0
(x
k
, x
k
)
(24)
We assume that the above expression follows a multi-variate normal distribution,
where
µ
0
(x) represents the mean function.
∑
0
(x,x’) represents the kernel function, also
known as the covariance function, which describes the similarity between points x and x’
in the input space.
µ
n
(x) = µ
0
(x) +
∑
0
(x, x
1
: n) ×(K
x
1
:n,x
1
:n
+ σ
2
I)
−1
×( f (x
1
: n) −µ
0
(x
1
: n)) (25)
σ
2
n
(x) =
∑
0
(x, x) −
∑
0
(x, x
1
: n) ×(K
x
1
:n,x
1
:n
+ σ
2
I)
−1
×
∑
0
(x
1
, n : x) (26)
EI(x) = E
[
max
(
f (x) − f
∗
, 0
)]
(27)
where K
x
1:n,x1:n
is the kernel matrix.
σ
2
is the noise variance. f (x
1
:n) is the observed vector.
f * = max
i
= 1, . . . n is the currently observed best target value. f (x
i
) is the function value.
This study uses the ‘bayesopt’ function in MATLAB 2022B, which is an easy to use
and flexible Bayesian optimization tool. With the help of this tool, three key threshold
parameters (food threshold, temperature threshold and mating threshold) that affect the
balance between exploration and development in SO algorithm are mainly optimized. The
original parameter settings are 0.25, 0.6, and 0.6, respectively. Under an integrated Bayesian
optimization framework, they are redefined as three adjustable variables: threshold
1
,
threshold
2
, and threshold
3
. The construction of the parameter space is based on the original
thresholds, extending
±
0.2 on both sides, ensuring the validity of the parameters while
avoiding the computational burden caused by an overly large search space. Consider-
ing the characteristics of the low-dimensional parameter space, a Bayesian optimization
configuration with a maximum of 10 iterations is adopted in this study, which not only
guarantees optimization efficiency but also effectively saves computational resources.
The method establishes a cooperative mechanism between Bayesian optimization
framework based on Gaussian process and SO objective function, and realizes intelligent
optimization of optimal threshold combinations through parameter search strategy guided
by this model. To improve parameter generalization, K-fold cross-validation is employed
for robustness assessment. This approach partitions the dataset into K subsets, analyzing
performance variations across these subsets to effectively prevent overfitting and guide
optimization toward parameter configurations with enhanced generalization capabilities.
This safeguard mechanism not only enhances the reliability of parameter optimization
Sensors 2025, 25, 1872
13 of 24
but also provides theoretical support for the stable performance of the algorithm in un-
known scenarios.
2.4.5. ISO Algorithm Steps
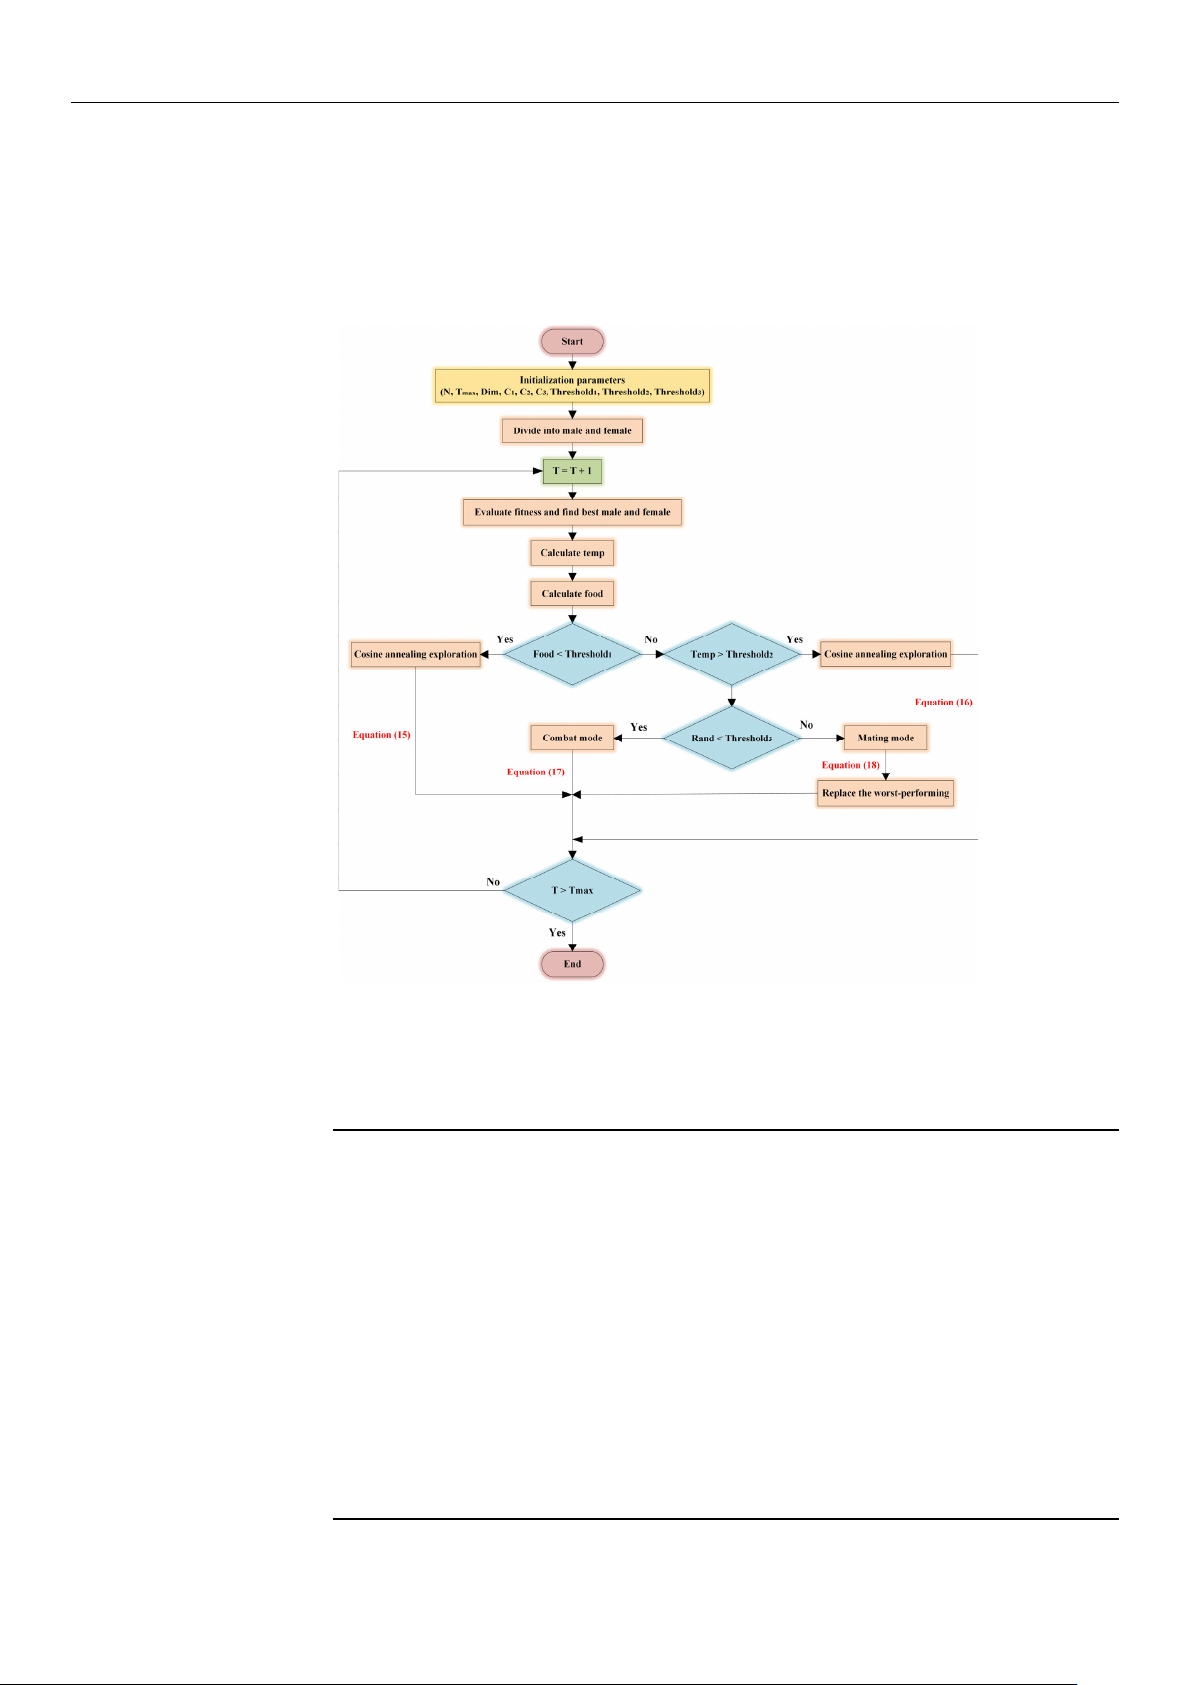
The flow chart of the ISO algorithm, which illustrates the step-by-step process, is
shown in Figure 8.
Sensors2025,25,xFORPEERREVIEW 14 of 25
Figure8.Theflowchartoftheimprovedsnakeoptimizationalgorithm.
TheISOalgorithmisoutlinedinAlgorithm,asshowninTable4.
Table4.ISOpseudo‐code.
1:Initializeparameters
2:InitializethepopulationusingtheTentChaoticMapasEquation(13)
3:DividepopulationintoN
mandNfusingEquations(10)and(11)
4:while(T<T
max)do
5:Evaluatethefitnessandidentifythebestfemaleandmale
6:CalculatetheiterationtemperatureandfoodquantityEquation(14)
7:if(Food<threshold
1)then
8:CosineannealingexplorationusingEquation(15)
9:elseif(Temp>threshold
2)then
10:CosineannealingexplorationusingEquation(16)
11:else
12:if(rand<threshold
3)then
13:EnterFightModeusingEquation(17)
14:else
15:EnterMatingModeusingEquation(18)
16:Replacetheworst‐performingfemaleandmale
Figure 8. The flow chart of the improved snake optimization algorithm.
The ISO algorithm is outlined in Algorithm, as shown in Table 4.
Table 4. ISO pseudo-code.
1: Initialize parameters
2: Initialize the population using the Tent Chaotic Map as Equation (13)
3: Divide population into N
m
and N
f
using Equations (10) and (11)
4: while (T < T
max
) do
5: Evaluate the fitness and identify the best female and male
6: Calculate the iteration temperature and food quantity Equation (14)
7: if (Food < threshold
1
) then
8: Cosine annealing exploration using Equation (15)
9: else if (Temp > threshold
2
) then
10: Cosine annealing exploration using Equation (16)
11: else
12: if (rand < threshold
3
) then
13: Enter Fight Mode using Equation (17)
14: else
15: Enter Mating Mode using Equation (18)
16: Replace the worst-performing female and male
17: end if
18: end if
19: end while
20: Return the optimal solution

Sensors 2025, 25, 1872
14 of 24
3. Results
3.1. Ability Test and Analysis for ISO
3.1.1. Parameter Settings and Simulation Results
In this study, all algorithm experiments and simulations are performed using MAT-
LAB 2022B software platform. To verify the convergence performance and accuracy of
the ISO algorithm, five heuristic algorithms—SO [
40
], SA [
41
], PSO [
19
], GWO [
42
], and
WOA
[43]—are
added for comparison. In addition, to ensure the rigor and accuracy of the
experimental results, the CEC2005 benchmark test set is selected as the objective function, as
listed in Table 5. Five unimodal functions (F
1
–F
5
) and three multi-modal functions (F
6
–F
8
) are
listed in Table 5. Through an in-depth analysis of these benchmark functions, the performance
of the ISO algorithm is evaluated to a certain extent.
Table 5. Test functions.
Function Range Min
F
1
(x) =
n
∑
i=1
x
2
i
[−100,100] 0
F
2
(x) =
n
∑
i=1
|
x
i
|
+
n
∏
i=1
|
x
i
|
[−10,10] 0
F
3
(x) =
n
∑
i=1
i
∑
j=1
x
j
!
2
[−100,100] 0
F
4
(x) = max
i
{|
x
i
|
, 1 ≤ i ≤ n
}
[−100,100] 0
F
5
(x) =
n
∑
i=1
ix
4
i
+ randm[0, 1)
[−128,128] 0
F
6
(x) =
n
∑
i=1
(x
2
i
−10 cos(2πx
i
) + 10)
[−5.12,5.12] 0
F
7
(x) =
1
4000
d
∑
i=1
x
2
i
−
d
∏
i=1
cos(
x
i
√
i
) + 1
[−600,600] 0
F
8
(x) =0.1
sin
2
(3πx
1
) +
n
∑
i=1
(x
i
−1)
2
1 + sin
2
(3πx
i
+ 1)
+ (x
n
−1)
2
1 + sin
2
(2πx
n
)
+
n
∑
i=1
u(x
i
, 5, 100, 4),
u(x
i
, a, k, m) =
k(x
i
− a)
m
, x
i
> a
0, a > x
i
> −a
k(−x
i
− a)
m
, x
i
< −a
[−50,50] 0
Before simulating the benchmark test functions for the six heuristic algorithms, a brief
introduction to their main parameter settings is necessary to ensure that researchers can
obtain similar experimental results when conducting simulations. To ensure the fairness of
experiments, the population size (N) of all algorithms is set to 50, the maximum iteration
number (T
max
) is set to 100, the dimension (Dim) is set to 30, and each algorithm is run
20 times independently. For the other key parameters within the algorithms, recommended
values based on experience are used for setting, and the specific parameter values are listed
in Table 6. After successfully configuring these parameters, a MATLAB script is used to
start the six algorithms simultaneously. The experimental results are summarized in Table 7,
and the iteration curves of the benchmark test functions are displayed in Figure 9.