s25061872.pdf - 第15页
Sensors 2025 , 25 , 1872 15 of 24 T able 6. Parameter settings for the algorithms. Algorithm Parameter Settings SO Theshold 1 = 0.25, Theshold 2 = 0.6, Theshold 3 = 0.6, C 1 = 0.5, C 2 = 0.05, C 3 = 2 SA T emp = 100, T e…

Sensors 2025, 25, 1872
14 of 24
3. Results
3.1. Ability Test and Analysis for ISO
3.1.1. Parameter Settings and Simulation Results
In this study, all algorithm experiments and simulations are performed using MAT-
LAB 2022B software platform. To verify the convergence performance and accuracy of
the ISO algorithm, five heuristic algorithms—SO [
40
], SA [
41
], PSO [
19
], GWO [
42
], and
WOA
[43]—are
added for comparison. In addition, to ensure the rigor and accuracy of the
experimental results, the CEC2005 benchmark test set is selected as the objective function, as
listed in Table 5. Five unimodal functions (F
1
–F
5
) and three multi-modal functions (F
6
–F
8
) are
listed in Table 5. Through an in-depth analysis of these benchmark functions, the performance
of the ISO algorithm is evaluated to a certain extent.
Table 5. Test functions.
Function Range Min
F
1
(x) =
n
∑
i=1
x
2
i
[−100,100] 0
F
2
(x) =
n
∑
i=1
|
x
i
|
+
n
∏
i=1
|
x
i
|
[−10,10] 0
F
3
(x) =
n
∑
i=1
i
∑
j=1
x
j
!
2
[−100,100] 0
F
4
(x) = max
i
{|
x
i
|
, 1 ≤ i ≤ n
}
[−100,100] 0
F
5
(x) =
n
∑
i=1
ix
4
i
+ randm[0, 1)
[−128,128] 0
F
6
(x) =
n
∑
i=1
(x
2
i
−10 cos(2πx
i
) + 10)
[−5.12,5.12] 0
F
7
(x) =
1
4000
d
∑
i=1
x
2
i
−
d
∏
i=1
cos(
x
i
√
i
) + 1
[−600,600] 0
F
8
(x) =0.1
sin
2
(3πx
1
) +
n
∑
i=1
(x
i
−1)
2
1 + sin
2
(3πx
i
+ 1)
+ (x
n
−1)
2
1 + sin
2
(2πx
n
)
+
n
∑
i=1
u(x
i
, 5, 100, 4),
u(x
i
, a, k, m) =
k(x
i
− a)
m
, x
i
> a
0, a > x
i
> −a
k(−x
i
− a)
m
, x
i
< −a
[−50,50] 0
Before simulating the benchmark test functions for the six heuristic algorithms, a brief
introduction to their main parameter settings is necessary to ensure that researchers can
obtain similar experimental results when conducting simulations. To ensure the fairness of
experiments, the population size (N) of all algorithms is set to 50, the maximum iteration
number (T
max
) is set to 100, the dimension (Dim) is set to 30, and each algorithm is run
20 times independently. For the other key parameters within the algorithms, recommended
values based on experience are used for setting, and the specific parameter values are listed
in Table 6. After successfully configuring these parameters, a MATLAB script is used to
start the six algorithms simultaneously. The experimental results are summarized in Table 7,
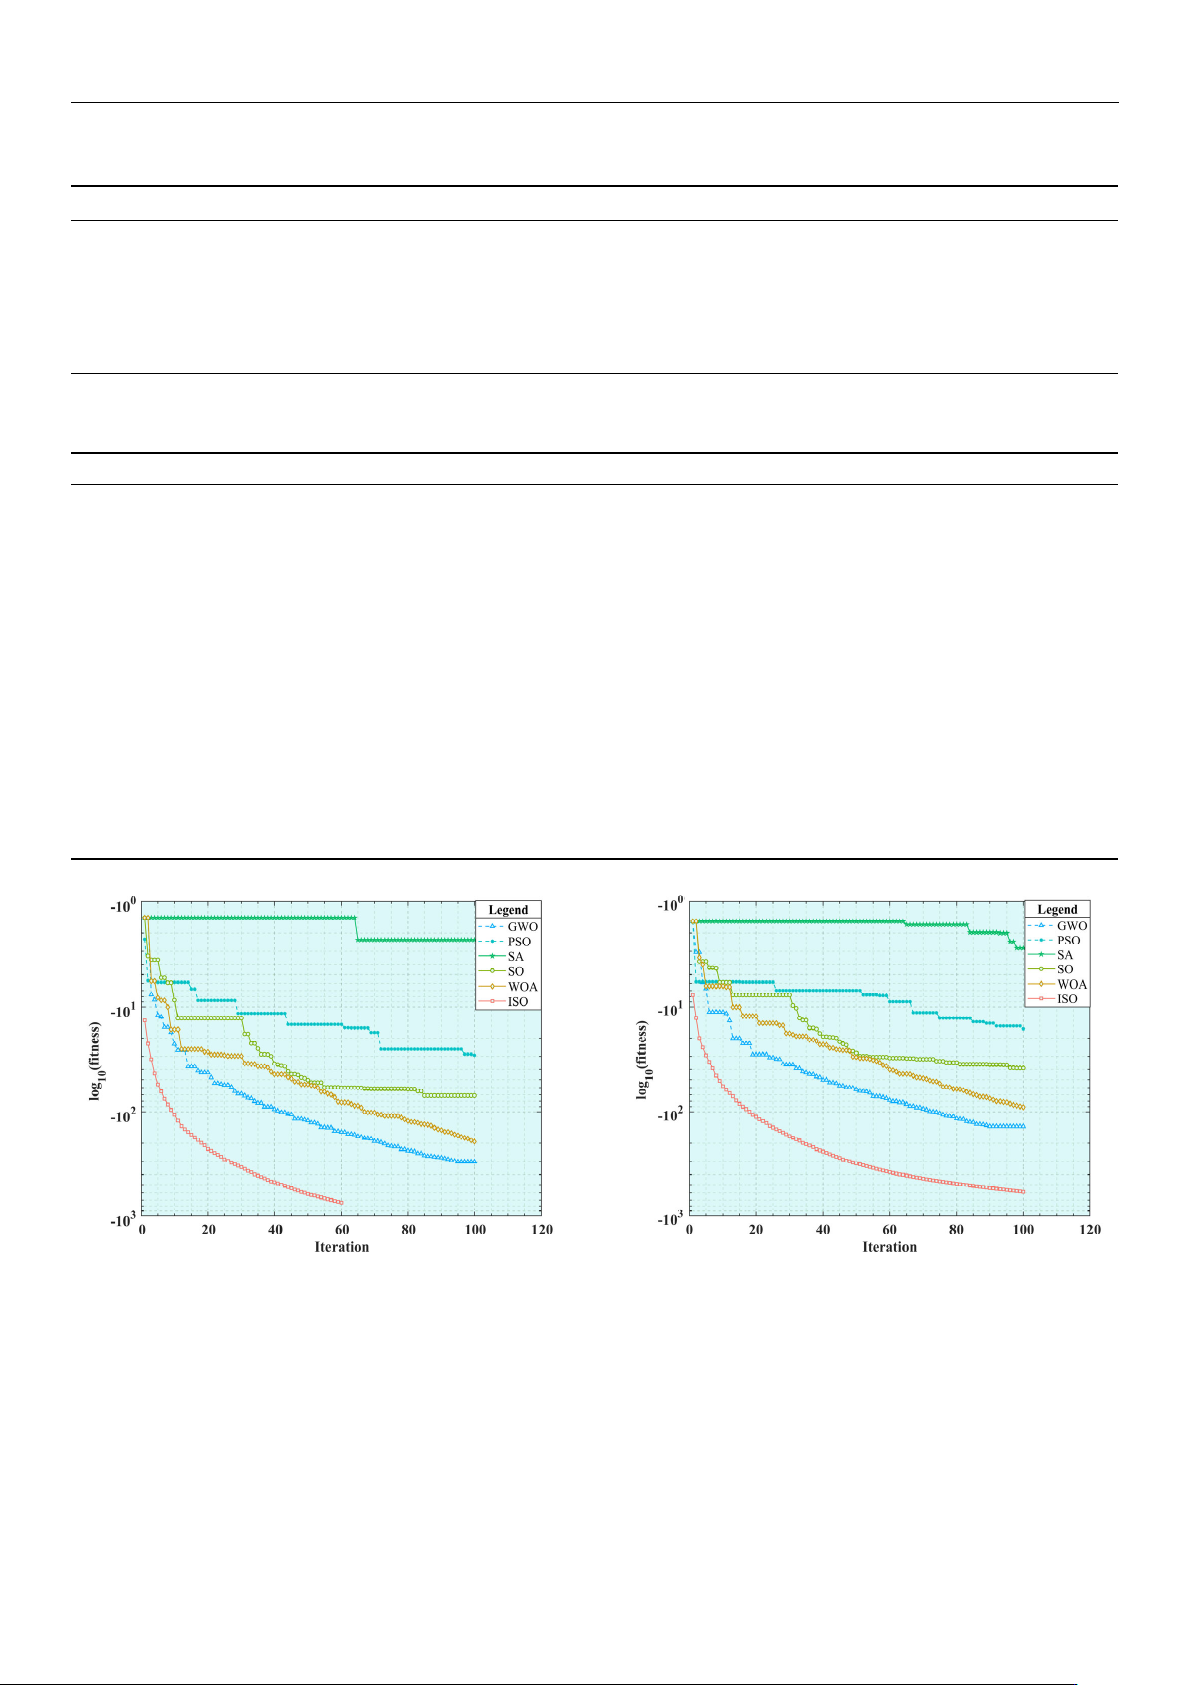
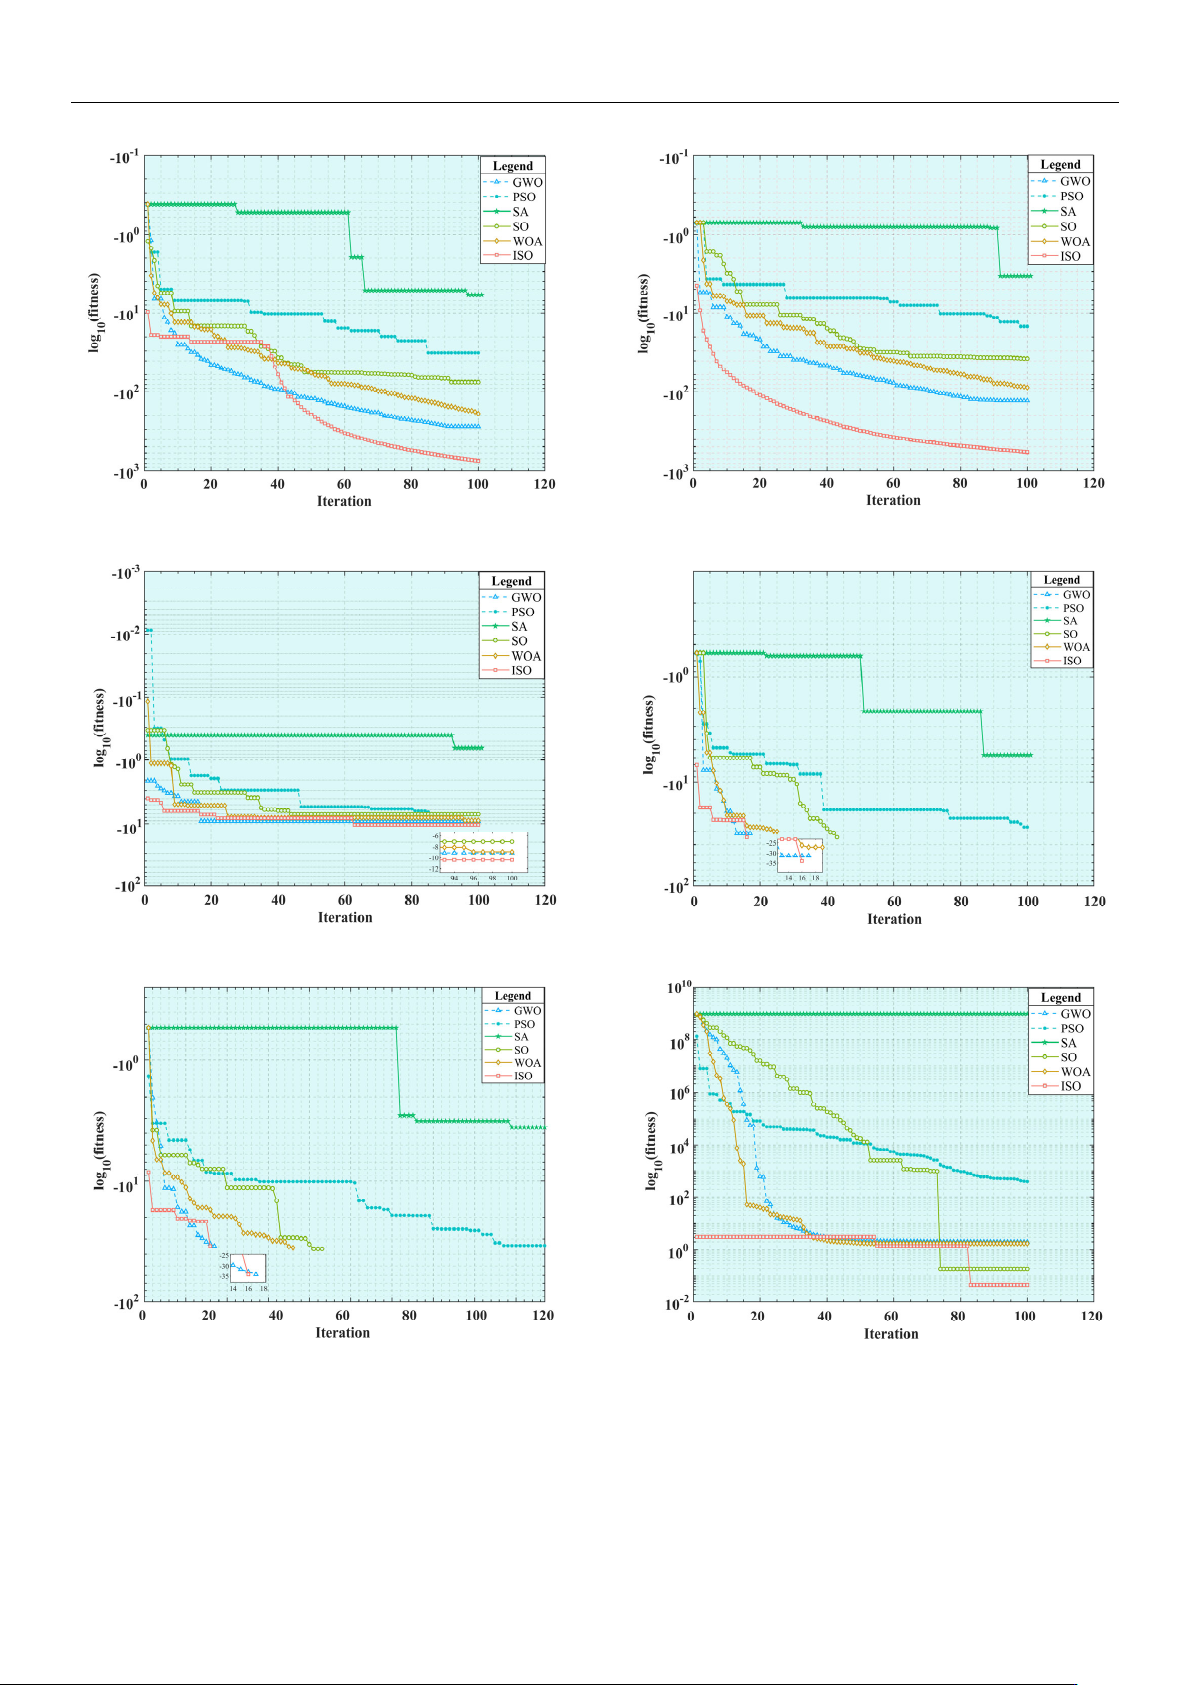
and the iteration curves of the benchmark test functions are displayed in Figure 9.
Sensors 2025, 25, 1872
15 of 24
Table 6. Parameter settings for the algorithms.
Algorithm Parameter Settings
SO Theshold
1
= 0.25, Theshold
2
= 0.6, Theshold
3
= 0.6, C
1
= 0.5, C
2
= 0.05, C
3
= 2
SA Temp = 100, Temp
min
= 0.01, alpha = 0.95
PSO w = 0.9, c
1
= 2, c
2
= 2, V
max
= 0.3 ∗ ub, V
min
= 0.3 ∗ lb
GWO r
1
= r
2
= rand
WOA r
1
= r
2
= rand, p = rand, b = 1
ISO sigma = 0.1, alpha
min
= 0.01, alpha
max
= 1.0, eta
max
= 0.01, eta
min
= 0.001
Table 7. Results obtained by different algorithms (D = 30).
Function SO SA PSO GWO WOA ISO
F
1
MEAN
8.27 × 10
−40
7.30 × 10
−2
3.04 × 10
−12
6.24 × 10
−105
8.40 × 10
−79
0
STD
2.51 × 10
−39
2.27 × 10
−1
6.51 × 10
−12
2.79 × 10
−104
2.10 × 10
−78
0
F
2
MEAN
3.95 × 10
−21
4.26 × 10
−2
1.38 × 10
−7
8.55 × 10
−57
2.95 × 10
−40
9.14 × 10
−214
STD
5.26 × 10
−21
2.87 × 10
−2
2.22 × 10
−7
3.13 × 10
−56
7.95 × 10
−40
0
F
3
MEAN
2.16 × 10
−39
3.85 × 10
−2
6.47 × 10
−12
6.66 × 10
−107
2.18 × 10
−79
0
STD
7.04 × 10
−39
8.37 × 10
−2
2.16 × 10
−11
2.98 × 10
−106
6.74 × 10
−79
0
F
4
MEAN
2.01 × 10
−20
1.34 × 10
−1
1.38 × 10
−6
1.27 × 10
−53
8.56 × 10
−40
2.27 × 10
−213
STD
3.54 × 10
−20
9.71 × 10
−2
2.36 × 10
−6
3.93 × 10
−53
2.64 × 10
−39
0
F
5
MEAN
7.01 × 10
−4
6.64 × 10
−1
1.77 × 10
−3
5.21 × 10
−4
7.33 × 10
−4
1.75 × 10
−4
STD
7.23 × 10
−4
8.91 × 10
−1
1.26 × 10
−3
5.08 × 10
−4
7.05 × 10
−4
2.72 × 10
−4
F
6
MEAN 0
1.79 × 10
−2
2.39 × 10
−12
0 0 0
STD 0
3.42 × 10
−2
3.35 × 10
−12
0 0 0
F
7
MEAN 0
1.67 × 10
−2
6.15 × 10
−12
0 0 0
STD 0
3.42 × 10
−2
3.35 × 10
−12
0 0 0
F
8
MEAN
1.74 × 10
1
1.10 × 10
9
4.41 × 10
1
1.24 × 10
0
8.13 × 10
−1
2.06 × 10
−1
STD
3.32 × 10
1
1.35 × 10
8
2.59 × 10
1
4.26 × 10
−1
3.08 × 10
−1
2.03 × 10
−1
Sensors2025,25,xFORPEERREVIEW 16 of 25
222 22
81
1
1
( ) 0.1 sin (3 ) ( 1) 1 sin (3 1) ( 1) 1 sin ( 2 )
( ,5,100, 4),
(),
(,,,) 0,
(),
n
iin n
i
n
i
i
m
ii
ii
m
ii
Fx x x x x x
ux
kx a x a
ux akm a x a
kxa x a
[−50,50] 0
Table6.Parameterseingsforthealgorithms.
Algorithm ParameterSeings
SO Theshold1=0.25,Theshold2=0.6,Theshold3=0.6,C1=0.5,C2=0.05,C3=2
SA Temp=100,Tempmin=0.01,alpha=0.95
PSO w=0.9,c
1=2,c2=2,Vmax=0.3*ub,Vmin=0.3*lb
GWO r
1=r2=rand
WOA r
1=r2=rand,p=rand,b=1
ISO sigma=0.1,alpha
min=0.01,alphamax=1.0,etamax=0.01,etamin=0.001
Table7.Resultsobtainedbydifferentalgorithms(D=30).
Function SO SA PSO GWO WOA ISO
F1
MEAN 8.27×10
−40
7.30×10
−2
3.04×10
−12
6.24×10
−105
8.40×10
−79
0
STD 2.51×10
−39
2.27×10
−1
6.51×10
−12
2.79×10
−104
2.10×10
−78
0
F
2
MEAN 3.95×10
−21
4.26×10
−2
1.38×10
−7
8.55×10
−57
2.95×10
−40
9.14×10
−214
STD 5.26×10
−21
2.87×10
−2
2.22×10
−7
3.13×10
−56
7.95×10
−40
0
F
3
MEAN 2.16×10
−39
3.85×10
−2
6.47×10
−12
6.66×10
−107
2.18×10
−79
0
STD 7.04×10
−39
8.37×10
−2
2.16×10
−11
2.98×10
−106
6.74×10
−79
0
F
4
MEAN 2.01×10
−20
1.34×10
−1
1.38×10
−6
1.27×10
−53
8.56×10
−40
2.27×10
−213
STD 3.54×10
−20
9.71×10
−2
2.36×10
−6
3.93×10
−53
2.64×10
−39
0
F
5
MEAN 7.01×10
−4
6.64×10
−1
1.77×10
−3
5.21×10
−4
7.33×10
−4
1.75×10
−4
STD 7.23×10
−4
8.91×10
−1
1.26×10
−3
5.08×10
−4
7.05×10
−4
2.72×10
−4
F
6
MEAN 0 1.79×10
−2
2.39×10
−12
0 0 0
STD 0 3.42×10
−2
3.35×10
−12
0 0 0
F
7
MEAN 0 1.67×10
−2
6.15×10
−12
0 0 0
STD 0 3.42×10
−2
3.35×10
−12
0 0 0
F
8
MEAN 1.74×10
1
1.10×10
9
4.41×10
1
1.24×10
0
8.13×10
−1
2.06×10
−1
STD 3.32×10
1
1.35×10
8
2.59×10
1
4.26×10
−1
3.08×10
−1
2.03×10
−1
(a) (b)
Figure 9. Cont.
Sensors 2025, 25, 1872
16 of 24
Sensors2025,25,xFORPEERREVIEW 17 of 25
(c) (d)
(e) (f)
(g) (h)
Figure9.Convergencecurveofthereferencefunction:(a)F1;(b)F2;(c)F3;(d)F4;(e)F5;(f)F6;(g)F7;
(h)F
8.
3.1.2.SimulationResultAnalysis
TheresultsoftheeightbenchmarkfunctionslistedinTable7arecomprehensively
analyzedandcompared.AsshowninFigure9a–e,itisclearlyobservedthatwhenthe
dimension(Dim)is30,theISOalgorithmachievesanoptimalfitnessvalueof0fortheF
1
andF
3problemsintheunimodaltestfunction.Itsconvergencecurvecanrapidlyjump
Figure 9. Convergence curve of the reference function: (a) F
1
; (b) F
2
; (c) F
3
; (d) F
4
; (e) F
5
; (f) F
6
;
(g) F
7
; (h) F
8
.
3.1.2. Simulation Result Analysis
The results of the eight benchmark functions listed in Table 7 are comprehensively
analyzed and compared. As shown in Figure 9a–e, it is clearly observed that when the