s25061872.pdf - 第21页
Sensors 2025 , 25 , 1872 21 of 24 Sensors 2025 , 25 , x FOR PE ER REV I E W 22 of 25 ( a ) ( b ) ( c ) ( d ) Figure 13. Kine matic im ag e: ( a ) Disp lacem e nt cu rve…
Sensors 2025, 25, 1872
20 of 24
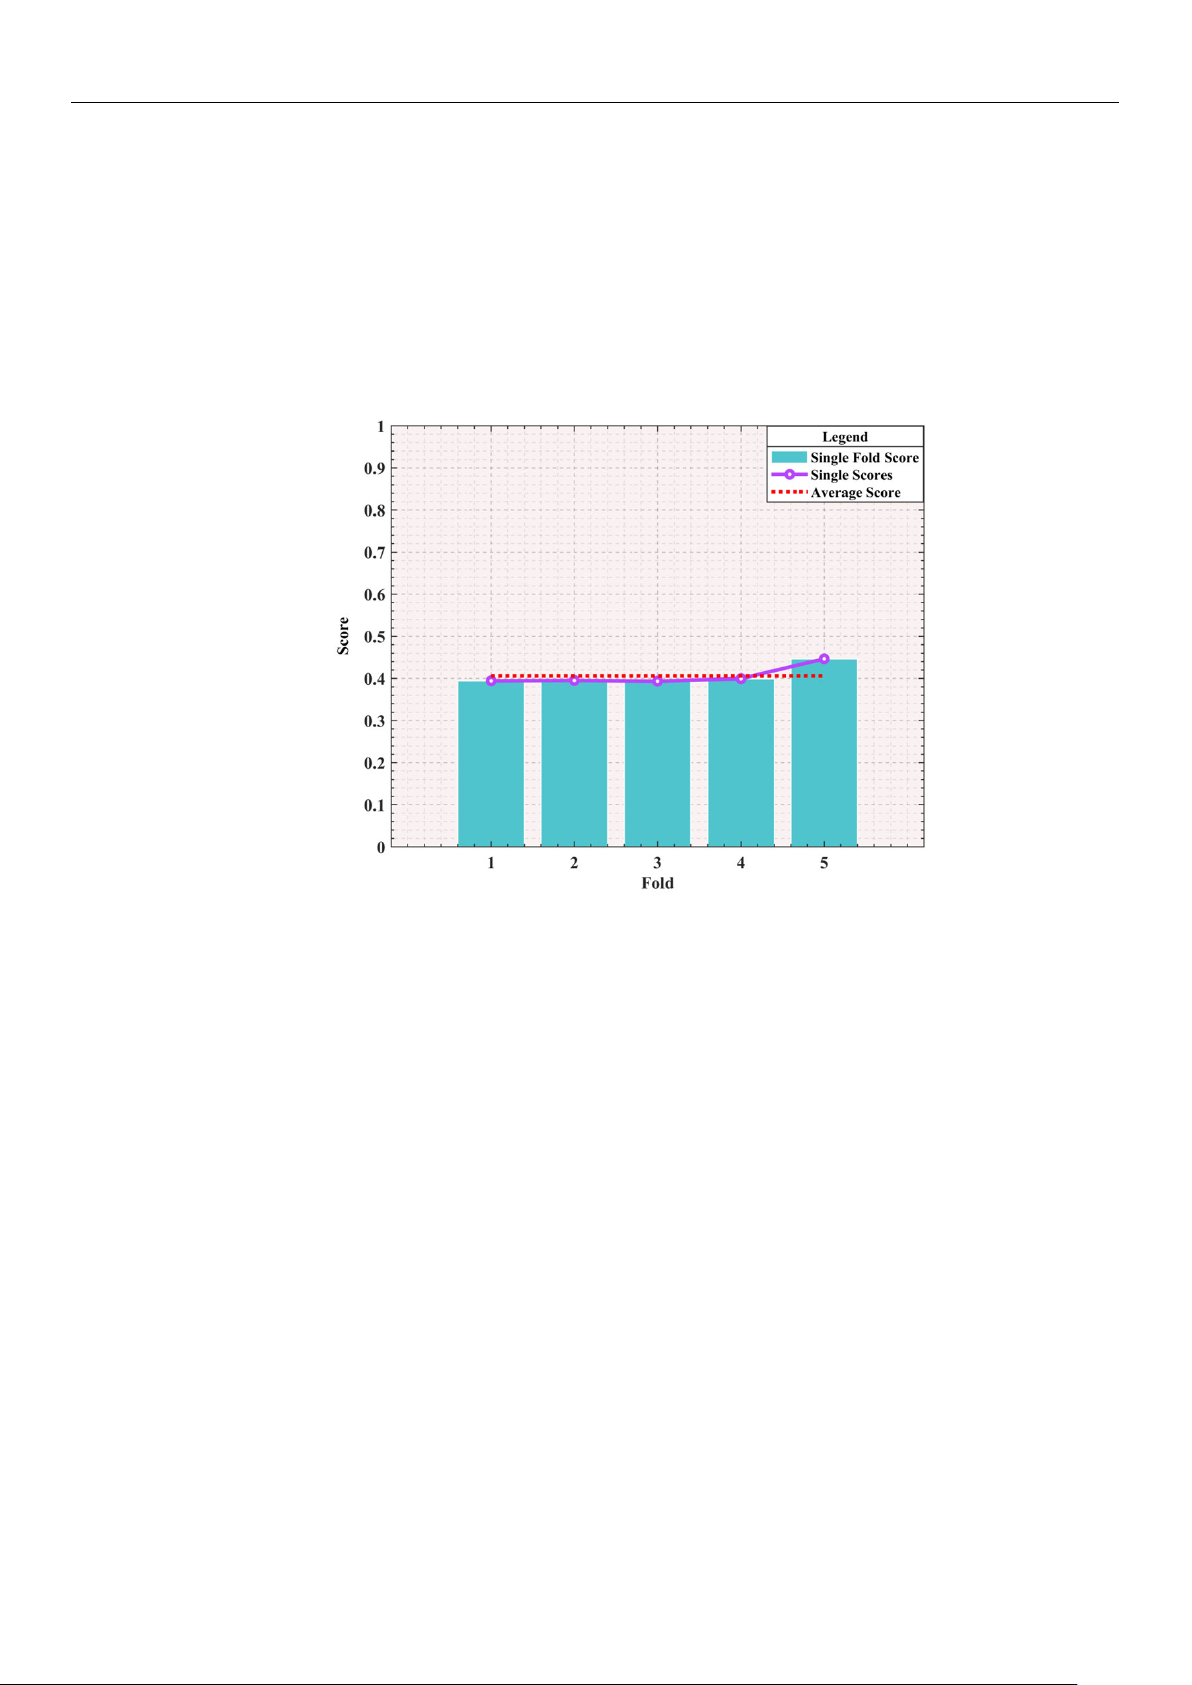
To verify the performance of Bayesian optimization in optimizing the parameters of
the objective function, a 5-fold cross-validation method was adopted in this study. The
experimental results are shown in Figure 12. It can be clearly seen that the performance
of this model during the 5-fold cross-validation process is relatively stable, with a small
fluctuation range of the Single Scores, which fully indicates that the model has a certain
fitting ability. Generally speaking, a cross-validation score within 0.2 can be regarded as
excellent, and a score between 0.2 and 0.5 indicates average performance. The average
score of this experiment is approximately 0.4, which indicates that the model has a certain
predictive ability on this dataset as a whole, but there is still room for improvement.
Sensors2025,25,xFORPEERREVIEW 21 of 25
Figure12.K‐FoldCrossValidationPerformance(K=5).
AccordingtothedataprovidedinTable10,Bayesianoptimizationisusedtoselect
thesecond‐generationsimulationresultswiththeminimumobjectivefunctionvalue.This
selection is based on minimization of the target value during the iteration. Figure 10.
clearly shows the dynamic change in the target value with the
iteration, making the
changeprocessclear. Fu rtheranalysisofFigure11, theminimumvalues ofF
1
andF
2
,
respectively,reach5.6294sand115.937mm/s.Andthetwominimumvaluesare,respec‐
tively,locatedatthetwoendsoftheParetofrontiercomposedofthereddots.Tooptimize
boththetimeandimpact,anoptimaladvantagemustbefoundontheParetofrontier.A
specificpoint
isidentifiedinFigure11 ,whichachievesanoptimalbalancebetweenthe
timeandimpact.Whena
max
andj
max
are78.1476mm/s
2
and119.8756mm/s
3
,thetimeand
impactoftheParetooptimalvalueare5.8028sand167.5427mm/s,respectively.
Usingthecomputeda
max
andj
max
,thesedataarereintegratedintothetrajectoryplan‐
ningoftheS‐shapedspeedcurve.Throughthisprocess,itispossibletoaccuratelydeter‐
minethepartialdisplacementofthetrajectoryplanninginthedirectionsoftheX‐axisand
Y‐axis,aswellastheassociatedcombinedvelocities,combined
accelerations,andcom‐
binedaccelerations,asshowninFigure13.Thesefiguresclearlyshowthattheplanned
S‐shapedspeedcurveexhibitedsmoothcharacteristicsduringmovement ,effectively
avoidingsuddenchangesandshocks.Thisisextremelyimportantforprecisionopera‐
tionssuchaswafer handling,asithelpsreducethedamage
thatcanbecausedbyimpact.
Table10.TheiterativegraphofBayesianthresholds.
Iteration Objective BestSoFar(Observed) BestSoFar(Estimated) Threshold
1
Threshold
2
Threshold
3
1 — — — 0.4227 0.7616 0.5225
2 0.3936 0.3936 0.4255 0.0989 0.7764 0.5705
3 0.3952 0.3936 0.3936 0.1721 0.7210 0.7933
4 0.3969 0.3936 0.3932 0.0752 0.4968 0.5437
5 0.3953 0.3936 0.3942 0.1403 0.6057 0.7633
6 0.3991 0.3936 0.3946 0.0500 0.5764 0.5441
7 0.3957 0.3936 0.3949 0.1485 0.5278 0.4003
8 0.3969 0.3936 0.3951 0.1113 0.7425 0.4637
9 0.3955
0.3936 0.3951 0.1592 0.7106 0.7313
10 0.3979 0.3936 0.3958 0.1587 0.6833 0.6341
Figure 12. K-Fold Cross Validation Performance (K = 5).
According to the data provided in Table 10, Bayesian optimization is used to select
the second-generation simulation results with the minimum objective function value. This
selection is based on minimization of the target value during the iteration. Figure 10. clearly
shows the dynamic change in the target value with the iteration, making the change process
clear. Further analysis of Figure 11, the minimum values of F
1
and F
2
, respectively, reach
5.6294 s and 115.937 mm/s. And the two minimum values are, respectively, located at the
two ends of the Pareto frontier composed of the red dots. To optimize both the time and
impact, an optimal advantage must be found on the Pareto frontier. A specific point is
identified in Figure 11, which achieves an optimal balance between the time and impact.
When a
max
and j
max
are 78.1476 mm/s
2
and 119.8756 mm/s
3
, the time and impact of the
Pareto optimal value are 5.8028 s and 167.5427 mm/s, respectively.
Using the computed a
max
and j
max
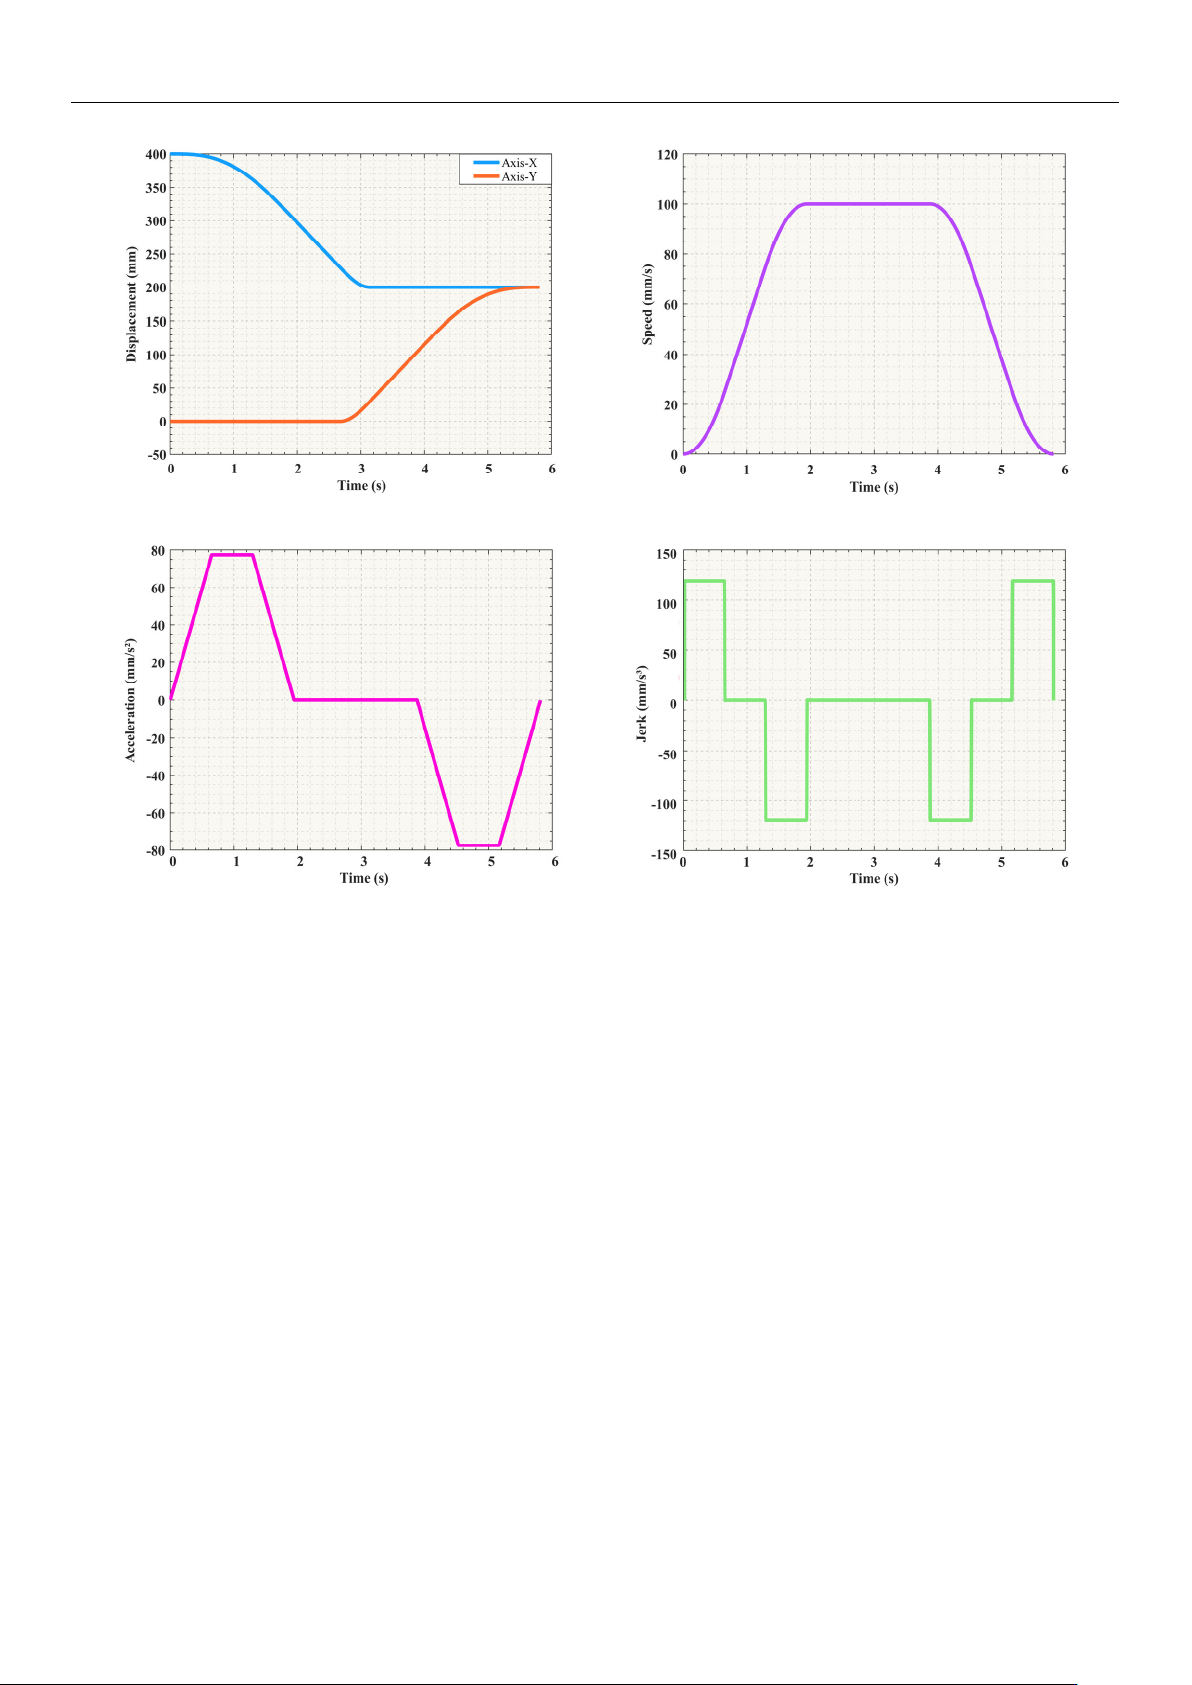
, these data are reintegrated into the trajectory planning
of the S-shaped speed curve. Through this process, it is possible to accurately determine the
partial displacement of the trajectory planning in the directions of the X-axis and Y-axis, as well
as the associated combined velocities, combined accelerations, and combined accelerations,
as shown in Figure 13. These figures clearly show that the planned S-shaped speed curve
exhibited smooth characteristics during movement, effectively avoiding sudden changes and
shocks. This is extremely important for precision operations such as wafer handling, as it
helps reduce the damage that can be caused by impact.
Sensors 2025, 25, 1872
21 of 24
Sensors2025,25,xFORPEERREVIEW 22 of 25
(a) (b)
(c) (d)
Figure13.Kinematicimage:(a)DisplacementcurveinCartesianspace;(b)speedcurveinCartes ian
space;(c)accelerationcurveinCartesianspace;(d)jerkcurveinCartesianspace.
Inaddition,thisstudymeticulouslyrecordsthekeyparameters,particularlythejoint
angles,duringtheS‐shapedspeedcurvemovement.Twosetsofjointanglesconsistingof
severalinterpolationpointsaresubstitutedintotheforwardkinematicsformula,asshown
inEquat ion(30).XandYrepr es ent thecoordi natevaluesinthe
Cartesiancoo r dinat e
system,respectively.
112 1 2
112 1 2
cos cos cos
sin sin sin
Xlink link
Y link link
(30)
TheactualmotiontrajectorydepictedintheplanarspaceisshowninFigure14.By
comparingFigures4and14,thehighconsistencyofthetwotrajectoriescanbecl earl y
verified.ThiscomparisonclearlyvalidatestheaccuracyandreliabilityoftheISO. This
planningmethodnotonlyelevatestheaccuracy
oftrajectoryplanning,butalsoensures
thesafetyandreliabilityofthemotion.
Figure 13. Kinematic image: (a) Displacement curve in Cartesian space; (b) speed curve in Cartesian
space; (c) acceleration curve in Cartesian space; (d) jerk curve in Cartesian space.
In addition, this study meticulously records the key parameters, particularly the joint
angles, during the S-shaped speed curve movement. Two sets of joint angles consisting of
several interpolation points are substituted into the forward kinematics formula, as shown
in Equation (30). X and Y represent the coordinate values in the Cartesian coordinate
system, respectively.
(
X = link
1
×cos θ
1
+ link
2
×
(
cos θ
1
+ cos θ
2
)
Y = link
1
×sin θ
1
+ link
2
×
(
sin θ
1
+ sin θ
2
)
(30)
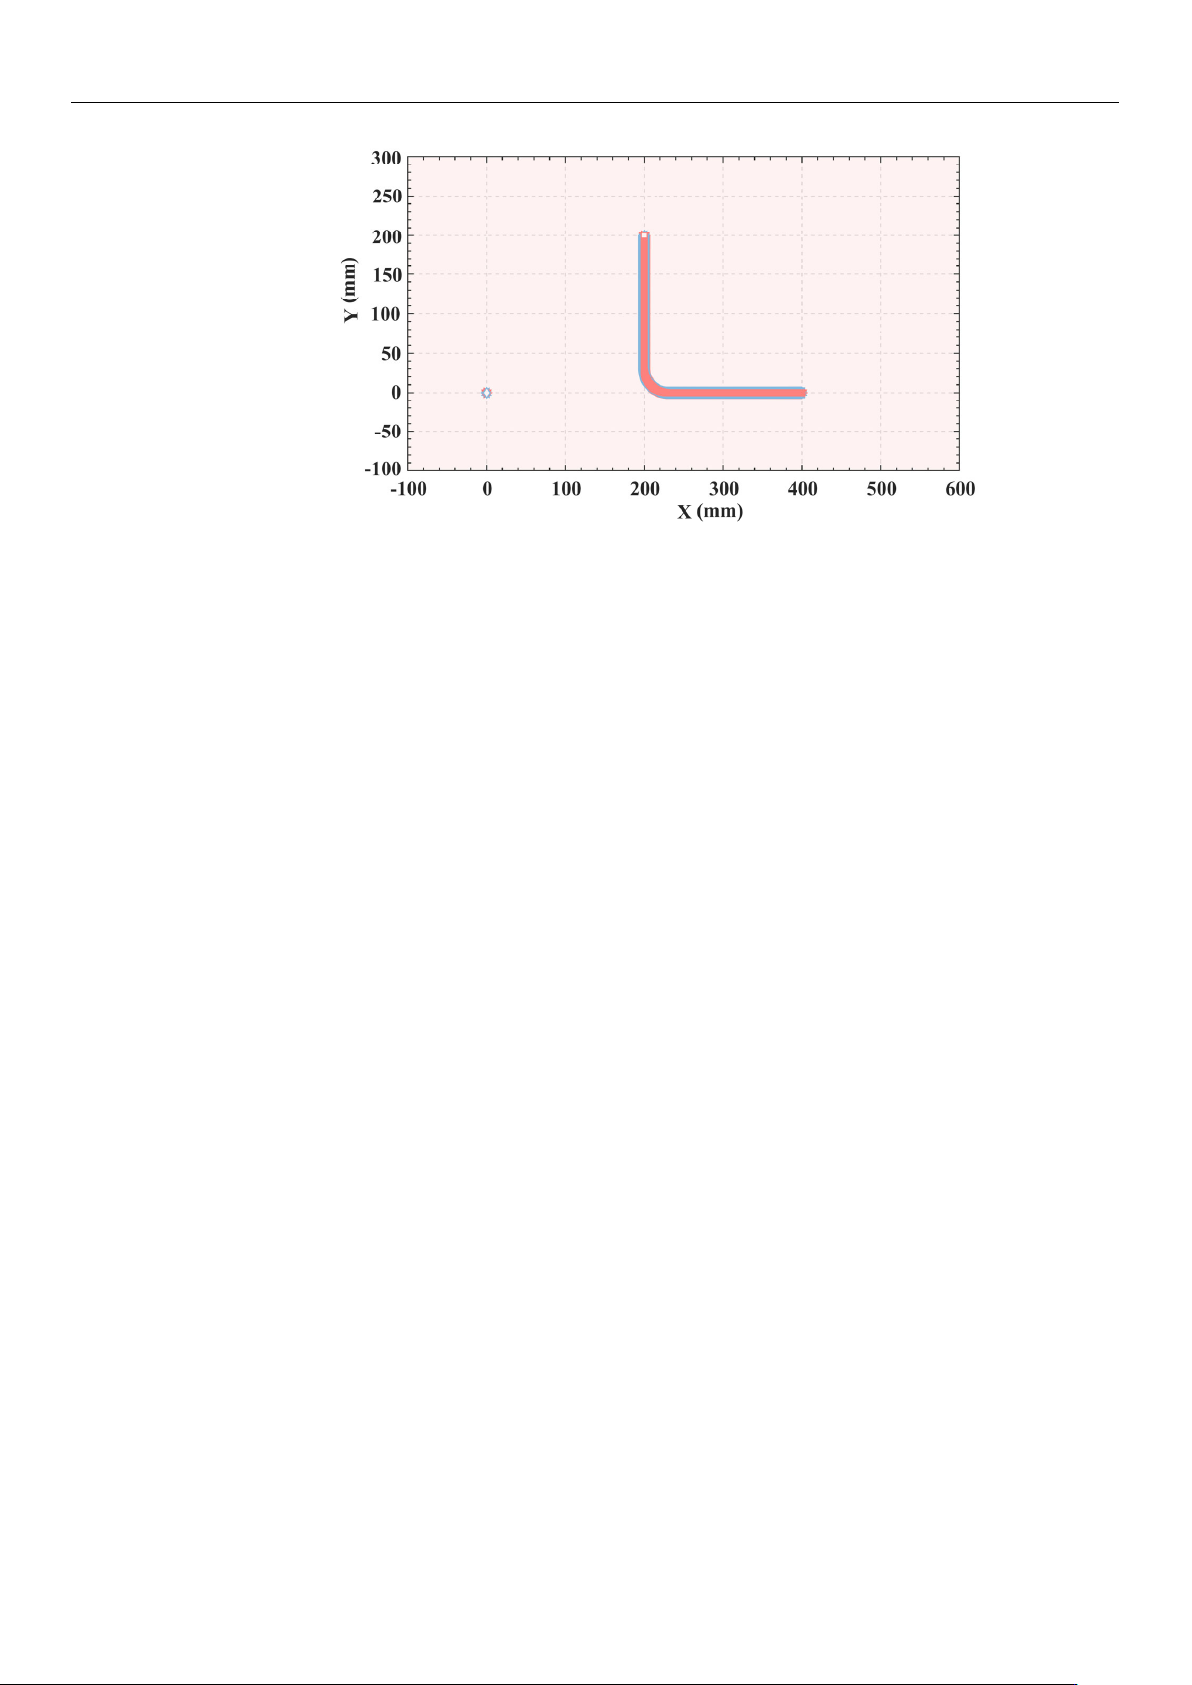
The actual motion trajectory depicted in the planar space is shown in Figure 14. By
comparing Figures 4 and 14, the high consistency of the two trajectories can be clearly
verified. This comparison clearly validates the accuracy and reliability of the ISO. This
planning method not only elevates the accuracy of trajectory planning, but also ensures the
safety and reliability of the motion.
Sensors 2025, 25, 1872
22 of 24
Sensors2025,25,xFORPEERREVIEW 23 of 25
Figure14.Motiontrajectoriesinatwo−dimensionalplane.
4.Conclusions
Thisstudyproposesanimprovedsnakeoptimization(ISO)algorithm.Meanwhile,a
single‐segmentstart–stopS‐shapedspeedcurvewitharctransitionisconstructedbased
onISO,whichisa methodspecificallydesignedfortherapidandstableoperationrequire‐
mentsof thewafer‐handling roboticarm.Thismethod extensively investigates
and
optimizesonthekeyissuesoftimeandimpactwithinthecontextofroboticarmtrajectory
planning.ThroughacomparativeanalysiswiththeoriginalS‐shapedspeedcurvescheme
underthe same para met e r sett ings, the new method improvesthe time efficiencyby
24.1%,therebysignificantlyreducingthetime
requiredfortheroboticarmtocomplete
thetask.Furthermore,theperformanceoftheISOiscomparedwiththatofSO,SA,PSO,
GWO,andWOAonaseriesofbenchmarktestfunctions.Theresultsindicatethat,interms
ofthetwo key performance indicators,averagevalueandvariance,the ISO
algorithm
outperformsthesecondrankedGWOalgorithmbyamarginof38.9%.Theseimproved
simulationsfullydemonstratetheeffectivenessandsuperiorityoftheproposed method
inaddressingthetrajectoryplanning problemforwafer‐handlingroboticarms.
Inthisstudy,theshortcomingsoftheSOalgorithmhavebeenextensivelystudied
andimproved.Whiletheproposedenhancementsimproveglobalsearchcapabilities,the
riskoflocaloptimaconvergencepersists.Additionall y,althoughBayesianopt imization
improvesthesearchefficiency,itconsumesmorecomputerresources.Therefore,future
researchwil l prioritizerefining thesea rchmechanismtoaddresstheseli mitationsofthe
SOalgorithm.Simultaneously,weplanto
explorethecombinationofBayesianoptimi‐
zationandbandit‐basedmethods,aimingtoreducecomputationalcostswhileimprov‐
ingtheoptimizationefficiency.
AuthorContributions:Conceptualization,Y.J.andJ.Y.;methodology,J.Y.;software,J.Y.;validation,
J.Y.;formalanalysis,J.Y.;investigation,Y.J.andJ.Y.Allauthorshavereadandagreedtothepub‐
lishedversionofthemanuscript.
Funding:Thisresearchwasfunded bytheBasicScientificResearchProjectofHigherEducation
InstitutionsofLiaoning
Province(grantnumberJYTQN2023064).
InstitutionalReviewBoardStatement:Notapplicable.
InformedConsentStatement:Notapplicable.
DataAvailabilityStatement:Datasharingnotapplicable.Nonewdatawerecreatedoranalyzed
inthisstudy.Datasharingisnotapplicabletothisarticle.
Figure 14. Motion trajectories in a two−dimensional plane.
4. Conclusions
This study proposes an improved snake optimization (ISO) algorithm. Meanwhile, a
single-segment start–stop S-shaped speed curve with arc transition is constructed based on
ISO, which is a method specifically designed for the rapid and stable operation requirements
of the wafer-handling robotic arm. This method extensively investigates and optimizes on
the key issues of time and impact within the context of robotic arm trajectory planning.
Through a comparative analysis with the original S-shaped speed curve scheme under
the same parameter settings, the new method improves the time efficiency by 24.1%,
thereby significantly reducing the time required for the robotic arm to complete the task.
Furthermore, the performance of the ISO is compared with that of SO, SA, PSO, GWO, and
WOA on a series of benchmark test functions. The results indicate that, in terms of the two
key performance indicators, average value and variance, the ISO algorithm outperforms
the second ranked GWO algorithm by a margin of 38.9%. These improved simulations
fully demonstrate the effectiveness and superiority of the proposed method in addressing
the trajectory planning problem for wafer-handling robotic arms.
In this study, the shortcomings of the SO algorithm have been extensively studied
and improved. While the proposed enhancements improve global search capabilities, the
risk of local optima convergence persists. Additionally, although Bayesian optimization
improves the search efficiency, it consumes more computer resources. Therefore, future
research will prioritize refining the search mechanism to address these limitations of the SO
algorithm. Simultaneously, we plan to explore the combination of Bayesian optimization
and bandit-based methods, aiming to reduce computational costs while improving the
optimization efficiency.
Author Contributions: Conceptualization, Y.J. and J.Y.; methodology, J.Y.; software, J.Y.; validation,
J.Y.; formal analysis, J.Y.; investigation, Y.J. and J.Y. All authors have read and agreed to the published
version of the manuscript.
Funding: This research was funded by the Basic Scientific Research Project of Higher Education
Institutions of Liaoning Province (grant number JYTQN2023064).
Institutional Review Board Statement: Not applicable.
Informed Consent Statement: Not applicable.
Data Availability Statement: Data sharing not applicable. No new data were created or analyzed in
this study. Data sharing is not applicable to this article.