s25061872.pdf - 第19页
Sensors 2025 , 25 , 1872 19 of 24 T able 10. The iterative graph of Bayesian thresholds. Iteration Objective BestSoFar (Observed) BestSoFar (Estimated) Threshold 1 Threshold 2 Threshold 3 1 — — — 0.4227 0.7616 0.5225 2 0…

Sensors 2025, 25, 1872
18 of 24
optimization. Because the weights of time and impact are considered consistent in this
study, both w
1
and w
2
are set to 0.5. Secondly, the time function F
1
and the impact function
F
2
belong to different categories of physical quantities. When the weighted sum of their
calculation results is taken directly, it leads to an imbalance between the time and impact.
To address this issue, a minimum–maximum normalization method is employed in this
study. It is typically used to eliminate the influence of dimensions among different features,
making the data comparable on the same scale, as shown in Equations (28) and (29).
F
1_norm
=
F
1
−min(F
1
)
max(F
1
) − min(F
1
)
(28)
F
2_norm
=
F
2
−min(F
2
)
max(F
2
) − min(F
2
)
(29)
After the above operations, the domains of the values for F
1
and F
2
functions are
restricted within the same range. Based on this, a set of excellent solutions is selected
by solving a multi-objective function. Then, the optimal solution is identified using the
Pareto optimization method. The Pareto judgment standard is as follows. If a new solution
improves at least one objective without causing a performance decline in other objectives,
then the new solution is considered to be superior to the original solution. When these
Pareto optimal solutions are smoothly connected, a Pareto frontier is formed. Ultimately,
this study aims to determine a balance point on this curve to achieve the best overall effect.
The specific parameter configuration of the simulation experiment can be found in
Table 9 for the application of the ISO algorithm to the S-shaped speed curve optimization
problem, and the kinematic parameters are set according to Industrial Robot ISO 9283:1998.
In the simulation experiments, a
max
and j
max
are set as independent variables and their
upper bound (ub) and lower bound (lb) are between 80 and 120. In the SO algorithm,
the empirical values of threshold parameters threshold
1
, threshold
2
, and threshold
3
are
0.25, 0.6, and 0.6, respectively. To determine more reasonable parameter combinations, the
ranges of these thresholds are unified and adjusted. The range of threshold
1
is limited
to 0.05 to 0.45, while the ranges of threshold
2
and threshold
3
are adjusted to 0.4 to 0.8.
Correspondingly, the search range of the threshold parameter (Bayesian threshold) in the
Bayesian optimization process is also set to 0.05 to 0.8 to facilitate determining the optimal
parameter configuration. The other parameters have the same meanings as those described
earlier. The Bayesian optimization threshold simulation results are shown in Table 10,
which includes the iteration, the actual observed objective value of the current iteration,
the best observed value among all observations (BestSoFar_observed), the model-predicted
best value (BestSoFar_estimated), and the best thresholds combination obtained in this
generation. However, because there are not enough data to support the construction of
the first-generation model of Bayesian optimization, Objective, BestSoFar_estimated, and
BestSoFar_observed are not included in the calculation. In addition, a simulation diagram
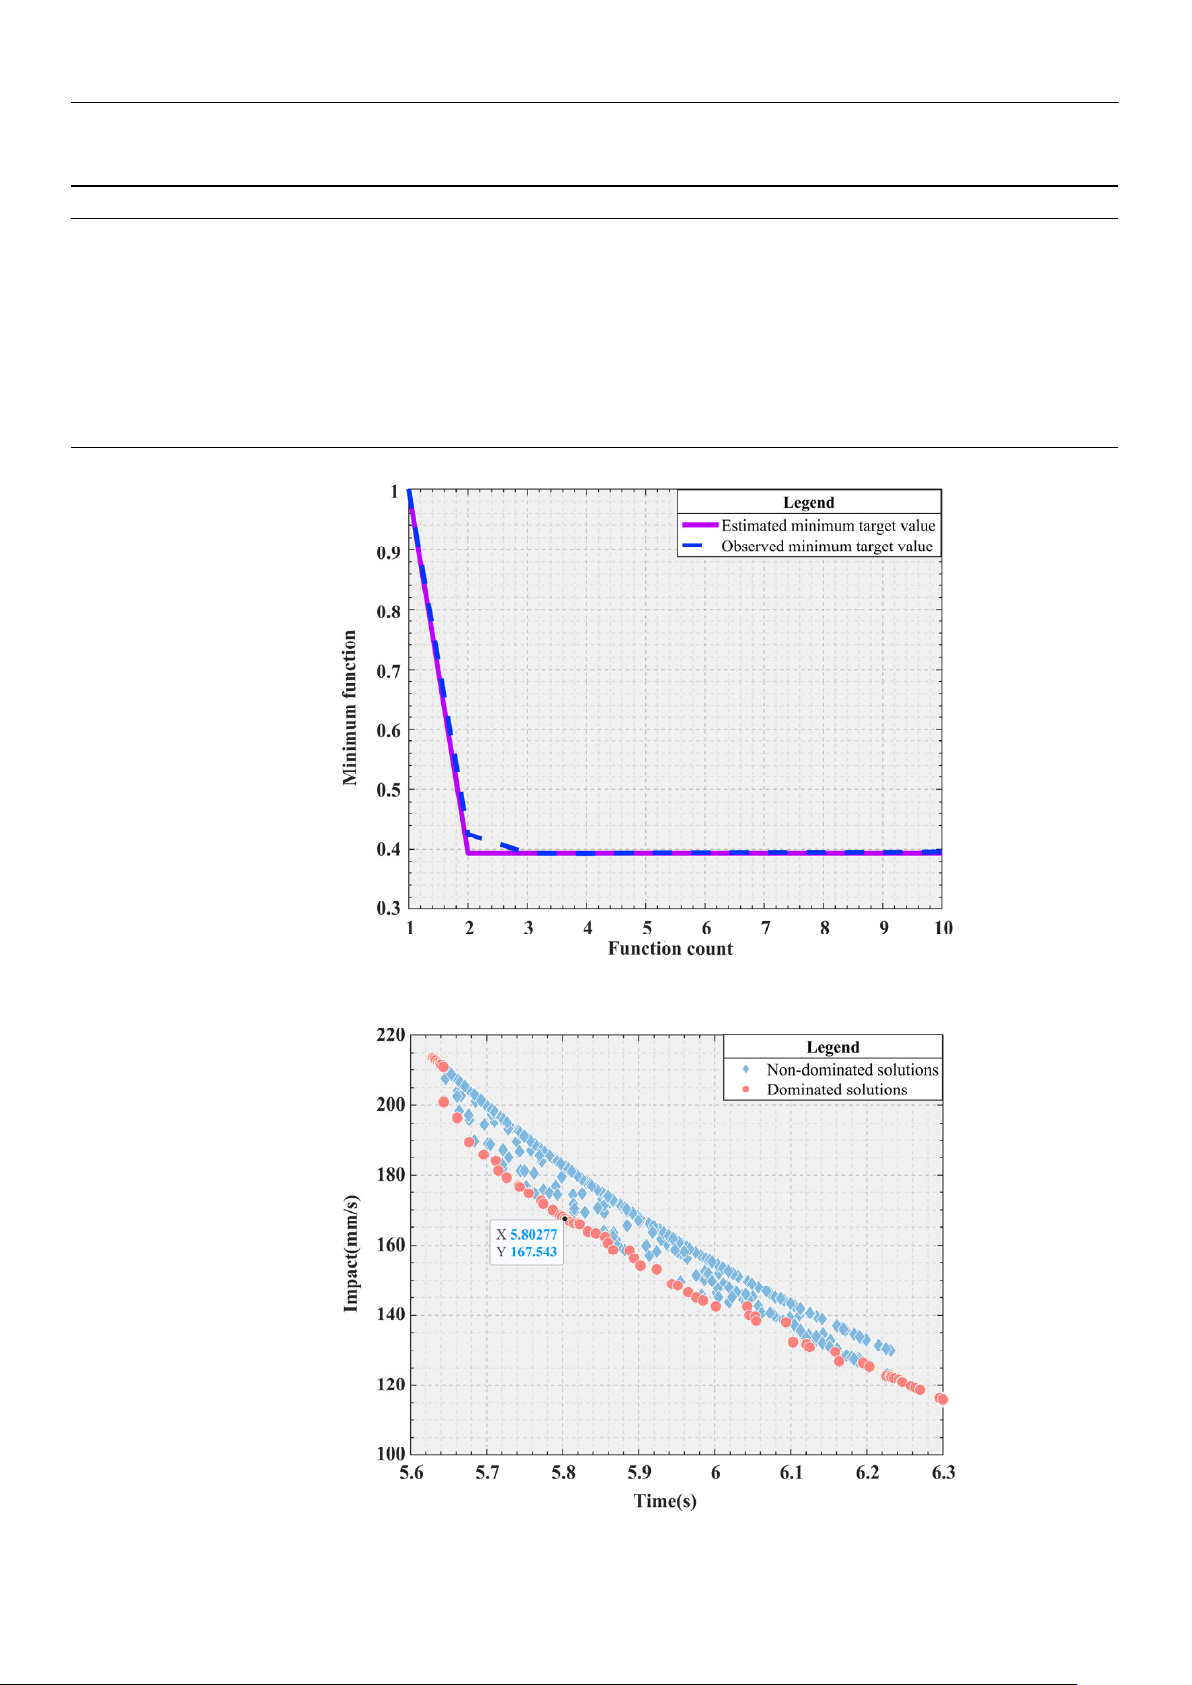
of the minimum objective value and function calculation times corresponding to Bayesian
optimization is shown in Figure 10, where the initial value of the first generation is replaced
by number 1. For the dual-objective optimization problem considered in this study, the
distribution of the Pareto frontier is generally in the form of a curve, which is intuitively
shown in Figure 11.
Table 9. The main parameter setting.
v_ p
0
(mm/s)
v_ p
1
(mm/s)
v_ p
2
(mm/s)
v
max
(mm/s)
r
1
(mm)
Bayesian
Evaluations
Bayesian
Threshold
T
max
Dim N lb ub
0 100 0 100 30 10 [0.05,0.8] 100 2 20 [80,120] [80,120]
Sensors 2025, 25, 1872
19 of 24
Table 10. The iterative graph of Bayesian thresholds.
Iteration
Objective BestSoFar (Observed) BestSoFar (Estimated) Threshold
1
Threshold
2
Threshold
3
1 — — — 0.4227 0.7616 0.5225
2 0.3936 0.3936 0.4255 0.0989 0.7764 0.5705
3 0.3952 0.3936 0.3936 0.1721 0.7210 0.7933
4 0.3969 0.3936 0.3932 0.0752 0.4968 0.5437
5 0.3953 0.3936 0.3942 0.1403 0.6057 0.7633
6 0.3991 0.3936 0.3946 0.0500 0.5764 0.5441
7 0.3957 0.3936 0.3949 0.1485 0.5278 0.4003
8 0.3969 0.3936 0.3951 0.1113 0.7425 0.4637
9 0.3955 0.3936 0.3951 0.1592 0.7106 0.7313
10 0.3979 0.3936 0.3958 0.1587 0.6833 0.6341
Sensors2025,25,xFORPEERREVIEW 20 of 25
Figure10.Functioncount.
Figure11.Paretofrontier.
ToverifytheperformanceofBayesianoptimizationinoptimizingtheparametersof
theobjectivefunction,a5‐foldcross‐validationmethodwasadoptedinthisstudy.The
experimentalresultsareshowninFigure12.Itcanbeclearlyseenthattheperformance
ofthismodelduringthe5‐foldcross‐vali da tio n
processisrelativelystable,withasmall
fluctuationrangeoftheSingleScores,whichfullyindicatesthatthemodelhasacertain
fittingability.Generallyspeaking,across‐validationscorewithi n0.2canbere ga rd ed
asexcellent, andascorebetween0.2and0.5indicatesaverageperformance.Theaver‐
age
scoreofthisexperimentisapproximately0.4,whichindicatesthatthemodelhasa
certainpredictiveabilityonthisdatasetasa whole,butthereisstillroomforimprove‐
ment.
Figure 10. Function count.
Sensors2025,25,xFORPEERREVIEW 20 of 25
Figure10.Functioncount.
Figure11.Paretofrontier.
ToverifytheperformanceofBayesianoptimizationinoptimizingtheparametersof
theobjectivefunction,a5‐foldcross‐validationmethodwasadoptedinthisstudy.The
experimentalresultsareshowninFigure12.Itcanbeclearlyseenthattheperformance
ofthismodelduringthe5‐foldcross‐vali da tio n
processisrelativelystable,withasmall
fluctuationrangeoftheSingleScores,whichfullyindicatesthatthemodelhasacertain
fittingability.Generallyspeaking,across‐validationscorewithi n0.2canbere ga rd ed
asexcellent, andascorebetween0.2and0.5indicatesaverageperformance.Theaver‐
age
scoreofthisexperimentisapproximately0.4,whichindicatesthatthemodelhasa
certainpredictiveabilityonthisdatasetasa whole,butthereisstillroomforimprove‐
ment.
Figure 11. Pareto frontier.
Sensors 2025, 25, 1872
20 of 24
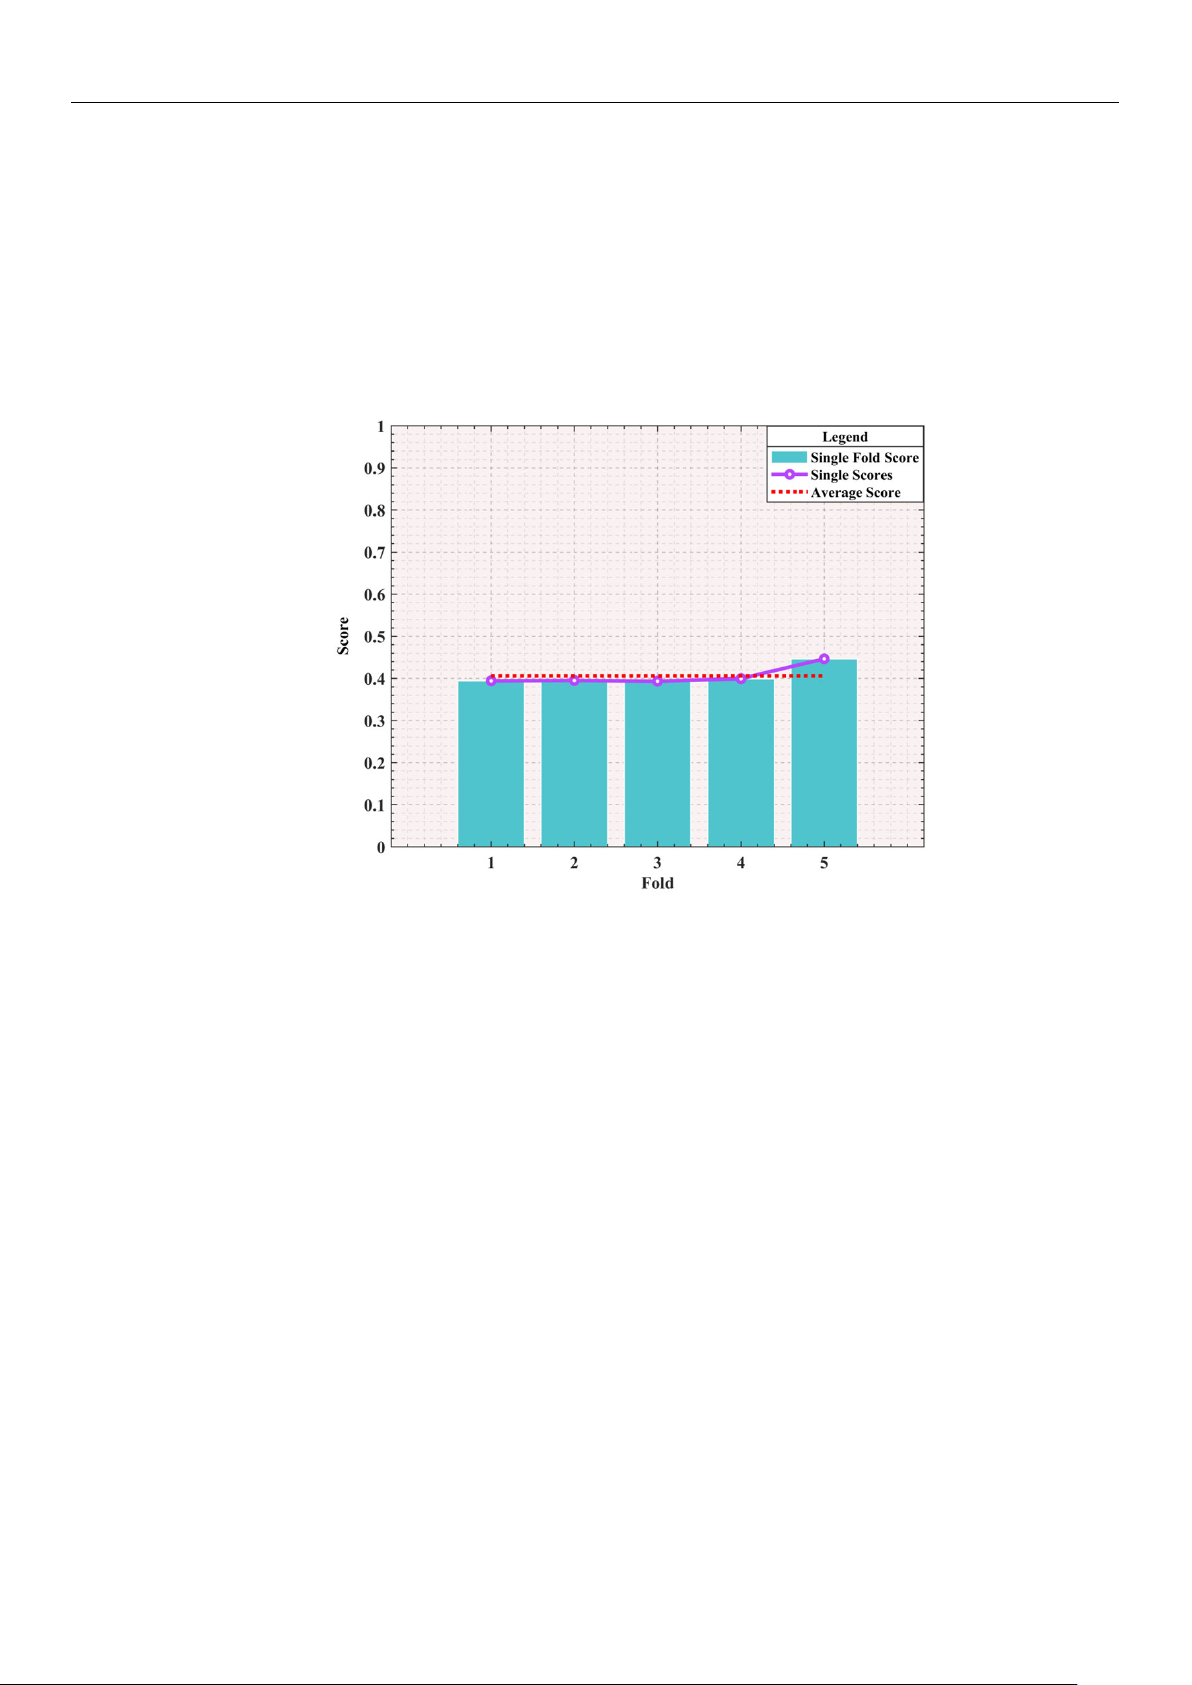
To verify the performance of Bayesian optimization in optimizing the parameters of
the objective function, a 5-fold cross-validation method was adopted in this study. The
experimental results are shown in Figure 12. It can be clearly seen that the performance
of this model during the 5-fold cross-validation process is relatively stable, with a small
fluctuation range of the Single Scores, which fully indicates that the model has a certain
fitting ability. Generally speaking, a cross-validation score within 0.2 can be regarded as
excellent, and a score between 0.2 and 0.5 indicates average performance. The average
score of this experiment is approximately 0.4, which indicates that the model has a certain
predictive ability on this dataset as a whole, but there is still room for improvement.
Sensors2025,25,xFORPEERREVIEW 21 of 25
Figure12.K‐FoldCrossValidationPerformance(K=5).
AccordingtothedataprovidedinTable10,Bayesianoptimizationisusedtoselect
thesecond‐generationsimulationresultswiththeminimumobjectivefunctionvalue.This
selection is based on minimization of the target value during the iteration. Figure 10.
clearly shows the dynamic change in the target value with the
iteration, making the
changeprocessclear. Fu rtheranalysisofFigure11, theminimumvalues ofF
1
andF
2
,
respectively,reach5.6294sand115.937mm/s.Andthetwominimumvaluesare,respec‐
tively,locatedatthetwoendsoftheParetofrontiercomposedofthereddots.Tooptimize
boththetimeandimpact,anoptimaladvantagemustbefoundontheParetofrontier.A
specificpoint
isidentifiedinFigure11 ,whichachievesanoptimalbalancebetweenthe
timeandimpact.Whena
max
andj
max
are78.1476mm/s
2
and119.8756mm/s
3
,thetimeand
impactoftheParetooptimalvalueare5.8028sand167.5427mm/s,respectively.
Usingthecomputeda
max
andj
max
,thesedataarereintegratedintothetrajectoryplan‐
ningoftheS‐shapedspeedcurve.Throughthisprocess,itispossibletoaccuratelydeter‐
minethepartialdisplacementofthetrajectoryplanninginthedirectionsoftheX‐axisand
Y‐axis,aswellastheassociatedcombinedvelocities,combined
accelerations,andcom‐
binedaccelerations,asshowninFigure13.Thesefiguresclearlyshowthattheplanned
S‐shapedspeedcurveexhibitedsmoothcharacteristicsduringmovement ,effectively
avoidingsuddenchangesandshocks.Thisisextremelyimportantforprecisionopera‐
tionssuchaswafer handling,asithelpsreducethedamage
thatcanbecausedbyimpact.
Table10.TheiterativegraphofBayesianthresholds.
Iteration Objective BestSoFar(Observed) BestSoFar(Estimated) Threshold
1
Threshold
2
Threshold
3
1 — — — 0.4227 0.7616 0.5225
2 0.3936 0.3936 0.4255 0.0989 0.7764 0.5705
3 0.3952 0.3936 0.3936 0.1721 0.7210 0.7933
4 0.3969 0.3936 0.3932 0.0752 0.4968 0.5437
5 0.3953 0.3936 0.3942 0.1403 0.6057 0.7633
6 0.3991 0.3936 0.3946 0.0500 0.5764 0.5441
7 0.3957 0.3936 0.3949 0.1485 0.5278 0.4003
8 0.3969 0.3936 0.3951 0.1113 0.7425 0.4637
9 0.3955
0.3936 0.3951 0.1592 0.7106 0.7313
10 0.3979 0.3936 0.3958 0.1587 0.6833 0.6341
Figure 12. K-Fold Cross Validation Performance (K = 5).
According to the data provided in Table 10, Bayesian optimization is used to select
the second-generation simulation results with the minimum objective function value. This
selection is based on minimization of the target value during the iteration. Figure 10. clearly
shows the dynamic change in the target value with the iteration, making the change process
clear. Further analysis of Figure 11, the minimum values of F
1
and F
2
, respectively, reach
5.6294 s and 115.937 mm/s. And the two minimum values are, respectively, located at the
two ends of the Pareto frontier composed of the red dots. To optimize both the time and
impact, an optimal advantage must be found on the Pareto frontier. A specific point is
identified in Figure 11, which achieves an optimal balance between the time and impact.
When a
max
and j
max
are 78.1476 mm/s
2
and 119.8756 mm/s
3
, the time and impact of the
Pareto optimal value are 5.8028 s and 167.5427 mm/s, respectively.
Using the computed a
max
and j
max
, these data are reintegrated into the trajectory planning
of the S-shaped speed curve. Through this process, it is possible to accurately determine the
partial displacement of the trajectory planning in the directions of the X-axis and Y-axis, as well
as the associated combined velocities, combined accelerations, and combined accelerations,
as shown in Figure 13. These figures clearly show that the planned S-shaped speed curve
exhibited smooth characteristics during movement, effectively avoiding sudden changes and
shocks. This is extremely important for precision operations such as wafer handling, as it
helps reduce the damage that can be caused by impact.