s25061872.pdf - 第7页
Sensors 2025 , 25 , 1872 7 of 24 2.3.2. The Improvement of the S-Shaped Speed Curve T rajectory planning is a crucial step in the robotic motion control. When the wafer- handling robotic arm is in operation, it frequentl…
Sensors 2025, 25, 1872
6 of 24
where F
1
, F
1min
, and w
1
are the objective function, minimum value, and weight value of
time, respectively. F
2
, F
2min
, and w
2
are the objective function, minimum value, and weight
of impact, respectively. h
i
is the time interval between the i-th and i + 1-th interpolation
point. t
i
and j
i
denote the time node and jerk value of the i-th interpolation point.
θ
max
,
v
max
, a
max
, and j
max
are the maximum rotational angle, speed, acceleration, and jerk of the
joint of the manipulator arm, respectively.
2.3. The Construction of Trajectory Planning
2.3.1. The Explanation of S-Shaped Speed Curve
The T-shaped speed curve is a widely used method for robotic arm control. Because
of its simplicity and ease of control, it is extremely common in industrial applications.
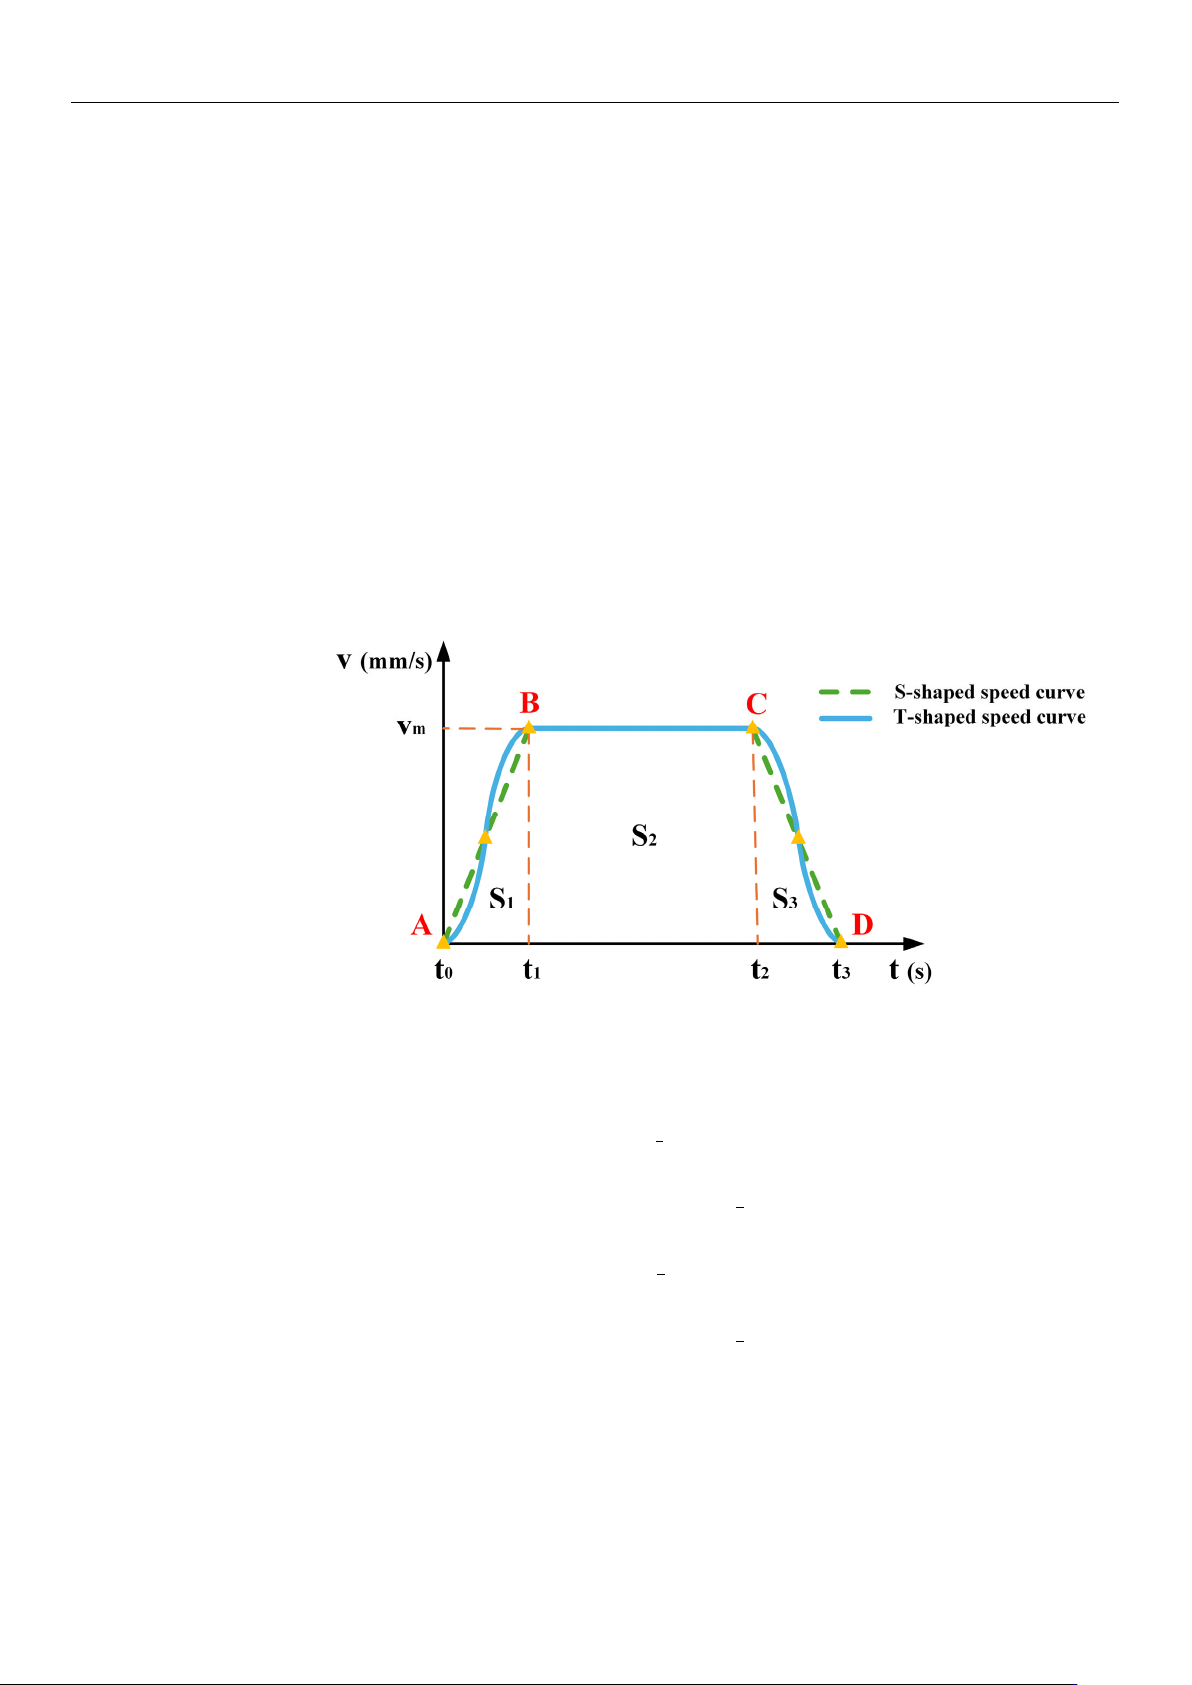
As shown in Figure 3, this curve may produce large impacts and vibrations at points
A, B, C, and D, potentially causing the wafer to break. By contrast, the S-shaped speed
curve uses nonlinear adjustments to increase and decrease the velocity, making the motion
process smoother and effectively solving the discontinuity problem of the acceleration of
the
T-shaped
speed curve. Therefore, the S-shaped speed curve is more suitable in scenarios
requiring higher operational stability.
Sensors2025,25,xFORPEERREVIEW 7 of 25
localtimeperiodofpartk,whichreferstothedifferencefromthestartingpointofthe
currentpart,calledtimezero,tothetimepointofthecurrentpart.Theequationused
τ
k = tk−tk−1(k=1,2,…7). vk ( k=1,2,…6)representsthefinalspeed ofpart kandvs.
repres entsthei nitialspeed.a
maxisthemaximumacceleration.jmaxisthemaximumaccel‐
eration.
Figure3.CorrelationchartbetweentheT‐shapedandS‐shapedspeedcurves.
2.3.2.TheImprovementoftheS‐ShapedSpeedCurve
Trajectoryplanningisacrucialstepintheroboticmotioncontrol.Whenthewafer‐
handlingroboticarmisinoperation,itfrequentlyencountersturningpointswherethe
directionofmovementrequiresalteration.Theseturningpointsoftenserveasasourceof
abrupt
jerkchanges.Toalleviatethisproblem,anS‐shapedspeedcurveadopts acircular
arctransitionstrategytoguaranteeasmoothtrajectorytransition.Thisstrategynotonly
mitigates the impact and vibrationinduced by therobotic arm but also contributes to
shorteningtheexecutiontimeofthemotiontrajectory.Prior
toconstructingtheS‐shaped
speedcurve,itisimperativetodeterminethekeyinterpolationpointsofthetrajectoryin
Cartesianspace,asindicatedinTable2.Simultaneously,theprincipal motionparameters
mustbesetaspresentedinTable3.v_p
0,v_p1,andv_p2arethevelocitiesoftheinitial
point,thecirculararctransitionsection,andtheterminalpoint,respectively.v
max,amax,and
jmaxdenotethemaximumvelocity,themaximumacceleration,andthemaximumrateof
changeintheaccelerationofanendeffectorinCartesianspace,respectively.ristheradius
ofthecirculararctransitionattheinflectionpoint.
Table2.SegmentationpointsinCartesianspace.
StartingPoint IntermediatePoint EndingPoint
(400,0,400) (200,0,400) (200,200,400)
Table3.ThemainmotionparametersoftheS‐shapedspeedcurve.
v_p0
(mm/s)
v_p
1
(mm/s)
v_p
2
(mm/s)
v
max
(mm/s)
a
max
(mm/s
2
)
j
max
(mm/s
3
)
r
(mm)
0 100 0 100 100 100 30
ThetrajectorycurveshowninFigure4.canbegeneratedby applyingtheparameters
listedin Table 3. to the S‐shaped speedcurve model. In thisfigure, the black lines
represent the direct path without a circular transition, whereas the blue lines show a
smoothpathwitha circulartra nsiti on.
Itisno te wort hythattheradiusofthecircular
Figure 3. Correlation chart between the T-shaped and S-shaped speed curves.
The S-shaped speed curve partitions the entire motion process into seven distinct
phases. Equation (5) describes the motion characteristics at different stages.
v(t) =
v
s
+
1
2
j
max
τ
2
1
0 ≤ t ≤ t
1
v
1
+ a
max
τ
2
t
1
≤ t ≤ t
2
v
2
+ a
max
τ
3
−
1
2
j
max
τ
2
3
t
2
≤ t ≤ t
3
v
3
t
3
≤ t ≤ t
4
v
4
−
1
2
j
max
τ
2
5
t
4
≤ t ≤ t
5
v
5
− a
max
τ
6
t
5
≤ t ≤ t
6
v
6
− a
max
τ
7
+
1
2
j
max
τ
2
7
t
6
≤ t ≤ t
7
(5)
where t
k
(k = 0, 1, . . . 7) represents the transition point time of part k, which indicates the specific
point in time at which each stage begins or ends.
τ
k
(k = 0, 1, .. . 7) represents the local time
period of part k, which refers to the difference from the starting point of the current part, called
time zero, to the time point of the current part. The equation used
τ
k
= t
k
− t
k−
1
(k = 1, 2, .. . 7).
v
k
(k = 1, 2, . . . 6) represents the final speed of part k and vs. represents the initial speed. a
max
is
the maximum acceleration. j
max
is the maximum acceleration.

Sensors 2025, 25, 1872
7 of 24
2.3.2. The Improvement of the S-Shaped Speed Curve
Trajectory planning is a crucial step in the robotic motion control. When the wafer-
handling robotic arm is in operation, it frequently encounters turning points where the
direction of movement requires alteration. These turning points often serve as a source of
abrupt jerk changes. To alleviate this problem, an S-shaped speed curve adopts a circular
arc transition strategy to guarantee a smooth trajectory transition. This strategy not only
mitigates the impact and vibration induced by the robotic arm but also contributes to
shortening the execution time of the motion trajectory. Prior to constructing the S-shaped
speed curve, it is imperative to determine the key interpolation points of the trajectory in
Cartesian space, as indicated in Table 2. Simultaneously, the principal motion parameters
must be set as presented in Table 3. v_ p
0
, v_ p
1
, and v_ p
2
are the velocities of the initial
point, the circular arc transition section, and the terminal point, respectively. v
max
, a
max
, and
j
max
denote the maximum velocity, the maximum acceleration, and the maximum rate of
change in the acceleration of an end effector in Cartesian space, respectively. r is the radius
of the circular arc transition at the inflection point.
Table 2. Segmentation points in Cartesian space.
Starting Point Intermediate Point Ending Point
(400, 0, 400) (200, 0, 400) (200, 200, 400)
Table 3. The main motion parameters of the S-shaped speed curve.
v_ p
0
(mm/s)
v_ p
1
(mm/s)
v_ p
2
(mm/s)
v
max
(mm/s)
a
max
(mm/s
2
)
j
max
(mm/s
3
)
r
(mm)
0 100 0 100 100 100 30
The trajectory curve shown in Figure 4. can be generated by applying the parameters
listed in Table 3. to the S-shaped speed curve model. In this figure, the black lines represent
the direct path without a circular transition, whereas the blue lines show a smooth path
with a circular transition. It is noteworthy that the radius of the circular transition can be
adjusted according to specific work requirements. Overall, the circular transition not only
improves the smoothness and efficiency of the robotic arm’s motion but also helps to protect
the robotic arm and its payload, while enhancing the overall operational performance.
This transition method allows the robotic arm to perform complex tasks more accurately
and reliably.
Sensors2025,25,xFORPEERREVIEW 8 of 25
transitioncanbeadjustedaccordingtospecificworkrequirements.Overall,thecircular
transitionnotonlyimprovesthesmoothnessandefficiencyoftheroboti carm’smotion
but also helpstoprotectthe roboticarmandits payload, whileenhancing the overall
operational performance. This transition method allows the robotic arm
to pe rf or m
complextasksmoreaccuratelyandreliably.
Figure4.Contrastdiagramofarctransitionandright‐anglepath.
ByanalyzingthedatainTable2,itisclearthatthistrajectoryplanningtaskinvolves
threekeynodesthattheroboticarmmustreachinsequence.S‐shapedspeedcurve
planningisastandardpoint‐to‐pointstart–stopmotionscheme.Specifically,thistaskis
representedbytwomovementsfrom
thestartingpointtothemiddlepoint andthen
fromthemiddlepointtotheendpoint,withzerostartingandendingspeedsforeach
movement.BasedonthedatainTable3,thevelocityimageoftheschemeisshownin
Figure5.However,thisschemecausesthemanipulator
tofrequentlystartandstop,which
notonlyincreasesthevibrationduringthemotionprocessbutalsoleadstotimewastage
intheaccelerationanddecelerationstages.Toaddressthisissue,animprovedschemeis
proposed in this study for the single‐segment start–st op mechanism, optimizing the
startingandstoppingparts
oftheintermediateprocessintoasmoothmotionmodewith
constantspeedsatbothends,asshowninFigure6.Whenthevelocityofthefirstsegment
ofmotionattainsthemaximumva lueofthesetparameters,insteadof reducingthe
velocitybacktozeroasinthestandardscheme,
thesecondsegmentofmotionproceeds
inauniformtransitionmanner.Thespecificpara mete rsstillrefertoTable 3.This
improved scheme effectively mitigates the limitations inherent in the conventiona l
approach.Simultaneously,themovementefficiencycanbeimprovedand thevi bra ‐
tioncanbereduced.
Figure5.Thecontinuousstart–stopS‐shapedspeedcurve.
Figure 4. Contrast diagram of arc transition and right-angle path.
Sensors 2025, 25, 1872
8 of 24
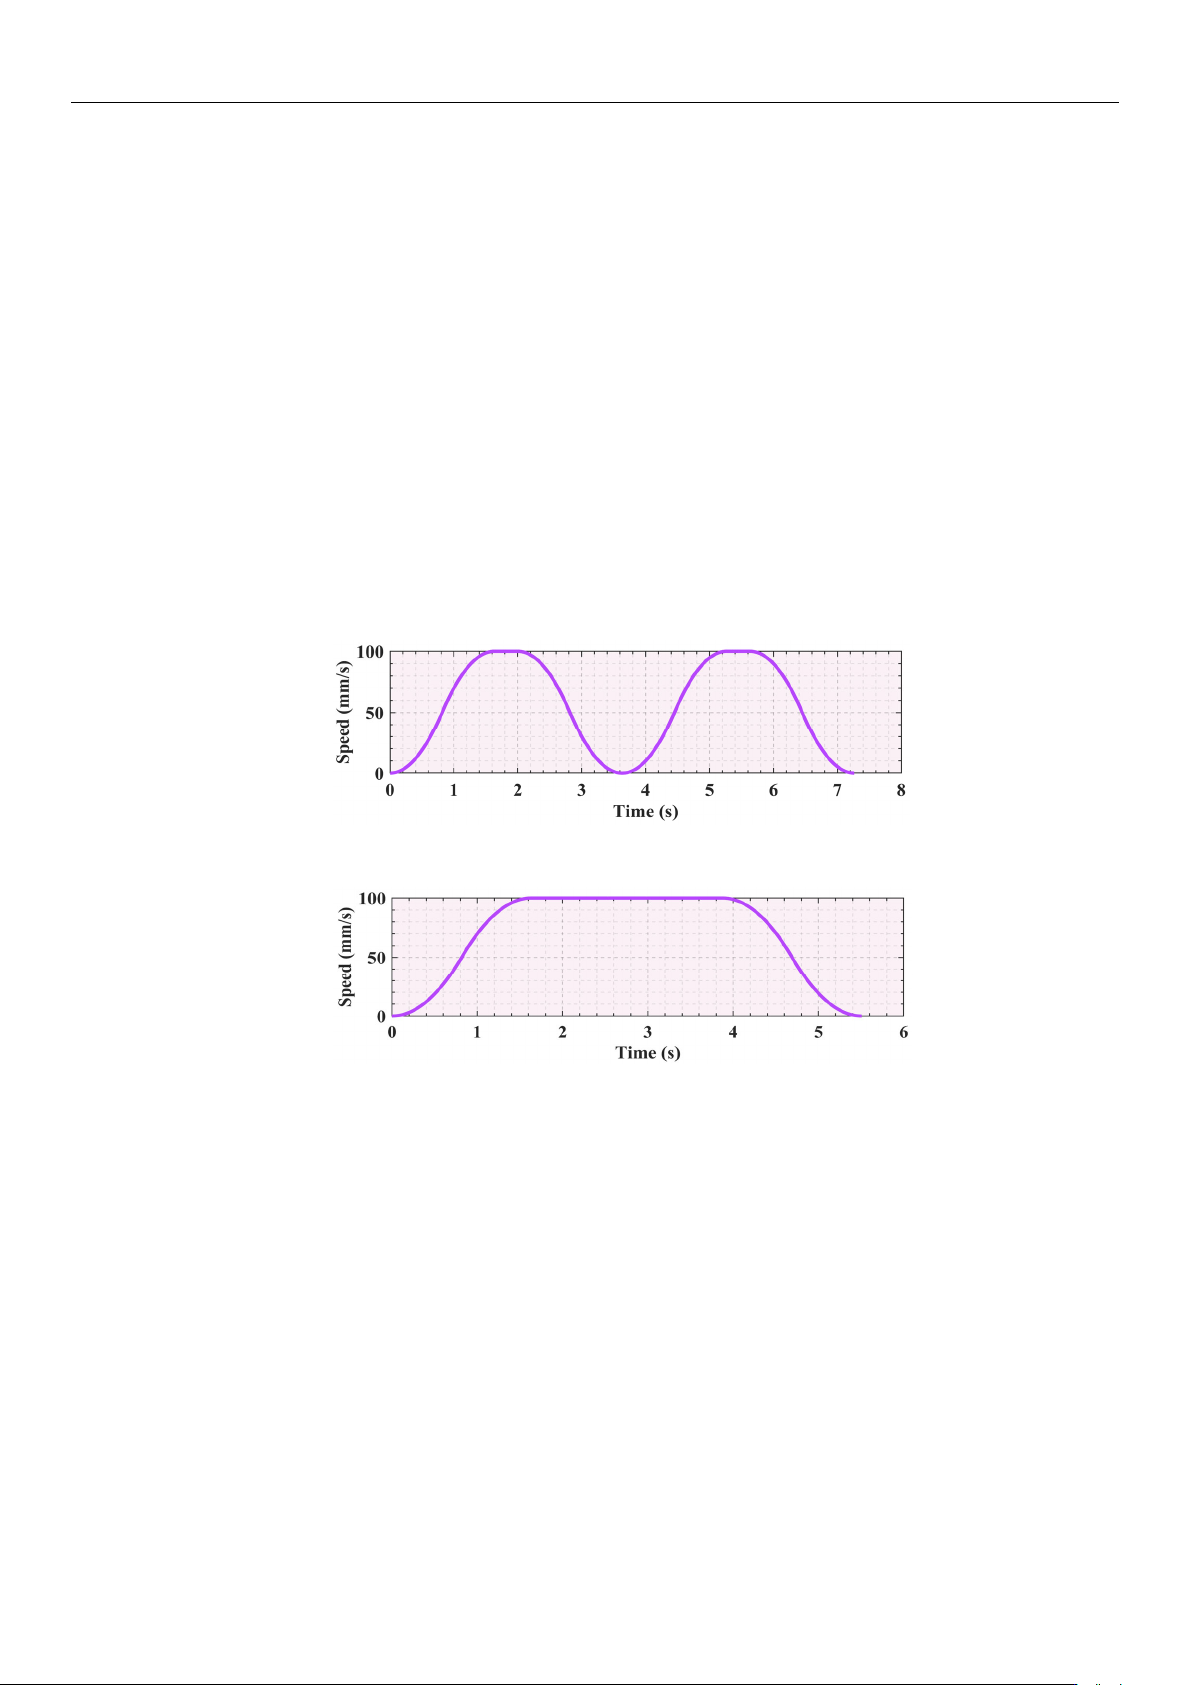
By analyzing the data in Table 2, it is clear that this trajectory planning task involves
three key nodes that the robotic arm must reach in sequence. S-shaped speed curve planning
is a standard point-to-point start–stop motion scheme. Specifically, this task is represented
by two movements from the starting point to the middle point and then from the middle
point to the end point, with zero starting and ending speeds for each movement. Based
on the data in Table 3, the velocity image of the scheme is shown in Figure 5. However,
this scheme causes the manipulator to frequently start and stop, which not only increases
the vibration during the motion process but also leads to time wastage in the acceleration
and deceleration stages. To address this issue, an improved scheme is proposed in this
study for the single-segment start–stop mechanism, optimizing the starting and stopping
parts of the intermediate process into a smooth motion mode with constant speeds at both
ends, as shown in Figure 6. When the velocity of the first segment of motion attains the
maximum value of the set parameters, instead of reducing the velocity back to zero as in the
standard scheme, the second segment of motion proceeds in a uniform transition manner.
The specific parameters still refer to Table 3. This improved scheme effectively mitigates the
limitations inherent in the conventional approach. Simultaneously, the movement efficiency
can be improved and the vibration can be reduced.
Sensors2025,25,xFORPEERREVIEW 8 of 25
transitioncanbeadjustedaccordingtospecificworkrequirements.Overall,thecircular
transitionnotonlyimprovesthesmoothnessandefficiencyoftheroboti carm’smotion
but also helpstoprotectthe roboticarmandits payload, whileenhancing the overall
operational performance. This transition method allows the robotic arm
to pe rf or m
complextasksmoreaccuratelyandreliably.
Figure4.Contrastdiagramofarctransitionandright‐anglepath.
ByanalyzingthedatainTable2,itisclearthatthistrajectoryplanningtaskinvolves
threekeynodesthattheroboticarmmustreachinsequence.S‐shapedspeedcurve
planningisastandardpoint‐to‐pointstart–stopmotionscheme.Specifically,thistaskis
representedbytwomovementsfrom
thestartingpointtothemiddlepoint andthen
fromthemiddlepointtotheendpoint,withzerostartingandendingspeedsforeach
movement.BasedonthedatainTable3,thevelocityimageoftheschemeisshownin
Figure5.However,thisschemecausesthemanipulator
tofrequentlystartandstop,which
notonlyincreasesthevibrationduringthemotionprocessbutalsoleadstotimewastage
intheaccelerationanddecelerationstages.Toaddressthisissue,animprovedschemeis
proposed in this study for the single‐segment start–st op mechanism, optimizing the
startingandstoppingparts
oftheintermediateprocessintoasmoothmotionmodewith
constantspeedsatbothends,asshowninFigure6.Whenthevelocityofthefirstsegment
ofmotionattainsthemaximumva lueofthesetparameters,insteadof reducingthe
velocitybacktozeroasinthestandardscheme,
thesecondsegmentofmotionproceeds
inauniformtransitionmanner.Thespecificpara mete rsstillrefertoTable 3.This
improved scheme effectively mitigates the limitations inherent in the conventiona l
approach.Simultaneously,themovementefficiencycanbeimprovedand thevi bra ‐
tioncanbereduced.
Figure5.Thecontinuousstart–stopS‐shapedspeedcurve.
Figure 5. The continuous start–stop S-shaped speed curve.
Sensors2025,25,xFORPEERREVIEW 9 of 25
Figure6.Theimprovedstart–stopS‐shapedspeedcurve.
ComparingFigures5and6,itcanbeseenthattheimprovedmotionschemeresults
inasmootherspeedcurve.Concurrently,iteffectivelyreducesthevibrationgenerated
bythemot orduringstarting andstopping.Wit hthebasic para metersunchanged,
theunoptimized timeschedulewhich doesnot include arcadjustment and smooth
transitiontook7.26s,whereas theoptimizedtimeschedule, whichincludesarcadjust‐
mentandsmoothtransition,isshortenedto5.51s.Afterthetwopartsareoptimized,the
totaltimeissavedby1.75s,a24.1%reductioncomparedtotheoriginalscheme.
2.4.ImprovedSnakeOptimizationAlgorithm
2.4.1.
InitializationPopulationofaTentChaoticMap
Thesnakeoptimization(SO)algorithmisanintelligentoptimizationtechniquethat
simulatesthespecificmatingbehaviorofsnakes.Itachievesaneffectivebalancebetween
globalandlocalsearchesbyusingauniquesearchmechanism.Intheinitializationphase
ofthealgorithm,individuals
inthepopulationareequallydividedintomaleandfemale
individuals.ThecompositionofthisinitialpopulationcanberepresentedbyEquation(6),
wherethenumbersofmaleandfemaleindividualsarerepresentedbyEquations(7)and
(8),respectively.
()
i
X
lb rand ub lb
(6)
2
m
N
N
(7)
f
m
NNN
(8)
whereX
idenotesthepositionofthei‐thindividual.Therandomfunction‘rand’generates
arealrandomnumberbetween0and1.TheupperandlowerboundsofXiareubandlb,
respectively.N isthetotalpopulationsize. N
m andNfare the numbers of individual
malesandfemales,respectively.
However,theuseofthefunction‘rand’inEquation(6)oftheSOalgorithmmayresult
inanunevendistributionofrandomnumbers.Moreover,becausethisfunctionisbased
onadeterministicalgorithm,thesamerandomsequenceisgeneratedwhen
thesameseed
isgiven.Thissituationmayleadtotheprematureconvergenceoftheheuristicalgorithm
tothelocaloptimalsolution,makingitchallengingtofindtheglobaloptimalsolution.To
addressthisissueinpopulationinitialization,thisstudyintroducesaTentChaoticMap.
Ithas excellentchaoticcharacteristics,
whichcaneffectivelyimprove the uniformityof
population distri buti on. In addition, co mpa re d with Sine and Logistic chaotic map
[32,33],itsimplementationismore intuitiveandsimple,whileSineandLogisticchaotic
map’slatedepthsearchabilityisweak,whichmaycausethealgorithmtofallinto local
optimal. At the
same time, thedistributi o n of theiroutput sequencemay be uneven
undercertainpa ra m etervalues.Asaconsequence,theTentChaosmapisagoodchoice
Figure 6. The improved start–stop S-shaped speed curve.
Comparing Figures 5 and 6, it can be seen that the improved motion scheme results
in a smoother speed curve. Concurrently, it effectively reduces the vibration generated
by the motor during starting and stopping. With the basic parameters unchanged, the
unoptimized time schedule which does not include arc adjustment and smooth transition
took 7.26 s, whereas the optimized time schedule, which includes arc adjustment and
smooth transition, is shortened to 5.51 s. After the two parts are optimized, the total time is
saved by 1.75 s, a 24.1% reduction compared to the original scheme.
2.4. Improved Snake Optimization Algorithm
2.4.1. Initialization Population of a Tent Chaotic Map
The snake optimization (SO) algorithm is an intelligent optimization technique that simu-
lates the specific mating behavior of snakes. It achieves an effective balance between global and
local searches by using a unique search mechanism. In the initialization phase of the algorithm,
individuals in the population are equally divided into male and female individuals. The compo-