AOI_RS_v85_en.pdf - 第111页
Chap ter3 SPC User Ma nual AOI Repair Station 107 After selecting the items you want to view , click on the [ OK ] button. The lower part of the screen displa y s the Statistical data of the selected components and sol…
Chapter3 SPC User Manual
AOI Repair Station
106
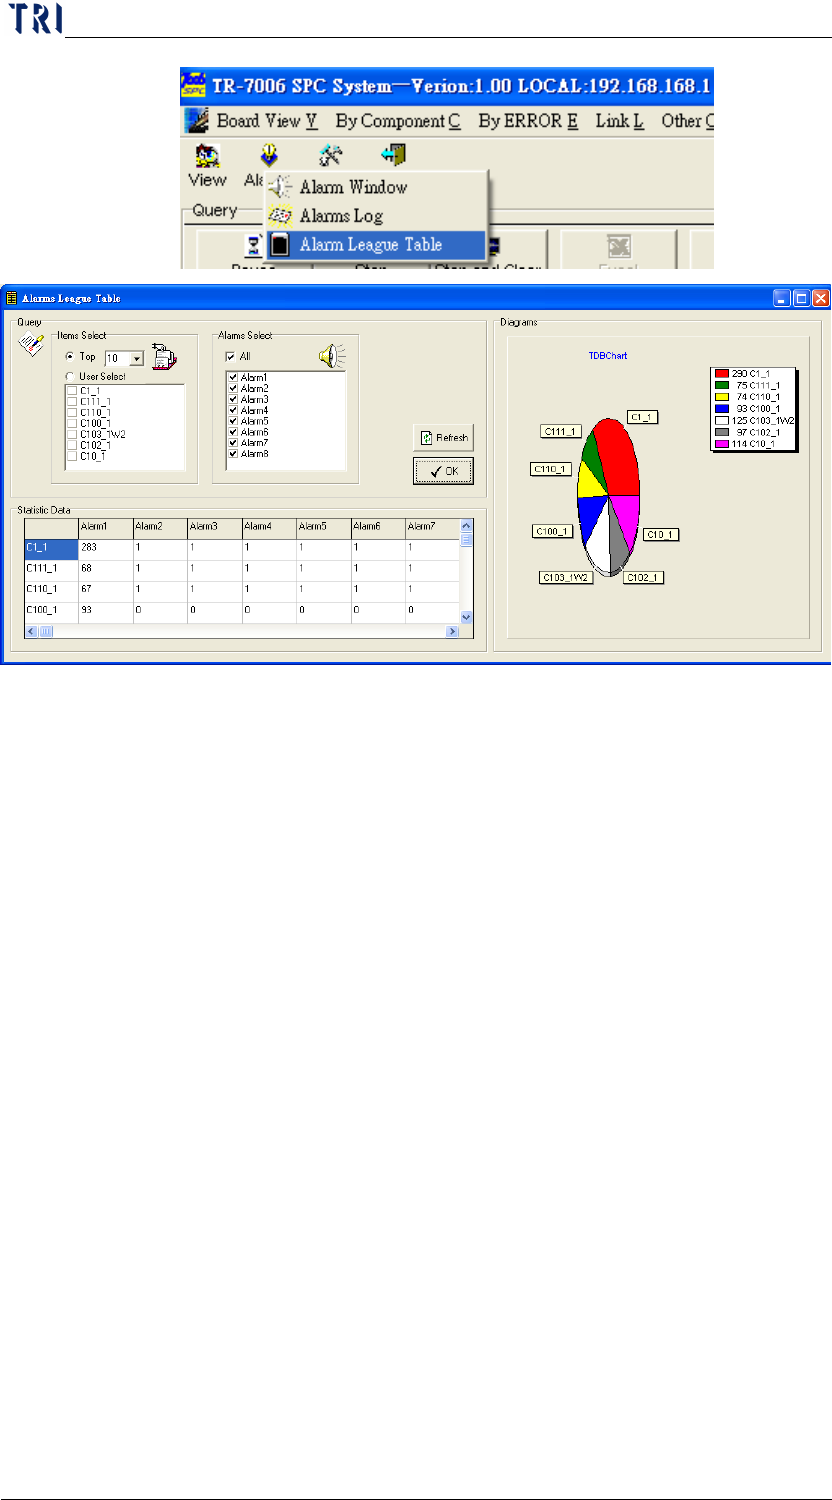
The [Query] block located on the upper left corner of the screen
allows you to choose how you want to view the distribution data.
The [Items Select] option in this area allows you to select the
distribution status components and solders for viewing. The first
type is to select the top numbers while the second type is to select
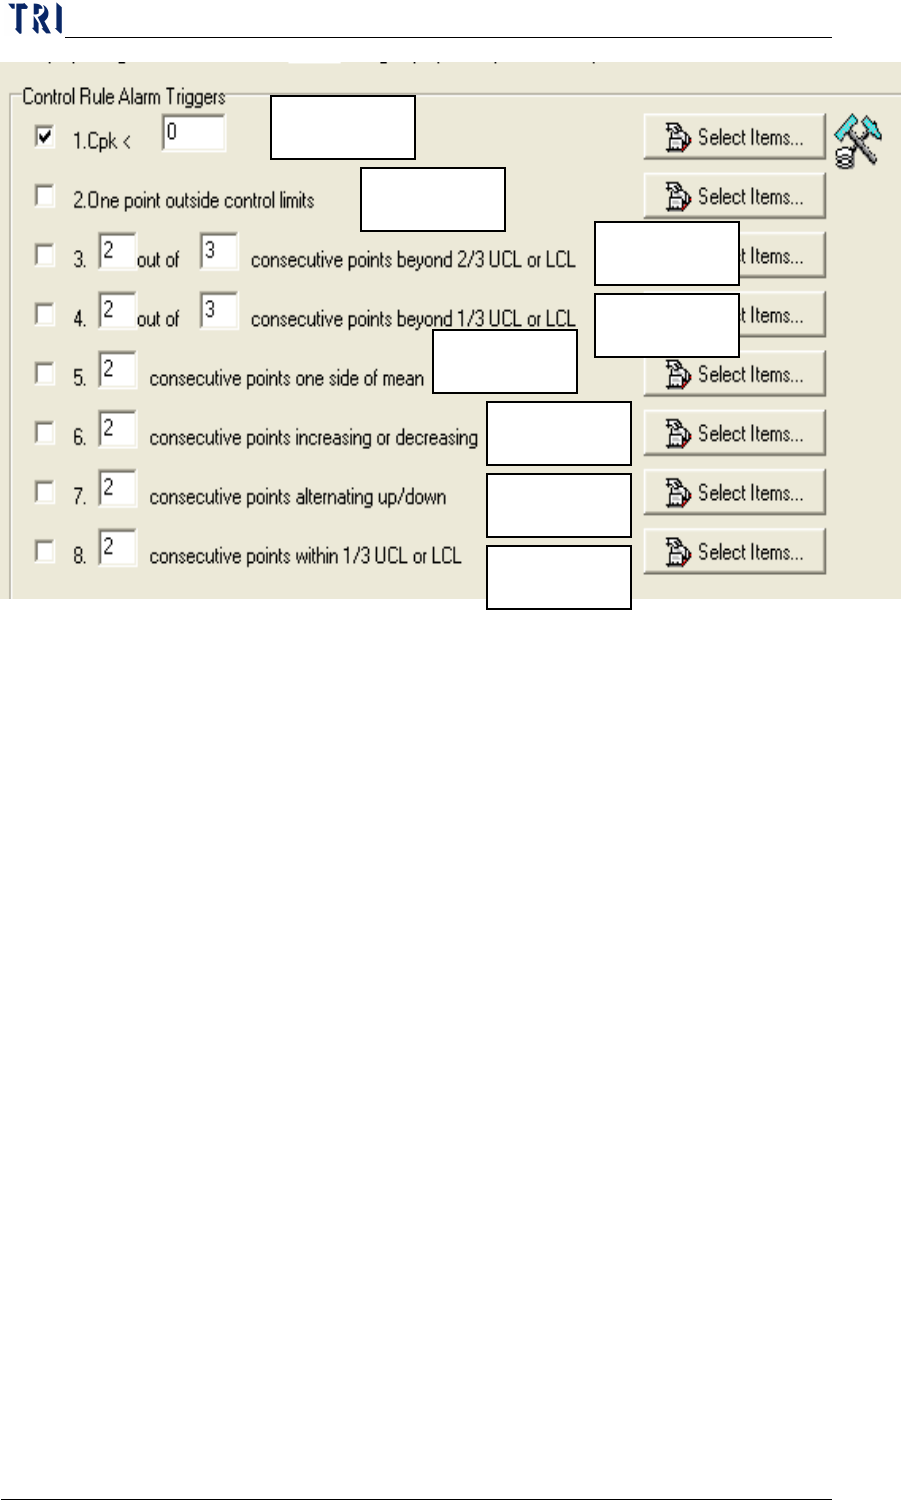
specific components and solders. [Alarms Select] chooses to
perform the statistics of the number of occurrences for what type of
errors. Alarms 1 to 8 are the same as the 8 items in [Control Rule
Alarm Triggers] under [Parameter].
Chapter3 SPC User Manual
AOI Repair Station
107
After selecting the items you want to view, click on the [OK]
button. The lower part of the screen displays the Statistical data of
the selected components and solders. The right side of the screen
displays the distribution conditions.
7.3.1.3 Setting: Functions under this category are used to set the
parameters before monitoring. Refer to [Before Monitoring] for
the detailed description.
7.3.2 Real-time monitor setup area: This area allows the user to set up the
real-time monitor items. Refer to “Before Monitoring” for the
detailed description.
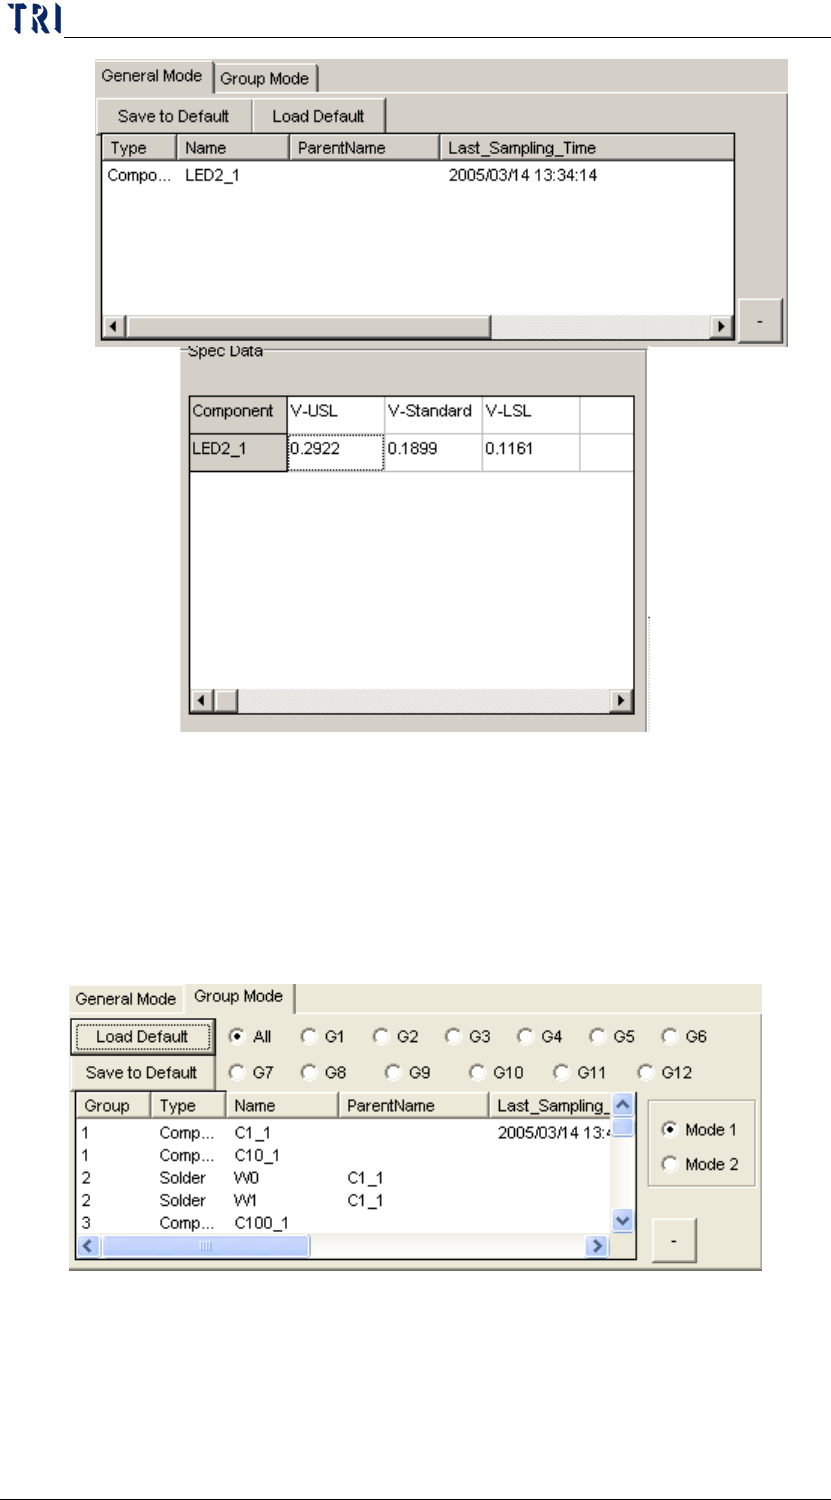
7.3.3 Real-time monitor spec. data area: This area displays the upper limit,
lower limit and standard deviation data of the real-time monitor items .
General Mode: If you select the General Mode, the displayed spec data
is the upper spec limit, lower spec limit and the standard deviation of
the monitoring items as shown below.
Alarm1
Alarm2
Alarm3
Alarm4
Alarm5
Alarm6
Alarm7
Alarm8
Chapter3 SPC User Manual
AOI Repair Station
108
a. Take the above graph for example, the V-USL, V-Standard and
V-LSL data displayed in “Spec Data” are the upper spec limit,
standard deviation and lower spec limit of “LED2_1”.
Group Mode: If you select the Group Mode, the displayed spec data is
the average of upper spec limit, lower spec limit and the standard
deviation of the monitoring items in the group.