AOI_RS_v85_en.pdf - 第149页
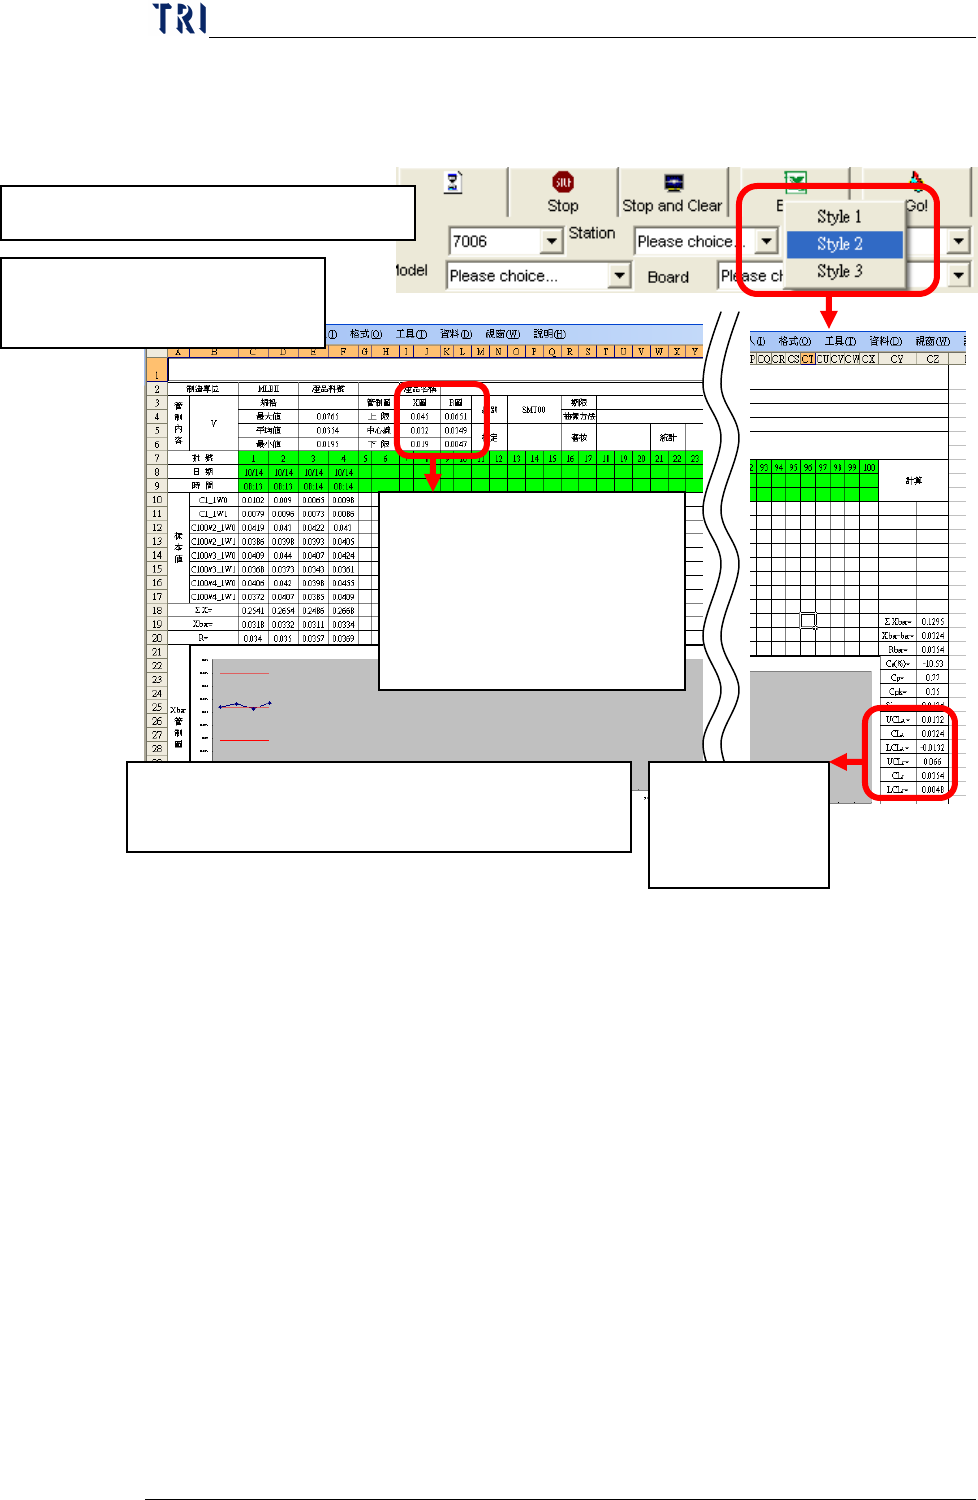
Chap ter3 SPC User Ma nual AOI Repair Station 145 S tyle 2 Report: This kind report is only for [Mode2] under [Group Mode]. 1. Click on Excel and select Style 2 2. Review Excel file: A Sheet only displays data for a gr…
Chapter3 SPC User Manual
AOI Repair Station
144
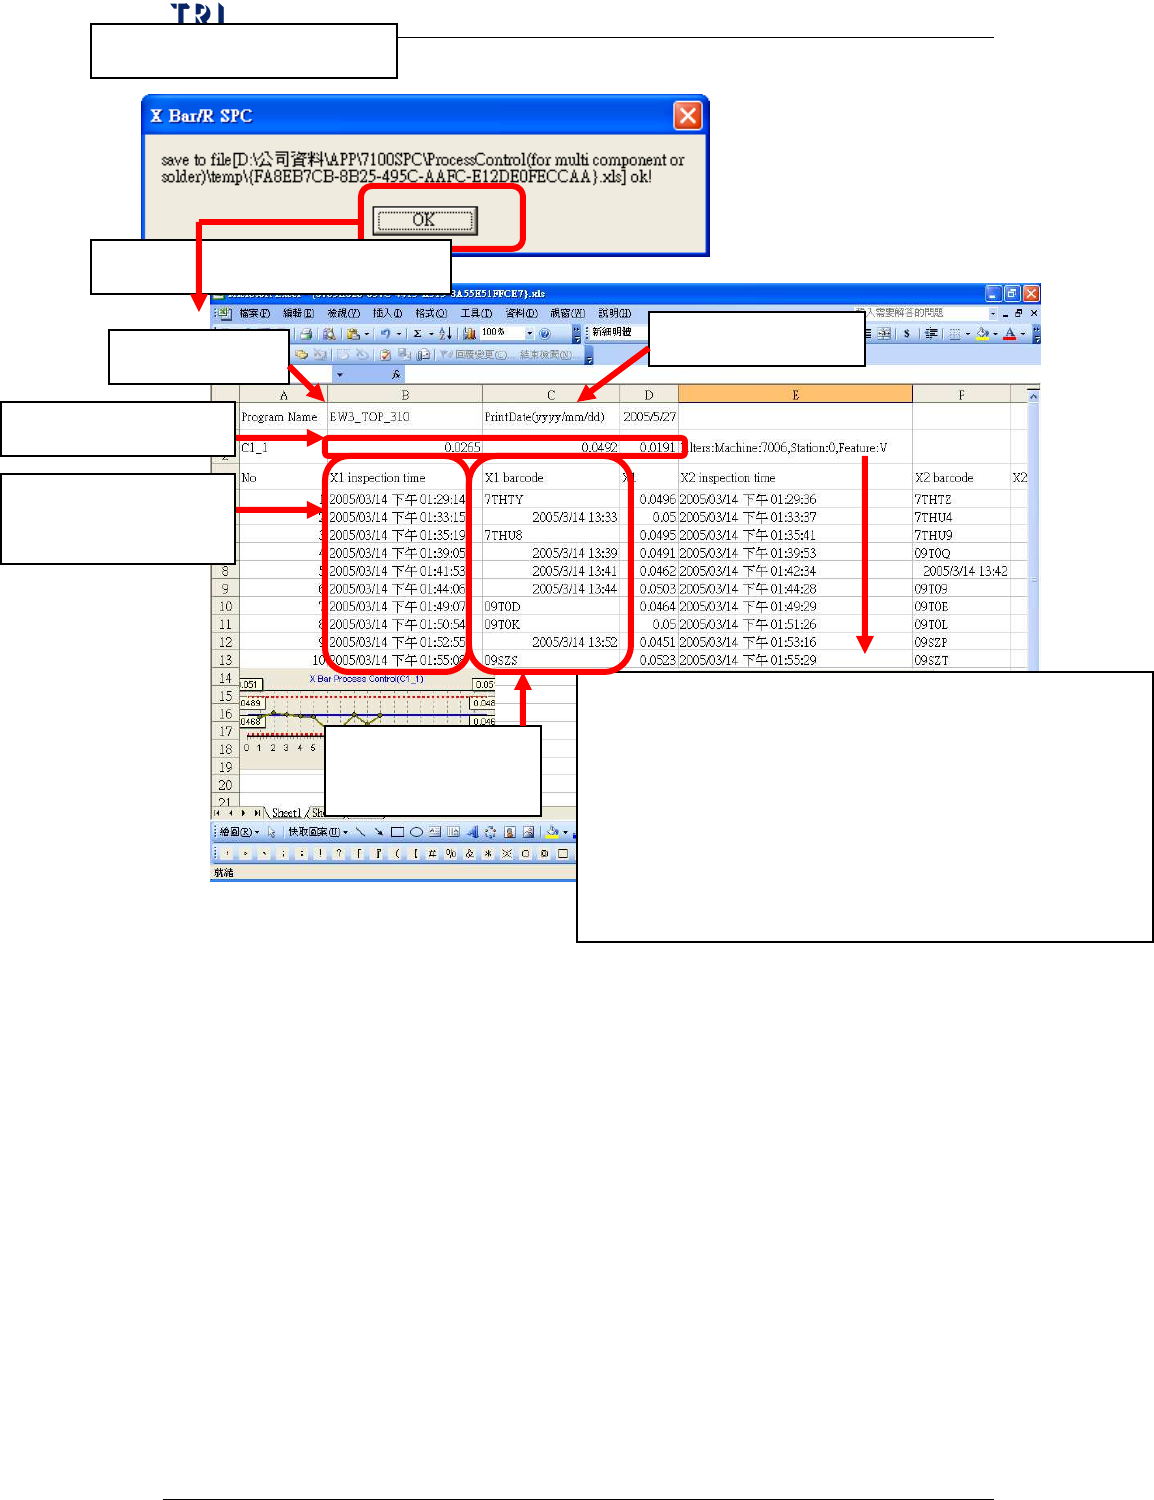
3. The success message
4. Review the Excel file
Display the monitoring condition for the component, contents are:
Machine means the type of machine, 7006, 7100 or ICT.
Station means the Machine ID
Feature means the selected feature, it may be V (Volume), A
(Area), H (Height), PX (X shift) or PY (Y shift) for 7006
(SPI); it may be X (X shift), Y (Y shift) or Theta (rotating
angle) for 7100 (AOI) and may be Measure for ICT.
Program Name
Print Date
Barcode for every
sample
Spec Data for C1_1
Inspection time for
every sample
Chapter3 SPC User Manual
AOI Repair Station
145
Style 2 Report: This kind report is only for [Mode2] under
[Group Mode].
1. Click on Excel and select Style 2
2. Review Excel file: A Sheet
only displays data for a group.
The control limits last week. If
this is data first week, for X bar
Chart we use the Spec Data and
for R Chart we use 0 to be the
control limits.
The control limits
this week up to
present.
P.S. If you change a sample data in this report, the relating
statistic data and control chart will be changed.
Chapter3 SPC User Manual
AOI Repair Station
146
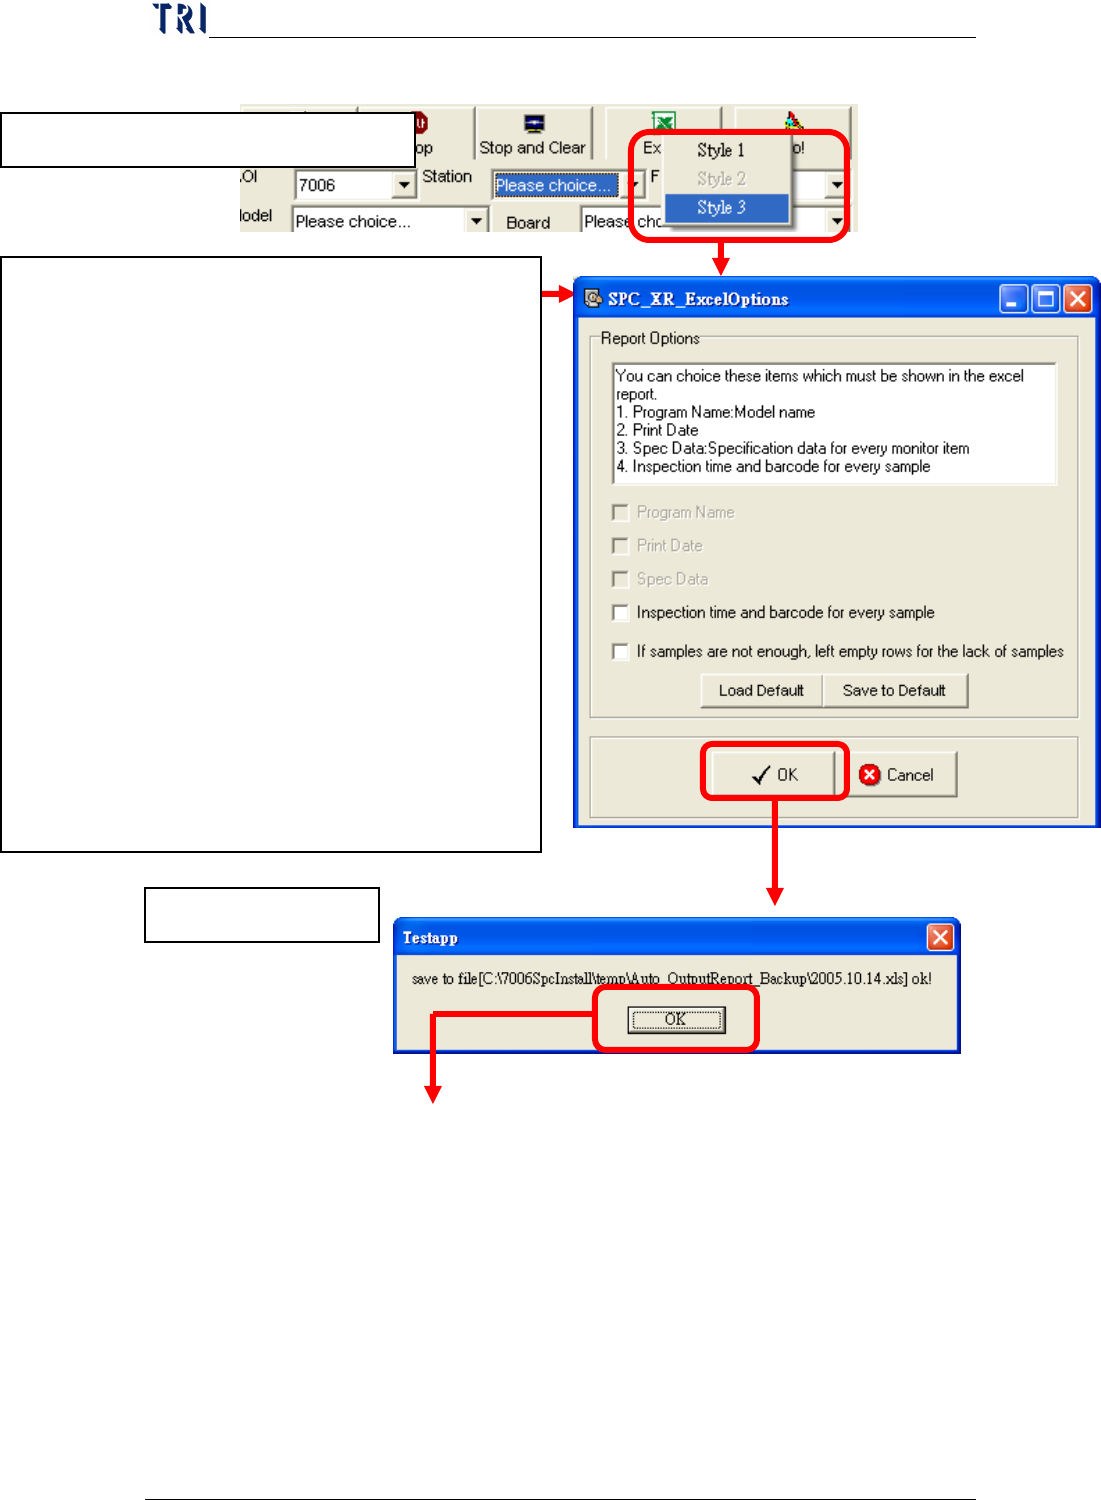
Style 3 Report
3.儲存成功訊息!
1. Click on [Excel] and select Style 3
2. Report Parameters Setting
Select the data that user wants to output besides
statistic data and control chart in Excel file. User
can select:
Program Name
Print Date
Spec Data
Inspection time and barcode for every sample:
the inspection time and barcode for the board
that every sample belongs to.
If samples are not enough, left empty rows for
the lack of samples: When the samples are not
enough, there are empty rows left for user to
key in manually. The number of samples is
time period divided by interval.